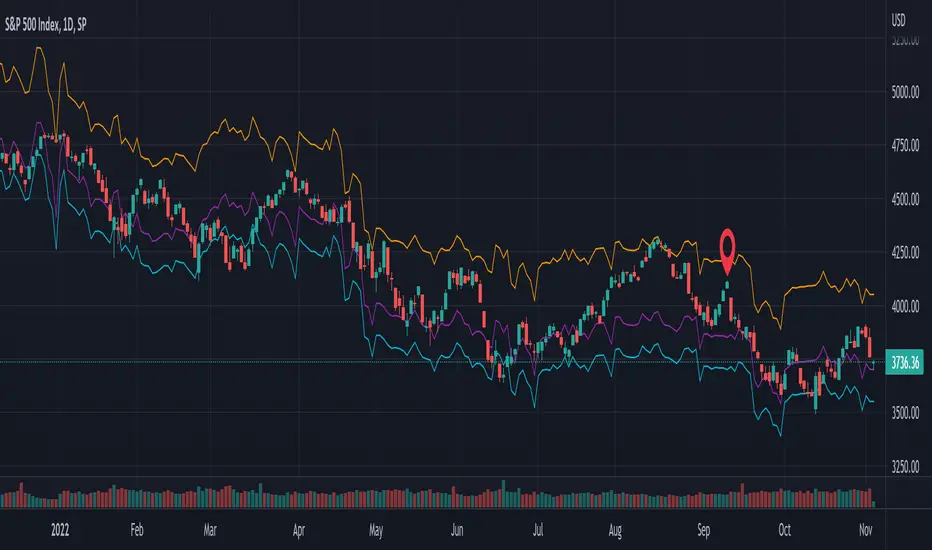
KST-Based MACDAs a follow-up to my previous script:
I am posting a stand-alone KST-based MACD.
Note that this indicator is highly laggy. Specific care must be taken when using it.
The MACD-Signal crossing is quite delayed but it is a definite confirmation.
For earlier signs, the Histogram must be analyzed. A shift from Green-White signals the 1st Bear Signal.
A MACD-Signal crossing signals the 2nd Bear SIgnal.
The same applies for bull-signs.
This indicator is useful for long-term charts on which one might want to pinpoint clear, longterm divergences.
Standard RSI, Stochastic RSI and MACD are notoriously problematic when trying to pinpoint long-term divergences.
Finally, this indicator is not meant for pinpointing entry-exit positions. I find it useful for macro analysis. In my experience, the decreased sensitivity of this indicator can show very strong signs, that can be quite laggy.
Inside the indicator there is a setting for "exotic calculations". This is an attempt to make this chart work in both linear/ negative charts (T10Y2Y) and log charts (SPX)
Tread lightly, for this is hallowed ground.
-Father Grigori
SPX (S&P 500 Index)

SPX Fair Value Bands WSHOSHOThis is a variation of the SPX Fair Value Bands indicator which uses WSHOSHO instead of WALCL.
WSHOSHO only includes the 'Securities Held Outright' portion of the Fed balance sheet. This effectively eliminates the portions related to BTFP (Bank Term Funding Program).
4C Options Expected Move (Weekly + 0DTE)This indicator plots the calculated Expected Move for BOTH Weekly and Zero Dated Expiration (0DTE) Daily options, for a quick visual reference.
Please Note: This indicator is different from our original "4C Expected Move (Weekly Options)" indicator, as it now packages the ability to ALSO plot 0DTE options expected moves along with Weekly expected moves. Many other newer features have also been implemented.
Background Information
The Expected Move (EM) is the amount that a stock is predicted to increase or decrease from its current price, based on the current level of options pricing and implied volatility.
This range can be viewed as possible support and resistance, or, once price gets outside of the range, institutional hedging actions can accelerate the move in that direction.
It can be useful to know what the weekly EM range is for a stock to understand the probabilities of the overall distance, direction and volatility for the week.
About the Indicator
This indicator plots the calculated Expected Move for BOTH Weekly and Zero Dated Expiration (0DTE) options, for a quick visual reference.
For the weekly EM, the range is based on the Weekly close of the prior week.
For the Daily EM based on 0DTE options, the range is based on the Daily close of the prior day.
The indicator will automatically start a new weekly EM plot at the beginning of the week, and a new daily EM at the beginning of each day.
The EM values must be updated weekly and/or daily.
Features
Plots the EM for the week
Plots the EM for the day, for symbols that offer daily expiration options
Plots the 2 Standard Deviation EM for both the weekly and daily EM
Labels with calculated values are plotted near the levels for quick visual aid
Settings
Can toggle weekly EM on/off
Can toggle Daily EM on/off
Can toggle 2 Standard Deviation lines on/off
Can toggle labels for all EM on/off
Robust line settings
Can adjust label location left/right based on personal preference
Can enter symbol into settings as a reference
Handy instructions in the settings
How To Set Up The Indicator
To use this indicator you must have access to a broker with options data (not available on Tradingview).
Usually, you can look at the stock's option chain to find the weekly expected move.
You will have to do your own research to find where this information is displayed depending on your broker. You may also need to find the information elsewhere if your broker does not have this information.
You can also do your calculation of the EM using the following formula (please do your own research):
Expected Move = Option Price x Implied Volatility x Square Root of Time
See screenshot example below
This is the Thinkorswim platform's option chain, and the Implied Volatility % and the calculated EM are on the right side of the option chain.
The Expected Move is circled in blue. Use the +- number in parentheses, NOT the % value.
For the weekly EM, input the number that corresponds to the weekly option into the indicator. This must be done on a weekly basis, and It is typically best to use the EM for the next week expiration that is generated AFTER the Friday close and/or before the Monday open of the upcoming week.
For the daily EM, input the number that corresponds to the daily 0DTE option into the indicator. This must be done on a daily basis, and it is typically best to use the EM value for the 0DTE option that is generated the night before (after market close), or before the market opens for that 0DTE. .

Pin Candle DetectionPin candles are a variation of hammer candles that are useful in technical analysis . In particular, when combined with volume profile studies, they can be a powerful set up for long entries or other decision making.
For example, when looking at volume profiles, a long entry would be a fair value area (i.e. 40%) below the close of a pin candle. When combined with a support level , the set up is stronger.
While most scripts look for hammer candles, pin candles are somewhat different in that the length of the wick is significant.
This script and its parameters was built for ES futures 15 min chart in mind.
This script is unique in that it allows for the below parameters to be adjusted to suit other instruments and timeframes:
1. Fib level: Candle must close within a certain retracement level). My preference is 0.55. Some traders like 0.5, while others prefer 0.33
2. Wick length: Pin candles differ from pure hammers in that the length of the wick must be significant. My preference is 7 points on ES (as in $ and not ticks)
Add this script to your alerts to no longer miss these set ups.

Failed Breakdown Detection'Failed Breakdowns' are a popular set up for long entries.
In short, the set up requires:
1) A significant low is made ('initial low')
2) Initial low is undercut with a new low
3) Price action then 'reclaims' the initial low by moving +8-10 points from the initial low
This script aims at detecting such set ups. It was coded with the ES Futures 15 minute chart in mind but may be useful on other instruments and time frames.
Business Logic:
1) Uses pivot lows to detect 'significant' initial lows
2) Uses amplitude threshold to detect a new low beneath the initial low; used /u/ben_zen script for this
3) Looks for a valid reclaim - a green candle that occurs within 10 bars of the new low
4) Price must reclaim at least 8 points for the set up to be valid
5) If a signal is detected, the initial low value (pivot low) is stored in array that prevents duplicate signals from being generated.
6) FBD Signal is plotted on the chart with "X"
7) Pivot low detection is plotted on the chart with "P" and a label
8) New lows are plotted on the chart with a blue triangle
Notes:
User input
- My preference is to use the defaults as is, but as always feel free to experiment
- Can modify pivot length but in my experience 10/10 work best for pivot lows
- New low detection - 55 bars and 0.05 amplitude work well based on visual checks of signals
- Can modify the number of points needed to reclaim a low, and the # of bars limit under which this must occur.
Alerts:
- Alerts are available for detection of new lows and detection of failed breakdowns
- Alerts are also available for these signals but only during 7:30PM-4PM EST - 'prime time' US trading hours
Limitations:
- Current version of the script only compares new lows to the most recent pivot low, does not look at anything prior to that
- Best used as a discretionary signal
Visit /u/ben_zen's Profile:
www.tradingview.com
Profile Link www.tradingview.com

Global Net Liquidity - SPX Fair ValueThis is similar to the SPX Fair Value Bands indicator.
It currently only displays the fair value.
The original SPX Fair Value formula only includes the Fed balance sheet data.
This indicator incorporates the following central bank assets:
Fed
Japan
China
UK
ECB
This is currently experimental. Feel free to explore using different formula constants.

Price Distance RatioThis study plots the ratio between current price and the price N days ago.
With N input that is configurable, users can find optimal long/short entries when price is in an established trend and price has diverge far from a given local peak or all time high.
With many years of stock trading the analysis indicates a connection between the distance of price and subsequent returns.
Portfolios of stocks with lower price to local highes ratios generally underperformed portfolios of stocks with higher prices to peaks reached similar N days ago.
The highest returns to previous peak are recorded when buying at the biggest dip.
For example, the purchase at 20% drawdown could generate 25% when price returns to the peak. The purchase at 50% drawdown could generate bigger, i.e. 100% return, when price returns to the peak. And the purchase at 90% drawdown could generate much bigger, i.e. 900% return, in a case the price returns to the peak.
However, buying very far below local peaks on almost all holding periods produces lower CAGR returns because of "timing adjustment". In simple words, typically the drawdown takes less time vs. further recovery.
For example:
👉 The largest BTC drawdown in 2013-2015 took 410 days (Peak-to-Valley) . And the recovery of BTC to new highs took 771 days (Valley-to-Peak) after that.
👉 The 3rd longest drawdown in BTC took 363 days (observed from December 17, 2017 to December 15, 2018). And further recovery in BTC to its new high took almost two years - 716 days .
👉The 4th longest drawdown in BTC took 162 days (observed from June 08, 2011 to November 17, 2011). And further recovery in BTC to its new high took more than a year - 469 days .
The concept of this study could recognizes at least 4 different modes of action.
👉 In a clearly established upward trend traders should be buying (following the trend) when Ratio is above 100% and reducing the size when Ratio turns below 100%.
👉 Conversely, in a clearly established downward trend traders should be shorted when Ratio is below 100% and covering when the Ratio turns back to 100%.
👉 In a sideways movement traders are advised to wait carefully if the Ratio near 100% for a long time, and take a position the trend is clear.
👉 Chartists can analyze the dynamic of the indicator - both in terms of trends and overall level. For example as it shown at the chart.
The understading of the study and rules of "timing adjustments" could genarate the awesome opportunities for stock options traders also, with strategies of selling uncovered call options and vertical call spreads.
// Many thanks to @HPotter and @Wheeelman wizards for their continious support and assistance.

SPX Expected MoveThis indicator plots the "expected move" of SPX for today's trading session. Expected move is the amount that SPX is predicted to increase or decrease from its current price, based on the current level of implied volatility. The implied volatility in this indicator is computed from the current value of the VIX (or one of several volatility symbols available on Trading view). The computation is done using standard formula. The resulting plots are labeled as 1 and 2 standard deviations. The default values are to use VIX as well as 252 trading days in the years.
Use the square root of (days to expiration, or in this case a fraction of the day remaining) divided but the square root of (252, or number of trading days in a year).
timeRemaining = math.sqrt(DTE) / math.sqrt(252)
Standard deviation move = SPX bar closing price * (VIX/100) * timeRemaining

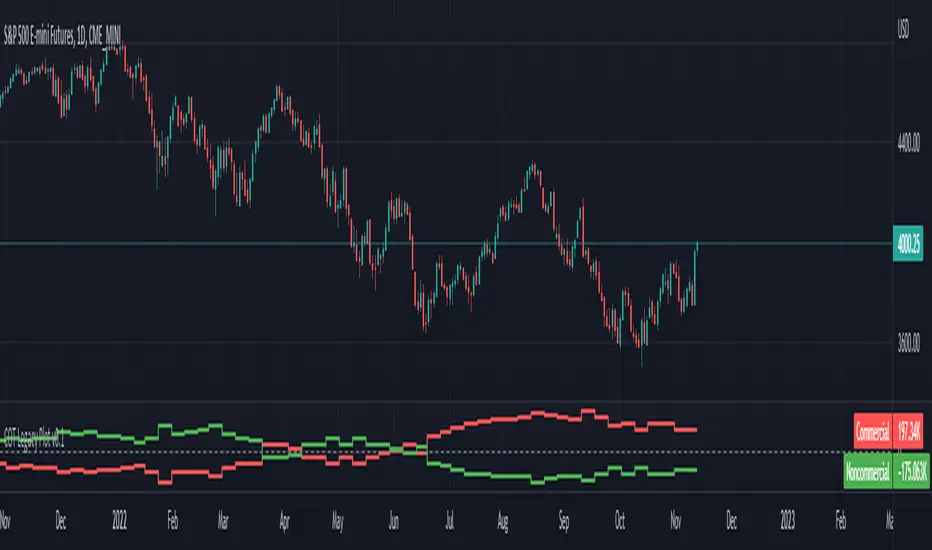
ILM CFTC COT Legacy PlotUse this indicator on Daily Timeframe
Please refer to the below link for CFTC Disaggregated COT
www.cftc.gov
This script is very similar to COT Financial Plot indicator except that it plots the data for Futures in Legacy buckets Commercial vs. Non-Commercial
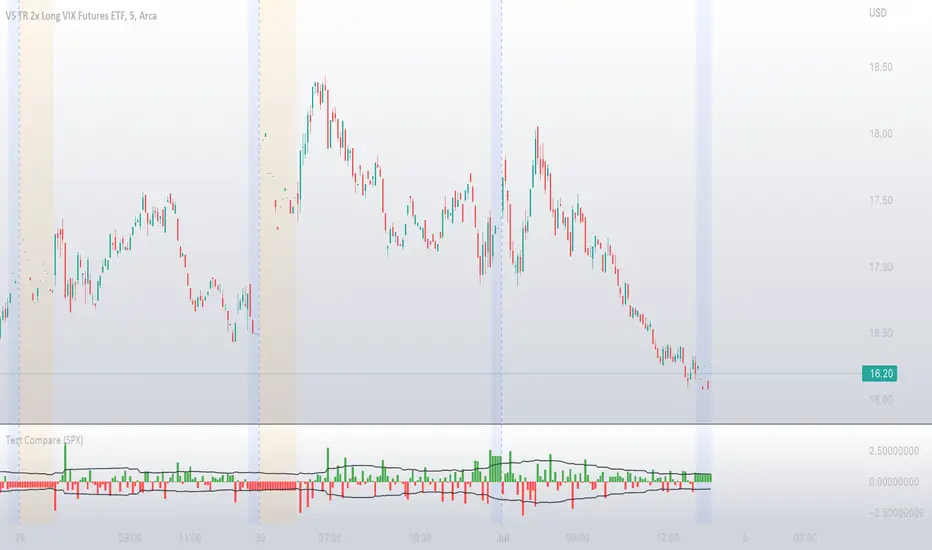
Volatility Inverse Correlation CandleThis is an educational tool that can help you find direct or inverse relations between two assets.
In this case I am using VIX and SPX .
The way it works is the next one :
So I am looking at the current open value of VIX in comparison with the previous close ( if it either above or below) and after on the SPX I am looking into the history and see for example which type of candle we had in respect with the opening value from VIX .
So for example, lets imagine that today is monday, and the weekly open value from VIX was higher than previous friday close value. Now I am going to see with the inverse correlation , if based on this idea, the current weekly candle from SPX finished in a bear candle.
The same can be applied for the bearish situation, so if we had an open from VIX lower than previous close, we are looking to check the SPX bull candle accuracy.
At the same time, for a different type of calculation I have added an internal lookup into heikin ashi values.
If you have any questions please let me know !

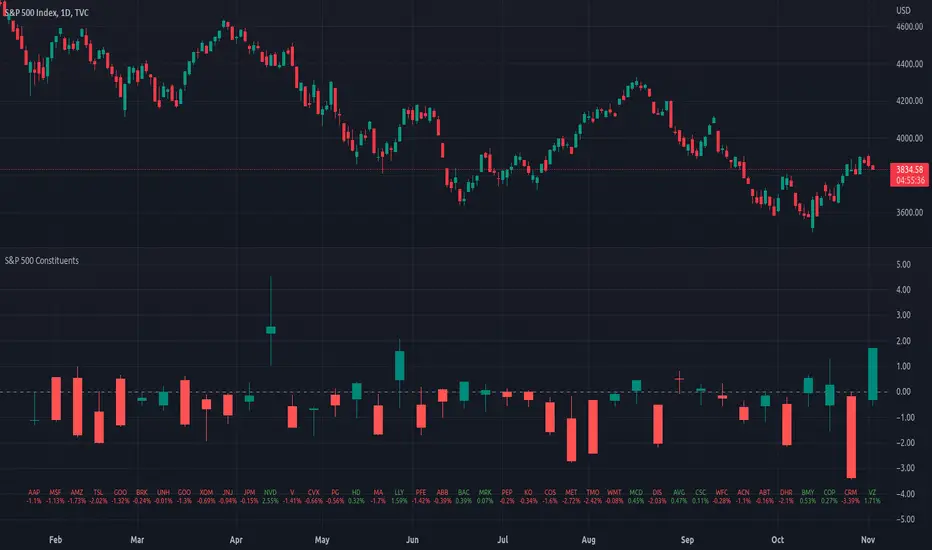
Top 40 constituents of S&P 500 IndexDisplays real-time candles of top 40 constituents of S&P 500 Index ( TVC:SPX ) for a given time frame, side-by-side. This gives an overall idea of breadth and depth of market movements in the time-frame.
Please note that, this is not a standard chart rendered bar-wise and may take time to load as it requests multiple securities. You could modify the contents, from settings, to include stocks from your portfolio or indices of different sectors.
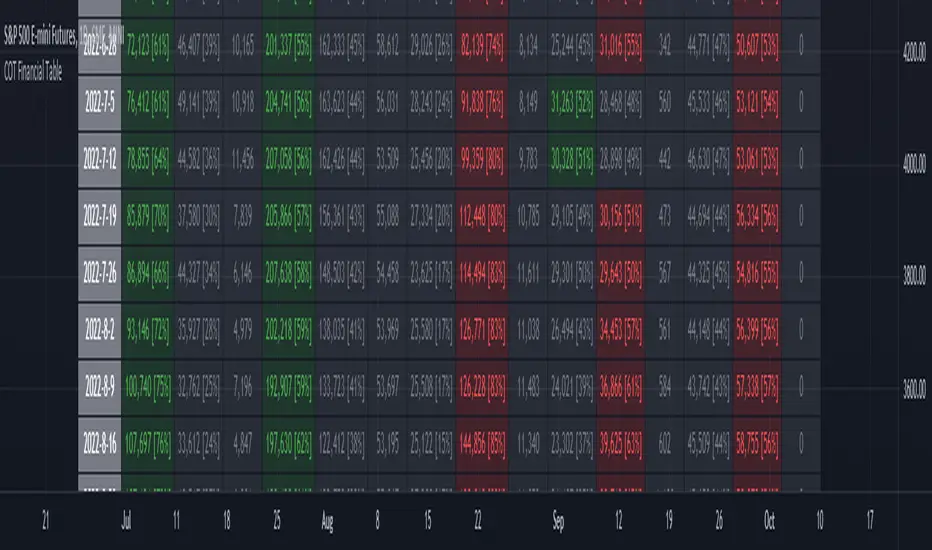
ILM COT Financial Table - CFTCUse this indicator on Daily Timeframe
Please refer to the below link for CFTC Financials
www.cftc.gov
This script shows the Financial COT for the respective instrument by deriving the CFTC code.
Option is provided to override the CFTC code
User can also configure the historical CFTC data view
The script calculates the Long% vs Short% for various categories (Dealers/Asset Managers/Leveraged Funds/Other Reportables) and color codes the column appropriately.
The goal of this script is to show all the financial CFTC data on a single page to digest the data better in a tabular form
Fixed the default TradingView Library which has some errors with CFTC code mapping.
For example, SPX CFTC Code #13874+ which is the most important one where big players take positions is not there in the default Library.
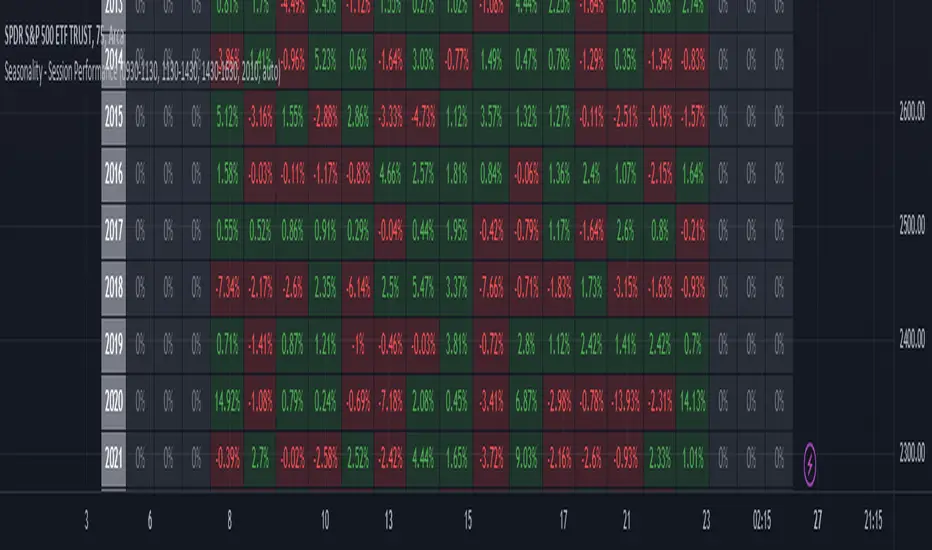
Seasonality - Session Performance - Morning Afternoon EveningUse this indicator on Intraday Timeframe. Higher the timeframe, more the data
This script calculates the performance of an instrument for different sessions.
Session inputs can be updated to study performance of
- Morning vs Afternoon vs Evening
- Pre-Market vs Market vs Post-Market (provided the data feed supports pre and post market)
- Overnight vs Intraday
Three session inputs are provided to tweak the session range
Performance is calculated as session close / session open - 1
Session timeframes can be set for various countries. Make sure the session timeframe aligns with the Candle open/close for the timeframe you choose. Some examples below
US Markets: 0930-1130 1130-1430 1430-1630 Timeframe 1 hour
India Markets: 0915-1030 1030-1415 1415-15:30 Timeframe 75min
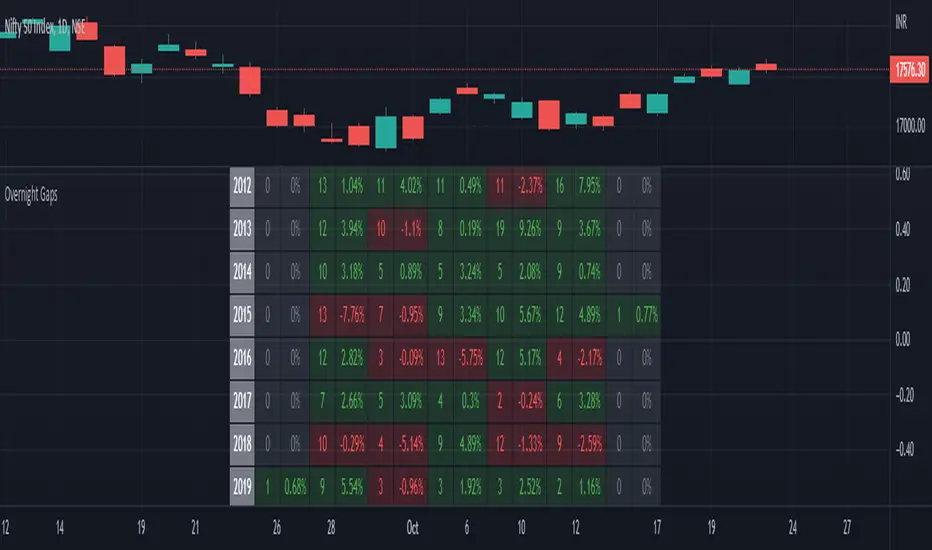
Seasonality Overnight Gaps - Tabular Form Use this indicator on Daily Timeframe
This script calculates the overnight gaps above a specific threshold (that can be set through input parameters) and displays the data in a tabular form with Year in the rows and the day of the week in the columns.
Also a summary row is displayed at the bottom for day of the week.
Detailed Gap info is displayed as tooltip for the cell data
Gap - Open should be outside the previous day's Open and Close
Gap % - open/prev. close - 1 if Gap is there
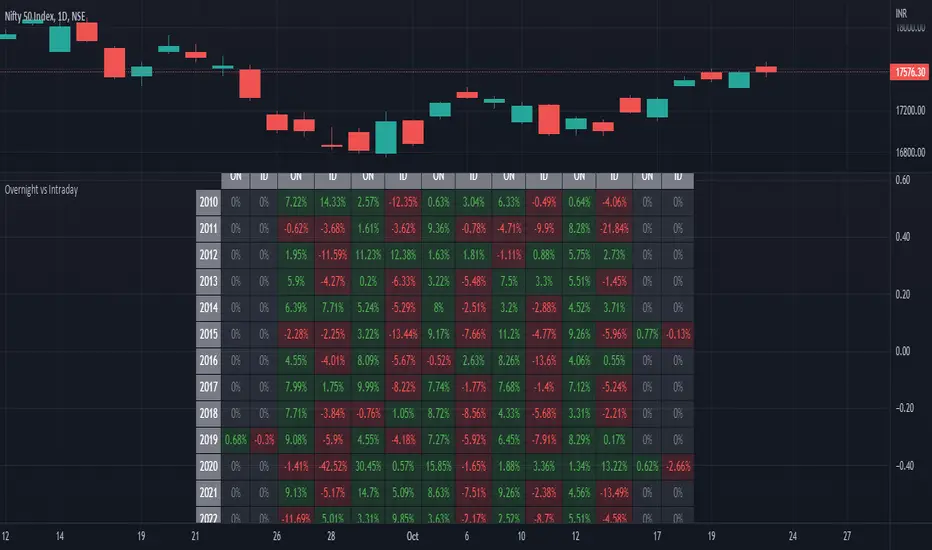
ILM Overnight vs Intraday Performance - Tabular FormUse this indicator on Daily Timeframe
This script compares Overnight vs Intraday Performance based on the Day of the Week (DOW) - Sun - Sat of index/stock/currency/commodity symbols.
ON column indicates Overnight performance = open/close -1
ID column indicates Intraday performance = close-open/1
The calculations are detailed in the tooltips of the individual table cells.
Seasonality DOW - Day Of the Week - Tabular FormUse this indicator on Daily Timeframe
This indicator displays the seasonality data for any instrument (index/stock/ futures /currency) in a tabular data by day of the week - DOW ( Sun - Mon - Tue - Wed - Thu - Fri - Sat ).
User can change the start of the year for analysis from the inputs.
Year is represented in rows and Day of the week (DOW) is represented in cols.
This indicator uses Daily Data feed to calculate the % change
Summary data for DOW displayed as the last row

Dealar VIX Implied Range + Retracement LevelsThis Implied range Is derived by the VIX(1 sd annual +/- Implied move.)
This Indicator plots the daily Implied range, A lot of quantitative trading firms/ MM firms hedge their delta & gamma exposure around the Implied range(prop calc). I have added retracement levels as well, so you have more pivot levels.
Enjoy!

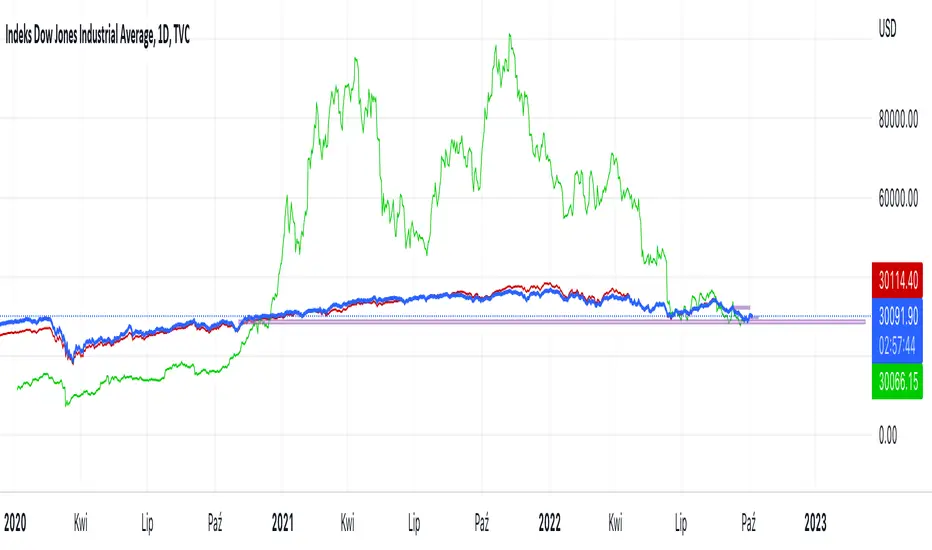
Hussarya compare DJI SPX BTCScript shows relations between DJI downJones SPX and BTC:USD.
DJI chart must be set from candlestick to line
Red line is price (close). x 8
Green line ist te price BTCUSD from Binance price (close) x 1.5
SPX Fair Value BandsThese are based on Darius Dale and Max Anderson's Net Liquidity model.
This is intended for use with the $SPX chart.
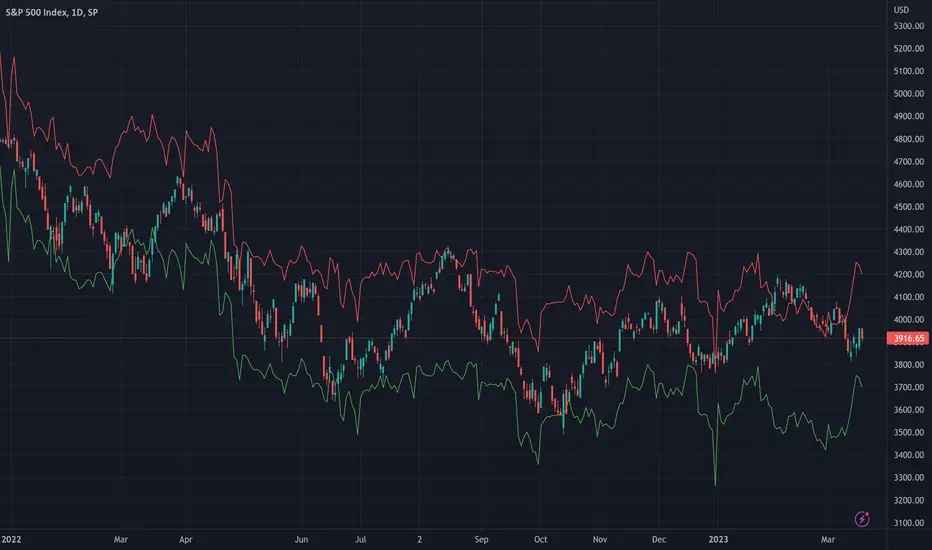
Compare ticker against SPX - yoyo This script is built on a request of one of the best trader yoyo. The script compares the performance of a tickers against SPX.
The script gives user option to override default SPX ticker to a ticker of their choice using settings.
The script does a % change comparison against base stock which is SPX by default for same timeframes and you can see relativity of stock to the other.
It also does plot a line that shows any divergence.
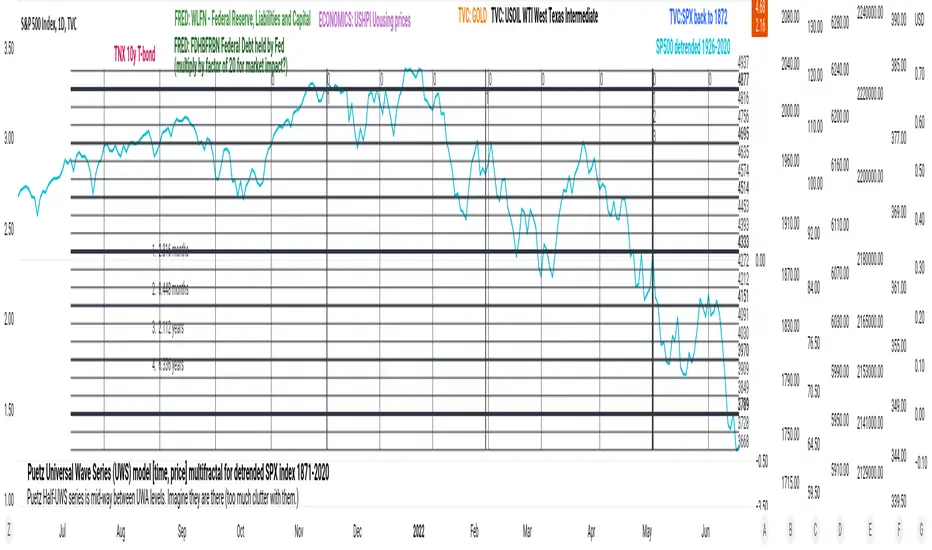
PuetzUWS [time, price] multiFractal mirrors, SPX 1872-2020This script is simply provided because a few rare people may actually be able to use one or two coding ideas. It is not possible to provide useful (description, explanation)s here. Maybe you can find those with a webSearch. If anybody is interested in the basic concept, just copy the code and run with it.
As the original was in violation of PineScript rules, I've removed many links, including :
- documentation of my code
- external sources of code
- blog solutions to Pine script programming
- math, science references, people
Hopefully it will won't be rejected this time, if so, too bad. I only made it through 10% of the conceptual objectives, and I do not believe any of the rest of the concepts are do-able in Pine Script. The current coding is (incomplete, unstable) but does give a faint idea of my "first step" intents. I have stopped all work, as I have to get back to my real projects (nothing to do with markets).
Volatility Calculator for Daily Top and Bottom RangeWith the usage of ATR, applied on the close of the daily candle, I am calculated the volatility channels for the TOP and BOTTOM
Based on this logic, we can estimate, with a huge confidence factor, where the prices are going to be compressed for the trading day.
Having said that, lets take a look at the data gathered among the most important financial markets:
SPX
TOP CROSSES : 2116
BOT CROSSES : 1954
Total Daily Candles : 18908
Occurance ratio = 0.215
NDX
TOP CROSSES : 1212
BOT CROSSES : 1183
Total Daily Candles : 9386
Occurance ratio = 0.255
DIA
TOP CROSSES : 759
BOT CROSSES : 769
Total Daily Candles : 6109
Occurance ratio = 0.25
DXY
TOP CROSSES : 1597
BOT CROSSES : 1598
Total Daily Candles : 13156
Occurance ratio = 0.243
DAX
TOP CROSSES : 1878
BOT CROSSES : 1848
Total Daily Candles : 13155
Occurance ratio = 0.283
BTC USD
TOP CROSSES : 416
BOT CROSSES : 417
Total Daily Candles : 4290
Occurance ratio = 0.194
ETH USD
TOP CROSSES : 247
BOT CROSSES : 268
Total Daily Candles : 2452
Occurance ratio = 0.21
EUR USD
TOP CROSSES : 820
BOT CROSSES : 805
Total Daily Candles : 7489
Occurance ratio = 0.217
GOLD
TOP CROSSES : 1722
BOT CROSSES : 1569
Total Daily Candles : 13747
Occurance ratio = 0.239
USOIL
TOP CROSSES : 1077
BOT CROSSES : 1089
Total Daily Candles : 10231
Occurance ratio = 0.212
US 10Y
TOP CROSSES : 1302
BOT CROSSES : 1365
Total Daily Candles : 9075
Occurance ratio = 0.294
Based on this, we can assume with a very high confidence ( 70-80%) that the market is going to stay, within the range created from the BOT and TOP ATR points.

PClose Levels 2.0This script plots the levels generated via a combination of SPX 2Y Quartiles for everyday, red days, and green days. It is intended for use solely with SPX.
These quartiles are also sorted by VIX averages into bands that expand and contract with VIX.
It gives us an idea of what levels to potentially expect resistance/support fairly well, but is designed to be used in conjunction with other indicators and macroeconomic information.
Green Dashed is your Expected Max Range (EMR+) based on Green Day averages.
Green Dotted is your Expected Range (ER+) based on full dataset averages.
Green solid lines are POS2 and POS1, based on Green Day averages.
White Dotted is your Expected Move (EM), based on full dataset averages.
Red solid lines are NEG1 and NEG2, based on Red Day averages.
Red Dotted is your Expected Range (ER-) based on full dataset averages.
Red Dashed is your Expected Max Range (EMR-) based on Red Day averages.
