Squeeze Momentum with DMI confirmation strategyThe script combines Squeeze Momentum and Directional Movement Index (DMI) confirmation. It provides long and short entry and closure daily trade signals, suitable for Spot, Marginal and Futures exchanges
The strategy components are customizable:
Change risk management settings (take profit, stop loss, trailing)
Change signals filters
Enable TrueRange or disable
Change lengths and periods of components
Advantages:
1. Deal start condition includes the following filters and requirements:
Momentum value is adjusted using a relative proportion of volume at each timeframe scale to exclude a chance of opening position at a low impulse stage
Squeeze momentum trigger condition is automatically checked before a position is opened
+DI , -DI and ADX values are taken into account to confirm the trend direction
2. Exit positions using unique risk management settings for each asset
3. Strategy allows to connect broker or automatic trading system using web hook alerts
If you want to obtain access to the strategy please send us a personal message
Squeezemomentum
MACD-X, More Than MACD by DGTMoving Average Convergence Divergence – MACD
The most popular indicator used in technical analysis, the moving average convergence divergence (MACD), created by Gerald Appel. MACD is a trend-following momentum indicator, designed to reveal changes in the strength, direction, momentum, and duration of a trend in a financial instrument’s price
Historical evolution of MACD,
- Gerald Appel created the MACD line,
- Thomas Aspray added the histogram feature to MACD
- Giorgos E. Siligardos created a leader of MACD
MACD employs two Moving Averages of varying lengths (which are lagging indicators) to identify trend direction and duration. Then, MACD takes the difference in values between those two Moving Averages (MACD Line) and an EMA of those Moving Averages (Signal Line) and plots that difference between the two lines as a histogram which oscillates above and below a center Zero Line. The histogram is used as a good indication of a security's momentum.
Mathematically expressed as;
macd = ma(source, fast_length) – ma(source, slow_length)
signal = ma(macd, signal_length)
histogram = macd – signal
where exponential moving average (ema) is in common use as a moving average (ma)
fast_length = 12
slow_length = 26
signal_length = 9
The MACD indicator is typically good for identifying three types of basic signals ;
Signal Line Crossovers
A Signal Line Crossover is the most common signal produced by the MACD. On the occasions where the MACD Line crosses above or below the Signal Line, that can signify a potentially strong move. The standard interpretation of such an event is a recommendation to buy if the MACD line crosses up through the Signal Line (a "bullish" crossover), or to sell if it crosses down through the Signal Line (a "bearish" crossover). These events are taken as indications that the trend in the financial instrument is about to accelerate in the direction of the crossover.
Zero Line Crossovers
Zero Line Crossovers occur when the MACD Line crossed the Zero Line and either becomes positive (above 0) or negative (below 0). A change from positive to negative MACD is interpreted as "bearish", and from negative to positive as "bullish". Zero crossovers provide evidence of a change in the direction of a trend but less confirmation of its momentum than a signal line crossover
Divergence
Divergence is another signal created by the MACD. Simply, divergence occurs when the MACD and actual price are not in agreement. A "positive divergence" or "bullish divergence" occurs when the price makes a new low but the MACD does not confirm with a new low of its own. A "negative divergence" or "bearish divergence" occurs when the price makes a new high but the MACD does not confirm with a new high of its own. A divergence with respect to price may occur on the MACD line and/or the MACD Histogram
Moving Average Crossovers , another hidden signal that MACD Indicator identifies
Many traders will watch for a short-term moving average to cross above a longer-term moving average and use this to signal increasing upward momentum. This bullish crossover suggests that the price has recently been rising at a faster rate than it has in the past, so it is a common technical buy sign. Conversely, a short-term moving average crossing below a longer-term average is used to illustrate that the asset's price has been moving downward at a faster rate and that it may be a good time to sell.
Moving Average Crossovers in reality is Zero Line Crossovers, the value of the MACD indicator is equal to zero each time the two moving averages cross over each other. For easy interpretation by trades, Zero Line Crossovers are simply described as positive or negative MACD
False signals
Like any forecasting algorithm, the MACD can generate false signals. A false positive, for example, would be a bullish crossover followed by a sudden decline in a financial instrument. A false negative would be a situation where there is bearish crossover, yet the financial instrument accelerated suddenly upwards
What is “MACD-X” and Why it is “More Than MACD”
In its simples form, MACD-X implements variety of different calculation techniques applied to obtain MACD Line, ability to use of variety of different sources , including Volume related sources, and can be plotted along with MACD in the same window and all those features are available and presented within a single indicator, MACD-X
Different calculation techniques lead to different values for MACD Line, as will further discuss below, and as a consequence the signal line and the histogram values will differentiate accordingly. Mathematical calculation of both signal line and the histogram remain the same.
Main features of MACD-X ;
1- Introduces different proven techniques applied on MACD calculation , such as MACD-Histogram, MACD-Leader and MACD-Source, besides the traditional MACD (MACD-TRADITIONAL)
• MACD-Traditional , by Gerald Appel
It is the MACD that we know, stated as traditional just to avoid confusion with other techniques used with this study
• MACD-Histogram , by Thomas Aspray
The MACD-Histogram measures the distance between MACD and its signal line (the 9-day EMA of MACD). Aspray developed the MACD-Histogram to anticipate signal line crossovers in MACD. Because MACD uses moving averages and moving averages lag price, signal line crossovers can come late and affect the reward-to-risk ratio of a trade. Bullish or bearish divergences in the MACD-Histogram can alert chartists to an imminent signal line crossover in MACD
The MACD-Histogram represents the difference between MACD and its 9-day EMA, the signal line. Mathematically,
macdx = macd - ma(macd, signal_length)
Aspray's contribution served as a way to anticipate (and therefore cut down on lag) possible MACD crossovers which are a fundamental part of the indicator.
Here come a question, what if repeat the same calculations once more (macdh2 = macdh - ma(macdh, signal_length), will it be even better, this question will remain to be tested
• MACD-Leader , by Giorgos E. Siligardos, PhD
MACD Leader has the ability to lead MACD at critical situations. Almost all smoothing methods encounter in technical analysis are based on a relative-weighted sum of past prices, and the Leader is no exception. The concealed weights of MACD Leader are such that more relative weight is used in the more recent prices than the respective weights used by the components of MACD. In effect, the Leader expresses more changes in average price dynamics for the recent price movement than MACD, thus eventually leading MACD, especially when significant trend changes are about to take place.
Siligardos creates two less-laggard moving averages indicators in its formula using the same periods as follows
Indicator1 = ma(source, fast_length) + ma(source - ma(source, fast_length), fast_length)
Indicator2 = ma(source, slow_length) + ma(source - ma(source, slow_length), slow_length)
and then take the difference:
Indicator1 - Indicator2
The result is a new MACD Leader indicator
macdx = macd + ma(source - fast_ma, fast_length) - ma(source - slow_ma, slow_length)
• MACD-Source , a custom experimental interpretation of mine ,
MACD Source, presents an application of MACD that evaluates Source/MA Ratio, relatively with less lag, as a basis for MACD Line, also can be expressed as source convergence/divergence to its moving average. Among the various techniques for removing the lag between price and moving average (MA) of the price, one in particular stands out: the addition to the moving average of a portion of the difference between the price and MA. MACD Source, is based on signal length mean of the difference between Source and average value of shot length and long length moving average of the source (Source/MA Ratio), where the source is actual value and hence no lag and relatively less lag with the average value of moving average of the source . Mathematically expressed as,
macdx = ma(source - avg( ma(source, fast_length), ma(source, slow_length) ), signal_length)
MACD Source provides relatively early crossovers comparing to MACD and better momentum direction indications, assuming the lengths are set to same values
For further details, you are invited to check the following two studies, where the first seeds were sown of the MACD-Source idea
Price Distance to its Moving Averages study, adapts the idea of “Prices high above the moving average (MA) or low below it are likely to be remedied in the future by a reverse price movement", presented in an article by Denis Alajbeg, Zoran Bubas and Dina Vasic published in International Journal of Economics, Commerce and Management
First MACD like interpretation comes with the second study named as “ P-MACD ”, where P stands for price, P-MACD study attempts to display relationship between Price and its 20 and 200-period moving average. Calculations with P-MACD were based on price distance (convergence/divergence) to its 200-period moving average, and moving average convergence/divergence of 20-period moving average to 200-period moving average of price.
Now as explained above, MACD Source is a one adapted with traditional MACD, where Source stands for Price, Volume Indicator etc, any source applicable with MACD concept
2- Allows usage of variety of different sources, including Volume related indicators
The most common usage of Source for MACD calculation is close value of the financial instruments price. As an experimental approach, this study will allow source to be selected as one of the following series;
• Current Close Price (close)
• Average of High, Low, and Close Price (hlc3)
• On Balance Volume (obv)
• Accumulation Distribution (accdist)
• Price Volume Trend (pvt)
Where,
-Current Close Price and Average of High, Low, and Close Price are price actions of the financial instrument
- Accumulation Distribution is a volume based indicator designed to measure underlying supply and demand
- On Balance Volume (OBV) , is a momentum indicator that measures positive and negative volume flow
- Price Volume Trend (PVT) is a momentum based indicator used to measure money flow
3- Can be plotted along with MACD in the same window using the same scaling
Default setting of MACD-X will display MACD-Source with Current Close Price as a source and traditional MACD can be plotted eighter as a companion of MACD-X or can be selected to be plotted alone.
Applying both will add ability to compare, or use as a confirmation of one other
In case, traditional MACD Is plotted along with MACD-X to avoid misinterpreting, the lines plotted, the area between MACD-X Line and Signal-X Line is highlighted automatically, even if the highlight option not selected. Otherwise highlight will be applied only if that option selected
4- 4C Histogram
Histogram is plotted with four colors to emphasize the momentum and direction
5- Customizable
Additional to ability of selecting Calculation Method, Source, plotting along with MACD, there are few other option that allows users to customize the MACD-X indicator
Lengths are configurable, default values are set as 12, 26, 9 respectively for fast, slow and smoothing length. Setting lengths to 8,21,5 respectively Is worth checking, slower length moving averages will lead to less lag and earlier reaction to price actions but yet requires a caution and back testing before applying
Highlight the area between MACD-X Line and Signal-X Line, with colors emphasising the direction
Label can be added to display Calculation Method, Source and Length settings, the aim of this label is to server only as a reminder to trades to be aware of settings while they are occupied with charts, analysis etc.
Here comes another question, which is of more importance having the reminder or having the indicators with multi timeframe feature? Build-in Multi Time Frame features of Pine is not supported when labels and lines introduced in the script, there are other methods but brings complexity. To be studied further, this version will be with labels for time being.
Epilogue
MACD-X is an alternative variant of MACD, the insight/signals provided by MACD are also applicable to MACD-X with early and clear warnings for the changes in the trend.
If MACD is essential to your analysis, then it is my guess that after using the MACD-X for a while and familiarizing yourself with its unique character and personality, you will make it an inseparable companion to other indicators in your charts.
The various signals generated by MACD/MACD-X are easily interpreted and very few indicators in technical analysis have proved to be more reliable than the MACD, and this relatively simple indicator can quickly be incorporated into any short-term trading strategy
Disclaimer : Trading success is all about following your trading strategy and the indicators should fit within your trading strategy, and not to be traded upon solely
The script is for informational and educational purposes only. Use of the script does not constitutes professional and/or financial advice. You alone the sole responsibility of evaluating the script output and risks associated with the use of the script. In exchange for using the script, you agree not to hold dgtrd TradingView user liable for any possible claim for damages arising from any decision you make based on use of the script

Squeeze Momentum Indicator [LazyBear] vX by DGTModified version of Squeeze Momentum Indicator visualizing on Price Chart
author: LazyBear, modified by KıvançÖZBİLGİÇ
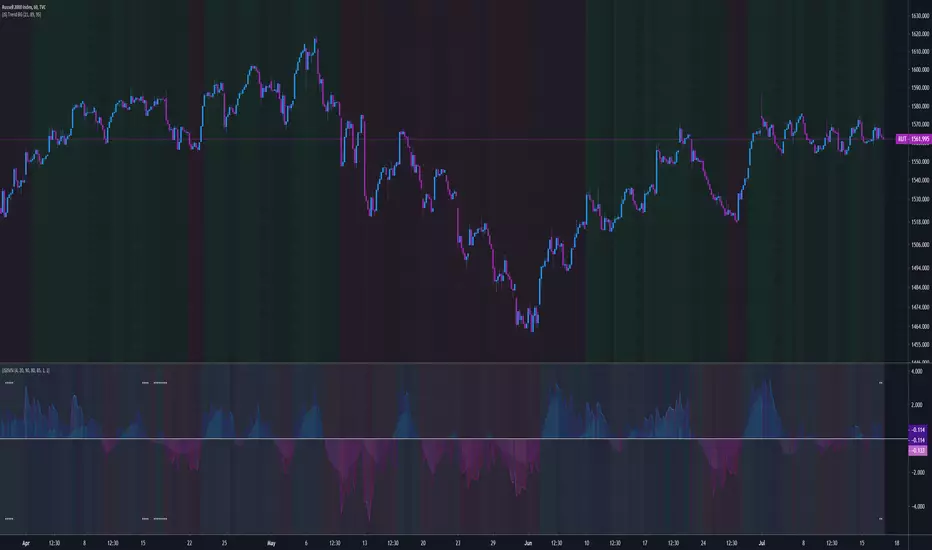
(NKC) MTF Squeeze Pro MultiTimeframe Squeeze Momentum Pro
Dots indicate squeeze
Fills indicate momentum

(JS) Squeeze Pro OverlaysSo this was something I planned on doing in the future, I knew it would take some time to put together but here it is, the Squeeze Pro 2 Overlays.
On my original Squeeze Pro, I had made several overlay indicators to go along with it, this time my goal was to combine all that stuff into a single indicator and allow the user to turn on and off the specific features they'd prefer to use. The version illustrated in the preview has everything turned on. What is "everything"? Here's the breakdown...
First of all - the color schemes in the Squeeze Pro match the color schemes in the Overlays indicator, so you can match them up (Color Scheme 3 in example). There are 6 schemes, option 1 is the original Squeeze colors.
There's also an option to make the light squeeze black, rather than white. This is for people who aren't using Dark Mode. It will flip all white to black, to make your charts better to read!
So there are 4 main overlays that can be switched on and off with this indicator, they include;
1. Early Signal Candles
2. BBMA Basis Line
3. Bollinger Bands/Keltner Channel Breaches
4. Signal Arrows
Early Signal Candles
The Early Signal Candles have two parameters, the entry smoothing period and the exit smoothing period.
There is a different type of early entry signal for each type of squeeze.
Low Squeeze generates white dots on the highs of the candles.
Mid Squeeze generates a lime green candle (or purple candle in color scheme 3).
High Squeeze generates a bigger purple circle on the high of the candle.
These three signals are made to mimic the original Early In/Out Candles from John Carter and represent the same thing (they work the same way).
As for the early exit, that would be determined by the color of the candle vs the color of the squeeze, works the same way as the original as well.
BBMA Basis Line
The BBMA (Bollinger Bands Momentum Average) was a moving average I had made to use with the squeeze on the previous version.
It is the basis line of the BB and KC used to make up the Squeeze (a 20 SMA). There are 4 different colors to it on this version.
1. Orange - This means no squeeze.
2. White/Black - Low Squeeze
3. Red - Mid Squeeze
4. Yellow - High Squeeze
You'll also notice these colors are light and dark in different spots - this is a representation of whether the Bollinger Bands are expanding or contracting. Dark means expanding, light means contracting.
Bollinger Bands/Keltner Channel Breaches
This is a pretty simple feature. If there is an ongoing squeeze, and a candle closes above or below the Bollinger Bands or Keltner Channels, a circle appears at the top or the bottom of the chart telling you which way the channel has been breached.
Signal Arrows
This is what makes up most of the overlay indicator. If you turn it on, the default is set to work just like the original. There are lots of options with this though.
First, you can turn each type of Squeeze Arrow on or off by checking/unchecking the boxes for them.
Now allow me to explain the "Signal Length", as there are several options.
The default is "6 Dots", this generates a signal when a particular type of Squeeze reaches the 6th dot ("12 Dots" works the same way).
"End of Squeeze" generates a signal once a type of Squeeze has concluded.
"End of Early Signal" generates a signal when the early dots (or candle) finishes.
"Custom" allows you to select your own dot duration to produce a signal, you select that number in the field below.
The other portion of this is the "Signal Type", this is where you select how each signal is generated once the selected amount of time takes place.
The default is the same as the original "+/-", this generates a signal based on whether Squeeze momentum is positive or negative.
"Rising/Falling" will only generate a signal if the Squeeze momentum maintains consistently over the last 6 bars.
"Crossed Zero" only generates a signal if the Squeeze momentum crosses above or below the zero line.
"Basis Line Momentum" is based on the BBMA. A signal is generated based on whether the current candle closes above or below the basis line.
"Divergence" only generates a signal if there is a divergence signal present at the time of the signal.
"Current Momentum" generates a signal based simply on the current direction of Squeeze momentum.
"Sum of Change" generates a signal based on the sum of the change in the Squeeze momentum being positive (long) or negative (short) over the length of time you select in the "Sum of Change Length" field.
Then "Combo" tries to take a look at everything and generates a score based on these parameters. Positive score = long, negative = short.
I hope I gave a detailed enough explanation on how everything works, let me know if you have any questions! Hope you like it!

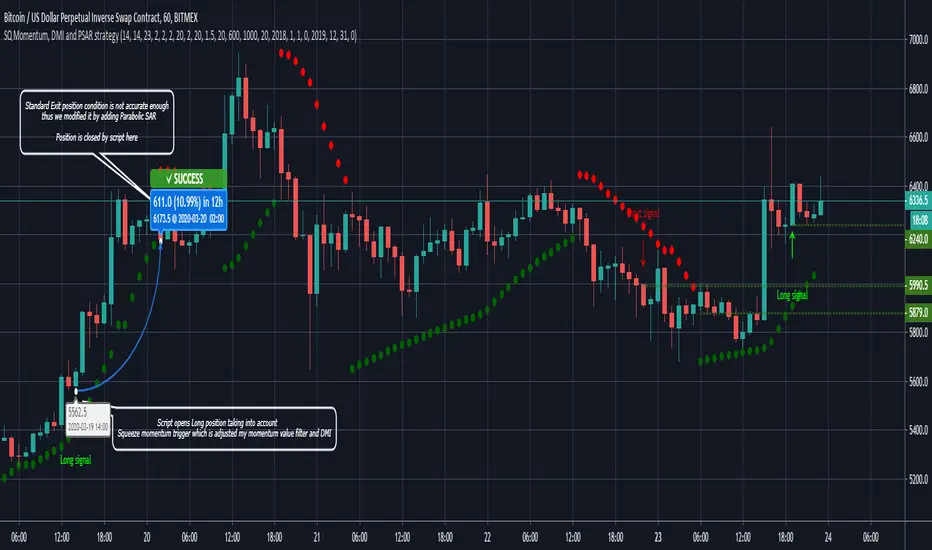
Sqeeze Momentum, DMI and Parabolic SAR study with alertsThe study combines Sqeeze Momentum, Directional Movement Index (DMI) and Parabolic SAR indicators indicators providing you with a powerful indicator with long and short scalping strategies in it
When conditions of long or short position from all mentioned indicators are met script opens position. Once trend changes it closes position and fixes profit
Advantages:
1. Deal start alert condition includes the folowing filters and requirements:
- Momentum value is adjusted using a relative proportion of volume at each timeframe scale to exclude a chance of opening position at a low impulse stage
- Squeeze momentum trigger condition is automatically checked before a position is opened
- +DI , -DI and ADX values are taken into account to confirm the trend direction
- Position size is taken into account to ensure there will not be opened any excess deals or alerts
2. Exit deal alert condition was modified using Parabolic SAR indicator. Hence, it is ensured positions will not be closed in a middle of a trend
3. Study allows you to apply custom alerts to any position you would like thus you can connect your own trading panels with TradingView Webhooks
If you want to obtain access to the strategy please send us a personal message

Sqeeze Momentum, DMI and Parabolic SAR strategyThe script combines Sqeeze Momentum, Directional Movement Index (DMI) and Parabolic SAR indicators in long and short scalping strategies
When conditions of long or short position from all mentioned indicators are met script opens position. Once trend changes it closes position and fixes profit
Advantages:
1. Deal start condition includes the folowing filters and requirements:
- Momentum value is adjusted using a relative proportion of volume at each timeframe scale to exclude a chance of opening position at a low impulse stage
- Squeeze momentum trigger condition is automatically checked before a position is opened
- +DI , -DI and ADX values are taken into account to confirm the trend direction
- Position size is taken into account to ensure there will not be opened any excess deals or alerts
2. Exit deal condition was modified using Parabolic SAR indicator. Hence, it is ensured positions will not be closed in a middle of a trend
3. Study is modified into strategy allowing you to use it directly through the trading panel
If you want to obtain access to the strategy please send us a personal message
(JS) Squeeze Pro 2This is my version of the updated classic indicator created by John Carter. I plan on adding a Squeeze Overlay script in the future that will pair with this one as well for additional signals.
So to break down the Squeeze, what it is, how it works, etc - you have to look at the components that make it up.
1. Bollinger Bands
2. Keltner Channels
3. Momentum
The momentum in this indicator is smoothed out using linear regression (shout out to Lazy Bear, it's a much simpler way to do it, imo).
The momentum is what is displayed on the indicator as a histogram, its purpose is obvious (to show momentum).
Now what is a Squeeze? A squeeze occurs when Bollinger Bands tighten up enough to slip inside of Keltner Channels.
This is interpreted as price is compressing and building up energy before releasing it and making a big move.
Traditionally, John Carter's version uses 20 period SMAs as the basis lines on both the BB and the KC.
In my version, I've given the freedom to change this and try out different types of moving averages.
His original squeeze indicator had one Squeeze setting, though this new one has three .
The white dot Squeeze , call it a "low squeeze", an "early squeeze", whatever you'd like - this is the easiest Squeeze to form based on its settings.
The red dot Squeeze is the original from the first Squeeze indicator.
And finally, the yellow dot squeeze , call it a "high squeeze", "power squeeze", once again whatever you want - is the most difficult to form and suggests price is under extreme levels of compression.
From what I've witnessed John Carter say in the past, the squeeze is meant to be used for continuation.
Now to explain the parameters:
Squeeze Input - This is just the source for the Squeeze to use, default value is closing price.
Length - This is the length of time used to calculate the Bollinger Bands and Keltner Channels.
Bollinger Bands Calculation Type - Selects the type of moving average used to create the Bollinger Bands.
Keltner Channel Calculation Type - Selects the type of moving average used to create the Keltner Channel.
Color Format - I have created 5 different color schemes, this allows you to choose one.
Draw Divergence - Self explanatory here, this will auto-draw divergence on the indicator.
Gray Background for Dark Mode - This is something I put on all my indicators to make them more visually appealing.
Moving on to the alerts, I have made some basic alerts to notify certain indicator conditions (I had to revise it back from the prior version, as V4 of PineScript limits outputs).
6th Dot Alerts - This will inform you when a certain Squeeze makes it 6 dots in. Why 6 dots? That is what John Carter said to be his preference.
12th Dot Alerts - Think of this as a "prolonged Squeeze" alert. I feel like if they do run this long you likely need to go up in resolution, but some traders prefer certain time increments so this is for them.
End of Squeeze Alerts - Self explanatory again - once a Squeeze has concluded this will provide you with a notification.
Start of Squeeze Alerts - Opposite of the alert above, notifications come when a Squeeze begins.
Zero Line Alerts - This will inform you of when the momentum makes a bullish or bearish move across the zero line.
I hope that I've done well enough explaining the indicator and how it works, for any further information on it I suggest you check out Simpler Trading and get linked up with John Carter over there.
He does lots of videos, webinars, and of course you can always get the official indicator and his signals there too.
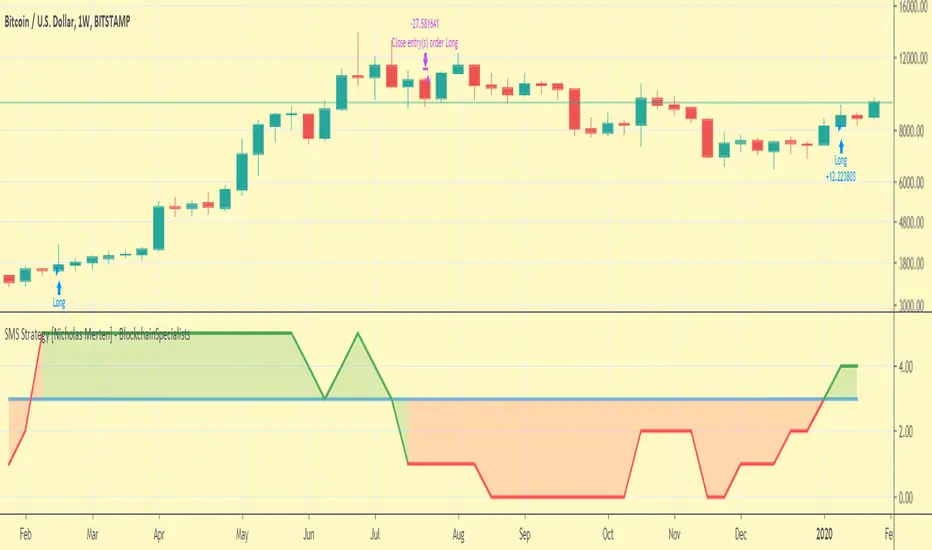
SMS Strategy [Nicholas Merten] - Blockchain SpecialistsHi, this is my interpretation of the indicator previous coded by u/SandRocks99 - His version can be found by searching:
"SMS Indicator"
*Please check out this indicator first*
My version of the SMS strategy functions as a TradingView Strategy to show where Long Positions (or Short Positions) could be entered. It also allows for every indicator variable to be altered and fine tuned to try and improve the strategy.
Also, as a bonus I've made an optional addition of a Percentage Trailing Stop.
To fix how it looks please go into Style Settings and un-check every box excluding 'Points Required' and 'Strategy Points'.
Any issues let me know.
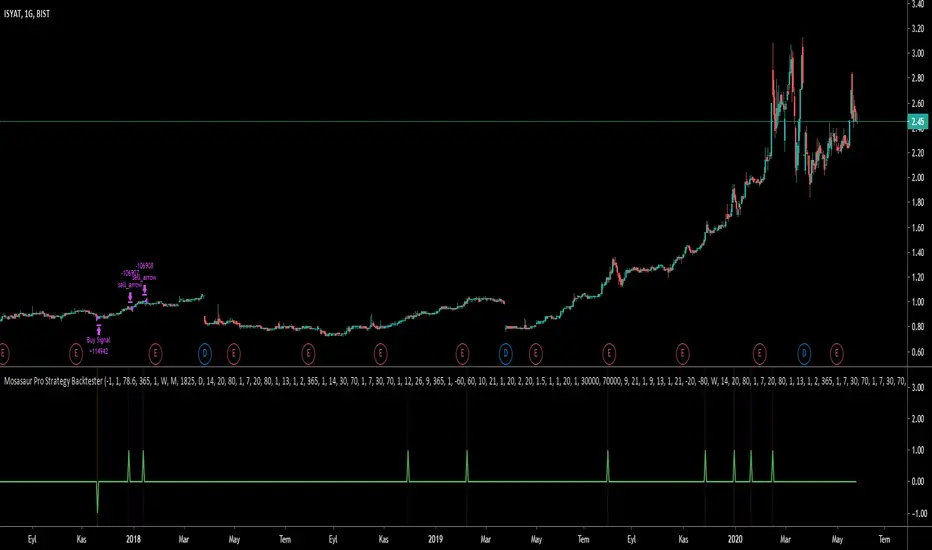
Mosasaur Pro BacktesterBacktester indicator for Mosasaur ◬ | Comprehensive & Profitable Trading Setup Builder available for free here.
Scroll all the way down in the setting menu to adjust the backtesting strategy.
Current features:
Find out the backtesting results for your customized strategy.
Set alerts for strong buy, buy, strong sell and sell signals.
Option for waiting fractal candle stick pattern before entering or exiting.
All features and setups used can be found on this tradingview page.
This backtester has settings of:
Setting 1 lets user select the source for putting a buy order.
Setting 2 lets user select the source for putting a sell order.
Setting 3 defines how much percent user wants to risk per trade to buy.
Setting 4 defines maximum possible trades for buying.
Setting 5 lets user only buy with fractal bottom after a buy signal has been found.
Setting 6 lets user only sell with fractal top after a sell signal has been found.
Setting 7 lets user only buy if the pre defined time period has elapsed on the chart.
Setting 8 lets user only sell if the pre defined time period has elapsed on the chart.
Setting 9 lets user only buy with a strong buy signal (orange color).
Setting 10 lets user only sell with a strong sell signal (purple color).
Setting 11 defines the time period to be elapsed to trigger a buy.
Setting 12 defines the time period to be elapsed to trigger a sell.
Upcoming features:
Advanced pre-defined strategies for user to select from. This will also auto adjust the setups and time frames being combined.
Stop Loss and Stop to Trailing options for the strategy.
Stop Loss and Stop to Trailing alerts.
Defining risk/reward ratio before entering the trade.
~Bo
Founder of Megalodon Indicators
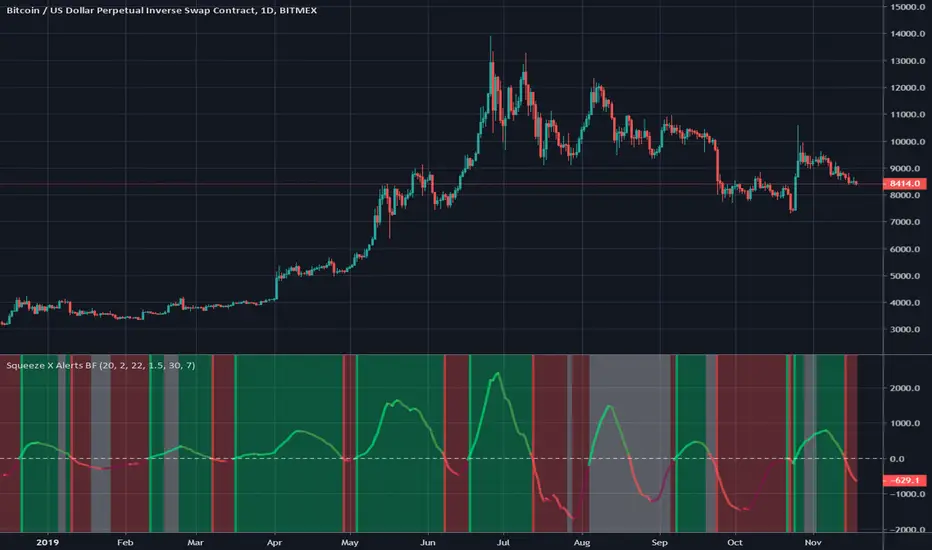
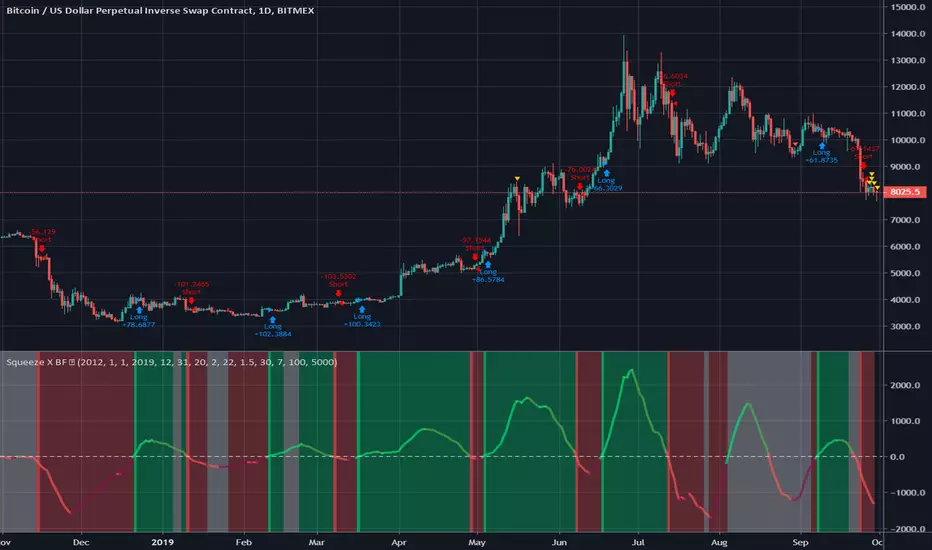
Squeeze X Alerts BFThis is an alerts script for my Squeeze X strategy .
The default settings are the same. The alerts are based on the long and short signals that occur upon a cross of the momentum line to the positive or negative respectively.
Green background is bullish, red is bearish. Bright green lines indicate a long signal, bright red a short signal.
White background means no trade since we are in a period of choppy/sideways price action.
It can be useful to use momentum as a divergence indicator against price as an aside.
Squeeze X BF 🚀Credit to LazyBear and Kiasaki for code used in this indicator.
Squeeze Momentum indicator illustrates when a momentum squeeze is happening by calculating when Bollinger Bands are within a Keltner Channel.
This simple strategy is based on when the momentum is crossing positive or negative.
INSTRUCTIONS
Green = Long
Red = Short
White = No Trade
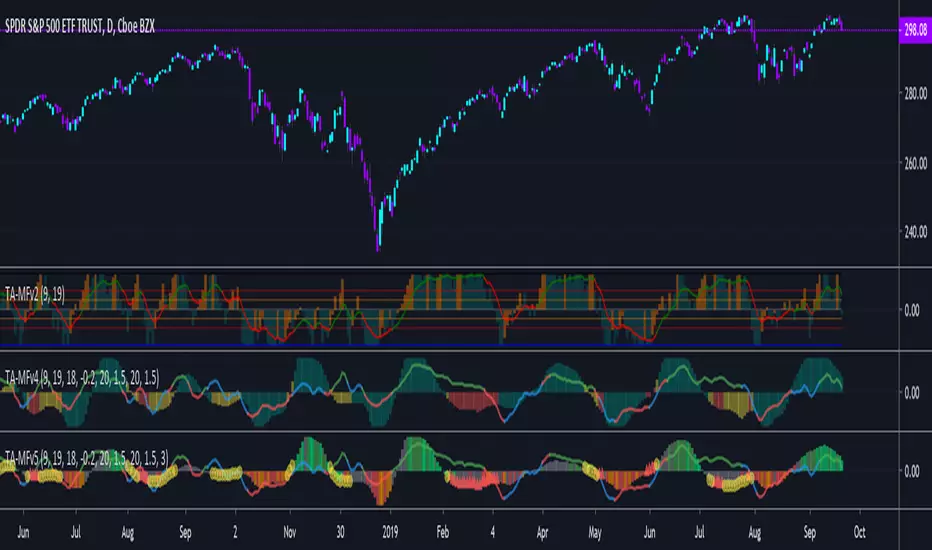
TA-Money Flow-Version5This is the MACD of a stochastic OBV movement indicator, Squeeze Momentum Indicator, and addition coloring for Market Direction Indicator . It is good (right) to work with both price and volume.
In this version we've moved the divergence highlighting to symbols at the ends of the histograms. Same coloring scheme as previous, yellow is divergence of either OBV or SQZ , red is both divergence. In the previous version we added in the "squeeze on - blue" highlighting to show follow through of divergence (or just squeeze/stall). We also added in another old script, but colors so well, Lazybears (Market Direction Indicator, linked below). Also incorporated a 3 color or 5 color scheme from the MDI script as a bool. It works great on any time frame, but you need to have volume data. Not sure where I originally got this (stoch-OBV, somewhere off Tradingview several years ago, thanks to the person who shared), Squeeze/MDI is Lazybear, links below.
Enjoy.
Version 5:
Moved divergence highlighting to symbols on histogram
Added coloring based on MDI
TA-Money-Flow-Version4
TA-Money-Flow-Version3
TA-Money-Flow-Version2
Squeeze-Momentum-Indicator-LazyBear
Market-Direction-Indicator-LazyBear
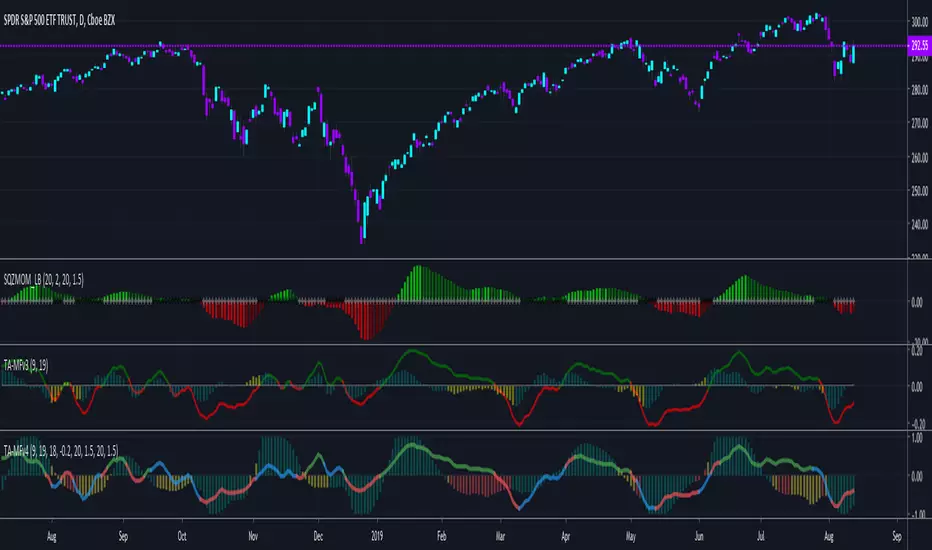
MACD SqueezeJust saw this on a particular website and created my version of it.
A practical modification of MACD and Squeeze Momentum. The MACD histogram is colored in green or red depending on whether the squeeze momentum is active or not.
Additionally, the MACD line is colored green if the RSI is oversold and red if it's in the overbought levels.

TA-Money Flow-Version4Updated for TV-Pine V4
This is the MACD of a stochastic OBV movement indicator and now the MACD of the Squeeze Momentum Indicator. It is good (right) to work with both price and volume...it is also good to utilize the most popular indicator ever in TV (Lazybear).
I've included highlighting based on price divergence, yellow is divergence of either OBV or SQZ, red is both divergence, and then I've also built in the "squeeze on - blue" highlighting to show follow through of divergence. It works great on any time frame, but you need to have volume data. Not sure where I originally got this (stoch-OBV, somewhere off Tradingview several years ago, thanks to the person who shared), Squeeze is Lazybear, links below.
Enjoy.
Version 4:
Updated OBV equation because TV-Pine V3 broke in V4
Included MACD of Squeeze for histogram
Included "squeeze on" highlighting
TA-Money-Flow-Version3
TA-Money-Flow-Version2
Squeeze-Momentum-Indicator-LazyBear
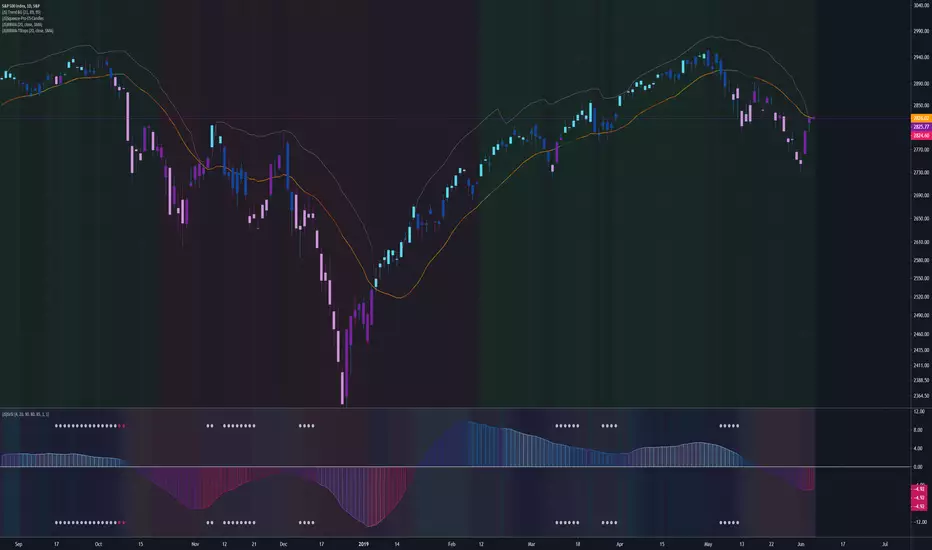
Squeeze - Expansion Indicator - JDThe Squeeze-Expansion Indicator or SE indicator shows the contraction and expansion of the volatility of the price,
it does this by evaluating the movement of the standard deviations of the price.
This indicator can be use in a similar way to ADX and momentum indicators and can potentially keep you out of NO-TRADE zones
It can also be used as an exit indicator to show when a move has likely lost momentum.
color coding of the SE indicator
-the BLUE area indicates the AMOUNT of SQUEEZE of the price deviations
-the ORANGE area indicates the AMOUNT of EXPANSION of the price deviations
-the highlighted (BLUE) line indicate SQUEEZE tightening
-the highlighted (GREEN and RED) lines indicate the RELEASE
- BLUE line rising indicates a likely bounce back if the price
- GREEN/RED line rising indicates a likely continuation/breakout of the price
JD.
#NotTradingAdvice
#DYOR
I build thes indicators for myself and provide them open source, to use for free to use and improve upon,
as I believe the best way to learn is toghether.

(JS) Bollinger Band Momentum Average Trailing StopsA tool I made to use alongside the Bollinger Band Momentum Average - fairly simple to use. It has the same settings as the BBMA so you can match them together.
If you prefer a wider stop than a close on the opposing side of the BBMA, this is for you.
The "stop" is triggered by a close on the other side of the stop line line turns red whenever the stop is triggered.
The calculation is simple:
The stop on the short side it is High - BBMA over the length of time you select to use (20 is default).
On the long side, it is BBMA - Low also over the preferred length of time you select to use.
Note: Just shorten the length to make a tighter stop.
(JS) Bollinger Bands Momentum AverageSo this is something I've been using with my Squeeze system that I have found very useful (great addition especially if you use the Squeeze Arrows).
First thing I'd like to point out is that the default setting (20 SMA) is also the default for the Bollinger Bands basis line, so I recommend using the line set at the default.
First thing you'll notice is that whichever side of the line the candles close on, that basically determines the direction of the arrow for the Squeeze Arrows.
So this is extremely helpful in case momentum shifts after an arrow signal is given, if you see the price shoot to the other side of the line you can use that as a means of protection.
Second, the line is color coded in a way that I hope helps with entries and exits.
The colors of the line change based on two things:
1. If there is currently a squeeze.
2. Are the Bollinger Bands expanding or contracting.
Generally speaking, when the bands are contracting (light green and light orange default colors) this is the ideal time for entry before a trending move occurs.
Same thing on the flip side when they're expanding (dark green and dark orange default colors), that's usually the better time to exit.
Now what's the difference between orange and green?
Green = There's an ongoing squeeze
Orange = There's currently no squeeze
So playing the side of momentum when the line is light green and starts to break in a certain direction would be the ideal entry.
And, if momentum changes from that point, you can always use a close on the opposite side of the line as a stop (or an entry the other way).
This is something else I've been using on my own for a little while prior to publishing and it has been a tremendous tool for me. Hope it helps you all as much as it has me!

(JS) Sustained Velocity Squeeze IndexSo I have revamped my original SVI indicator with the new Squeeze Pro system and have fused them together to form a single and extremely versatile indicator.
First, allow me to share the description on the original SVI, as all of this still applies:
" The Sustained Velocity Index is an original indicator I've created as a means to accurately measure parabolic moves to the up or down side.
Acceleration
I have added Acceleration to the equation which you can turn on and off.
This is meant to amplify the value when the move is sustained in a given direction.
What this does is amplify the reading based on consecutive green or red candles.
You can also change the Acceleration sensitivity with 5 being the strongest and 1 being the weakest.
Length
This is rather obvious - the look back period for the math formula.
However - I did include presets that I thought best suited Daily/Weekly/Monthly which you can toggle on and off
The rest of the options are purely cosmetic;
Backgroud Off - Turn the indicator background colors on and off.
Simple Background? - This toggles a simple two shade background on and off.
Background Transparency - Allows you to adjust the transparency of the background colors.
Plot Background Off? - Allows you to toggle the background inside the plot on and off.
Plot Line Color Off? - If you don't like the way the plot line changes colors, this turns it white.
Color Scheme - Four schemes to choose from, first three are color based, the last one is a plain version.
Plot Width - Adjusts the width of the plot line on the indicator.
Plot Line Value? - Toggles a line on the indicator at the current value on and off. "
Regarding the Squeeze Pro:
" The new Squeeze Pro has three different squeeze types rather than a single signal.
White = Warning/Low Squeeze
Red = Regular/Mid Squeeze
Yellow = Power/High Squeeze "
So what does this new indicator do? well - it does everything above, for one. Also, it allows you to use these indicators (Squeeze and SVI) separately in more ways than one, or if you choose so, individually. The default layout is the SVI overlayed on top of the Squeeze Momentum which can be seen in the background allowing you to be aware of both simultaneously, and done in a way that doesn't feel cluttered.
So here''s the new features:
Squeeze Momentum Off - This is rather obvious, when selected this will only show the SVI, no squeeze overlay.
Squeeze Momentum Only - Obvious again, when this is on SVI is removed and only the Squeeze momentum appears on the indicator.
Squeeze Momentum Plot Transparency - This toggles the opacity of the Squeeze momentum when it is overlayed with SVI, so you can bring it out/fade it back more depending on your preference.
Combined Indicator - This is the really cool feature. I combined the math formulas of both the Squeeze and SVI to create a single momentum indicator, the combo indicator tends to lag the other two a bit, but is better at assessing the longer term trend.
There are 5 different color schemes as well, with the fifth being a plain grayscale bg if you aren't into all the extra stuff.
Lots of moving parts to this script! I have been using this thing now for about a week or so prior to publishing and I love it so far, hope you all do too - enjoy!
(JS) Squeeze Pro ArrowsMore Squeeze Pro continuation, this is the signals on the chart. Initial signals appear as small label up and label down icons, while if the squeeze continues to a certain interval a bigger icon will appear later in the same squeeze duration - they are all color coded to match the squeeze signals from the Squeeze Pro indicator

(JS) Squeeze Pro Early Signal CandlesThe next piece of the Squeeze Pro System - early signal candles.. These are supposed to hint at squeeze momentum before it happens - another piece of the new Squeeze Pro trading system

(JS) Squeeze ProThe new Squeeze Pro has 3 different squeeze types rather than a single signal.
White = Warning/Low Squeeze
Red = Regular/Mid Squeeze
Yellow = Power/High Squeeze

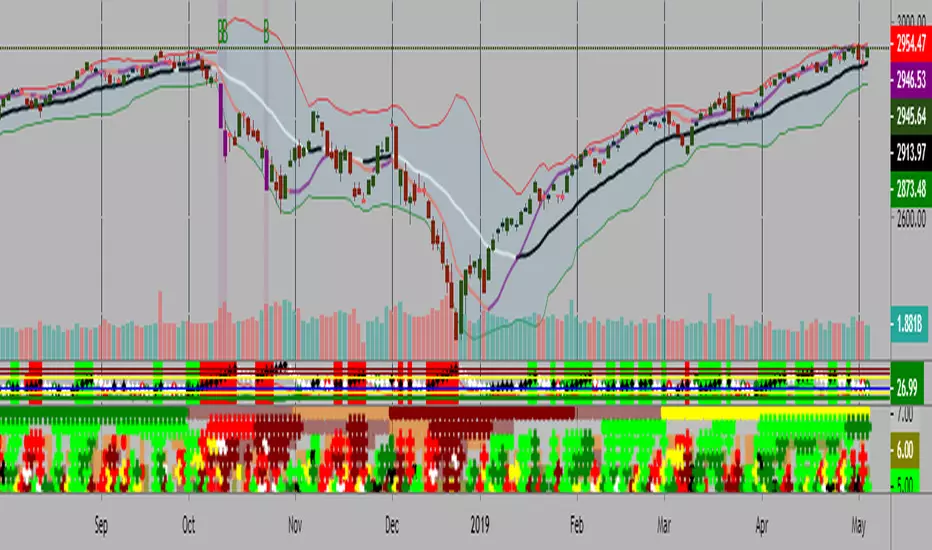
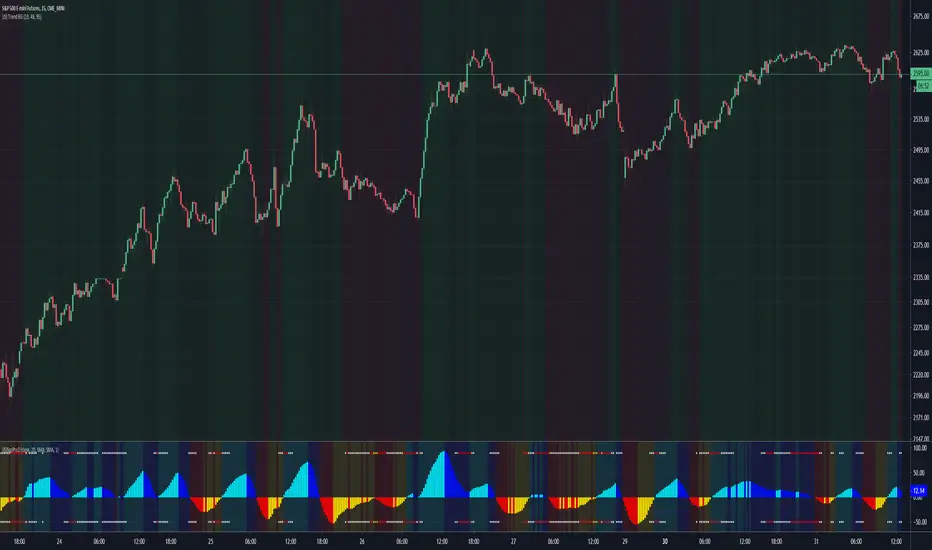
Kal’s MTF ADX Rangoli RollerKaly MTF ADX Rangoli Roller is a method/study for finding trending stocks, indexes and cryptocurrencies using two different data periods (10, 5) of ADX Overlap over different time-frames (10m, 1H, 4H, 1D, 1W, 1M). In the study, I used 5-Period ADX for all mentioned time-frames. You may use 10-Period ADX for lower time-frames especially 10m and 1H.
Sample Image of the pinescript code(at the end of this post) in Tradingview looks as follows:
Note: Kal's MTF ADX Rangoli Roller is the lower Plot. The upper plot is KAL’s ADX Overlap Technical Study with MACD Filter( )
Description:
----------------
In the study plot, the lowest row is 10m, row above is 1H, row above is 4H, then 1D, then 1W and highest row is 1M
Lime(Bright Green) dot implies Trending Uptrend for that time-frame (first phase)
Green dot implies Trending Uptrend for that time-frame (second phase near exhaustion)
Red dot implies Trending Downward for that time-frame (first phase)
Maroon dot implies Trending Downward for that time-frame (second phase near exhaustion)
Lime cross implies Strong Trending Uptrend for that time-frame (first phase)
Green cross implies Strong Trending Uptrend for that time-frame (second phase near exhaustion)
Red cross implies Trending Strong Downward for that time-frame (first phase)
Maroon cross implies Trending Strong Downward for that time-frame (second phase near exhaustion)
Yellow is ‘Squeeze On’ setting. During the squeeze period, the ADX signals are almost always ineffective. One may wait and watch over during this time. Once the Squeeze is released (i.e. no longer yellow), the trend corresponds to the color of the dots and crosses.
Black is CRSI Overbought condition for that time-frame. It’s best to wait and research for possibility of trend reversal because
1. Profit-booking/trimming happens after CRSI Overbought condition.
2. Large Short-sellers may take huge positions during this time pushing the stock prices up.
White is CRSI Oversold condition for that time-frame. It’s best to wait and research for possibility of trend reversal because
1. Profit-booking/trimming happens after CRSI Oversold conditions.
2. Large buyers may take huge positions during this time pushing the stock prices down.
I am a disabled man. Therefore, I am not able to write in detail here today. More Details will follow as time permits. Please let me know if I am missing anything…
Legal Disclaimer: I published here so I get replies from fellow viewers to educate myself and for my daily expenses. Hence, if anyone uses this script for making their decisions, I am not responsible for any failures incurred.
Safe Trading!
Kal Gandikota
PS: If you found this script interesting and edifying please follow and upvote.
PS2: Please kindly donate for my daily expenses (atleast as you would on streets) at the following addresses:
BTC Wallet: 1NeDC1GvpFa49DFLuT1v28ohFjqtoWXNQ5
ETH Wallet: 0x35e557F39A998e7d35dD27c6720C3553e1c65053
NEO Wallet: AUdiNJDW7boeUyYYNhX86p2T8eWwuELSGr
PS3: For more information on ADX and CRSI, please 'Google' or search here yourself.
PS4: This study is intended for research in creating automated Python Trading Systems using Pandas( steemit.com ).
Screenshots of the pinescript code looks as follows:
10minute Screenshot of Kal's MTF ADX Rangoli Roller (Above)
1 Hour Screenshot of Kal's MTF ADX Rangoli Roller (Above)
4 Hour Screenshot of Kal's MTF ADX Rangoli Roller (Above)
1 Day Screenshot of Kal's MTF ADX Rangoli Roller (Above)
1 Week Screenshot of Kal's MTF ADX Rangoli Roller (Above)
1 Month Screenshot of Kal's MTF ADX Rangoli Roller (Above)