Luxy Super-Duper SuperTrend Predictor Engine and Buy/Sell signalA professional trend-following grading system that analyzes historical trend
patterns to provide statistical duration estimates using advanced similarity
matching and k-nearest neighbors analysis. Combines adaptive Supertrend with
intelligent duration statistics, multi-timeframe confluence, volume confirmation,
and quality scoring to identify high-probability setups with data-driven
target ranges across all timeframes.
Note: All duration estimates are statistical calculations based on historical data, not guarantees of future performance.
WHAT MAKES THIS DIFFERENT
Unlike traditional SuperTrend indicators that only tell you trend direction, this system answers the critical question: "What is the typical duration for trends like this?"
The Statistical Analysis Engine:
• Analyzes your chart's last 15+ completed SuperTrend trends (bullish and bearish separately)
• Uses k-nearest neighbors similarity matching to find historically similar setups
• Calculates statistical duration estimates based on current market conditions
• Learns from estimation errors and adapts over time (Advanced mode)
• Displays visual duration analysis box showing median, average, and range estimates
• Tracks Statistical accuracy with backtest statistics
Complete Trading System:
• Statistical trend duration analysis with three intelligence levels
• Adaptive Supertrend with dynamic ATR-based bands
• Multi-timeframe confluence analysis (6 timeframes: 5M to 1W)
• Volume confirmation with spike detection and momentum tracking
• Quality scoring system (0-70 points) rating each setup
• One-click preset optimization for all trading styles
• Anti-repaint guarantee on all signals and duration estimates
METHODOLOGY CREDITS
This indicator's approach is inspired by proven trading methodologies from respected market educators:
• Mark Minervini - Volatility Contraction Pattern (VCP) and pullback entry techniques
• William O'Neil - Volume confirmation principles and institutional buying patterns (CANSLIM methodology)
• Dan Zanger - Volatility expansion entries and momentum breakout strategies
Important: These are educational references only. This indicator does not guarantee any specific trading results. Always conduct your own analysis and risk management.
KEY FEATURES
1. TREND DURATION ANALYSIS SYSTEM - The Core Innovation
The statistical analysis engine is what sets this indicator apart from standard SuperTrend systems. It doesn't just identify trend changes - it provides statistical analysis of potential duration.
How It Works:
Step 1: Historical Tracking
• Automatically records every completed SuperTrend trend (duration in bars)
• Maintains separate databases for bullish trends and bearish trends
• Stores up to 15 most recent trends of each type
• Captures market conditions at each trend flip: volume ratio, ATR ratio, quality score, price distance from SuperTrend, proximity to support/resistance
Step 2: Similarity Matching (k-Nearest Neighbors)
• When new trend begins, system compares current conditions to ALL historical flips
• Calculates similarity score based on:
- Volume similarity (30% weight) - Is volume behaving similarly?
- Volatility similarity (30% weight) - Is ATR/volatility similar?
- Quality similarity (20% weight) - Is setup strength comparable?
- Distance similarity (10% weight) - Is price distance from ST similar?
- Support/Resistance proximity (10% weight) - Similar structural context?
• Selects the 15 MOST SIMILAR historical trends (not just all trends)
• This is like asking: "When conditions looked like this before, how long did trends last?"
Step 3: Statistical Analysis
• Calculates median duration (most common outcome)
• Calculates average duration (mean of similar trends)
• Determines realistic range (min to max of similar trends)
• Applies exponential weighting (recent trends weighted more heavily)
• Outputs confidence-weighted statistical estimate
Step 4: Advanced Intelligence (Advanced Mode Only)
The Advanced mode applies five sophisticated multipliers to refine estimates:
A) Market Structure Multiplier (±30%):
• Detects nearby support/resistance levels using pivot detection
• If flip occurs NEAR a key level: Estimate adjusted -30% (expect bounce/rejection)
• If flip occurs in open space: Estimate adjusted +30% (clear path for continuation)
• Uses configurable lookback period and ATR-based proximity threshold
B) Asset Type Multiplier (±40%):
• Adjusts duration estimates based on asset volatility characteristics
• Small Cap / Biotech: +40% (explosive, extended moves)
• Tech Growth: +20% (momentum-driven, longer trends)
• Blue Chip / Large Cap: 0% (baseline, steady trends)
• Dividend / Value: -20% (slower, grinding trends)
• Cyclical: Variable based on macro regime
• Crypto / High Volatility: +30% (parabolic potential)
C) Flip Strength Multiplier (±20%):
• Analyzes the QUALITY of the trend flip itself
• Strong flip (high volume + expanding ATR + quality score 60+): +20%
• Weak flip (low volume + contracting ATR + quality score under 40): -20%
• Logic: Historical data shows that powerful flips tend to be followed by longer trends
D) Error Learning Multiplier (±15%):
• Tracks Statistical accuracy over last 10 completed trends
• Calculates error ratio: (estimated duration / Actual Duration)
• If system consistently over-estimates: Apply -15% correction
• If system consistently under-estimates: Apply +15% correction
• Learns and adapts to current market regime
E) Regime Detection Multiplier (±20%):
• Analyzes last 3 trends of SAME TYPE (bull-to-bull or bear-to-bear)
• Compares recent trend durations to historical average
• If recent trends 20%+ longer than average: +20% adjustment (trending regime detected)
• If recent trends 20%+ shorter than average: -20% adjustment (choppy regime detected)
• Detects whether market is in trending or mean-reversion mode
Three analysis modes:
SIMPLE MODE - Basic Statistics
• Uses raw median of similar trends only
• No multipliers, no adjustments
• Best for: Beginners, clean trending markets
• Fastest calculations, minimal complexity
STANDARD MODE - Full Statistical Analysis
• Similarity matching with k-nearest neighbors
• Exponential weighting of recent trends
• Median, average, and range calculations
• Best for: Most traders, general market conditions
• Balance of accuracy and simplicity
ADVANCED MODE - Statistics + Intelligence
• Everything in Standard mode PLUS
• All 5 advanced multipliers (structure, asset type, flip strength, learning, regime)
• Highest Statistical accuracy in testing
• Best for: Experienced traders, volatile/complex markets
• Maximum intelligence, most adaptive
Visual Duration Analysis Box:
When a new trend begins (SuperTrend flip), a box appears on your chart showing:
• Analysis Mode (Simple / Standard / Advanced)
• Number of historical trends analyzed
• Median expected duration (most likely outcome)
• Average expected duration (mean of similar trends)
• Range (minimum to maximum from similar trends)
• Advanced multipliers breakdown (Advanced mode only)
• Backtest accuracy statistics (if available)
The box extends from the flip bar to the estimated endpoint based on historical data, giving you a visual target for trend duration. Box updates in real-time as trend progresses.
Backtest & Accuracy Tracking:
• System backtests its own duration estimates using historical data
• Shows accuracy metrics: how well duration estimates matched actual durations
• Tracks last 10 completed duration estimates separately
• Displays statistics in dashboard and duration analysis boxes
• Helps you understand statistical reliability on your specific symbol/timeframe
Anti-Repaint Guarantee:
• duration analysis boxes only appear AFTER bar close (barstate.isconfirmed)
• Historical duration estimates never disappear or change
• What you see in history is exactly what you would have seen real-time
• No future data leakage, no lookahead bias
2. INTELLIGENT PRESET CONFIGURATIONS - One-Click Optimization
Unlike indicators that require tedious parameter tweaking, this system includes professionally optimized presets for every trading style. Select your approach from the dropdown and ALL parameters auto-configure.
"AUTO (DETECT FROM TF)" - RECOMMENDED
The smartest option: automatically selects optimal settings based on your chart timeframe.
• 1m-5m charts → Scalping preset (ATR: 7, Mult: 2.0)
• 15m-1h charts → Day Trading preset (ATR: 10, Mult: 2.5)
• 2h-4h-D charts → Swing Trading preset (ATR: 14, Mult: 3.0)
• W-M charts → Position Trading preset (ATR: 21, Mult: 4.0)
Benefits:
• Zero configuration - works immediately
• Always matched to your timeframe
• Switch timeframe = automatic adjustment
• Perfect for traders who use multiple timeframes
"SCALPING (1-5M)" - Ultra-Fast Signals
Optimized for: 1-5 minute charts, high-frequency trading, quick profits
Target holding period: Minutes to 1-2 hours maximum
Best markets: High-volume stocks, major crypto pairs, active futures
Parameter Configuration:
• Supertrend: ATR 7, Multiplier 2.0 (very sensitive)
• Volume: MA 10, High 1.8x, Spike 3.0x (catches quick surges)
• Volume Momentum: AUTO-DISABLED (too restrictive for fast scalping)
• Quality minimum: 40 points (accepts more setups)
• Duration Analysis: Uses last 15 trends with heavy recent weighting
Trading Logic:
Speed over precision. Short ATR period and low multiplier create highly responsive SuperTrend. Volume momentum filter disabled to avoid missing fast moves. Quality threshold relaxed to catch more opportunities in rapid market conditions.
Signals per session: 5-15 typically
Hold time: Minutes to couple hours
Best for: Active traders with fast execution
"DAY TRADING (15M-1H)" - Balanced Approach
Optimized for: 15-minute to 1-hour charts, intraday moves, session-based trading
Target holding period: 30 minutes to 8 hours (within trading day)
Best markets: Large-cap stocks, major indices, established crypto
Parameter Configuration:
• Supertrend: ATR 10, Multiplier 2.5 (balanced)
• Volume: MA 20, High 1.5x, Spike 2.5x (standard detection)
• Volume Momentum: 5/20 periods (confirms intraday strength)
• Quality minimum: 50 points (good setups preferred)
• Duration Analysis: Balanced weighting of recent vs historical
Trading Logic:
The most balanced configuration. ATR 10 with multiplier 2.5 provides steady trend following that avoids noise while catching meaningful moves. Volume momentum confirms institutional participation without being overly restrictive.
Signals per session: 2-5 typically
Hold time: 30 minutes to full day
Best for: Part-time and full-time active traders
"SWING TRADING (4H-D)" - Trend Stability
Optimized for: 4-hour to Daily charts, multi-day holds, trend continuation
Target holding period: 2-15 days typically
Best markets: Growth stocks, sector ETFs, trending crypto, commodity futures
Parameter Configuration:
• Supertrend: ATR 14, Multiplier 3.0 (stable)
• Volume: MA 30, High 1.3x, Spike 2.2x (accumulation focus)
• Volume Momentum: 10/30 periods (trend stability)
• Quality minimum: 60 points (high-quality setups only)
• Duration Analysis: Favors consistent historical patterns
Trading Logic:
Designed for substantial trend moves while filtering short-term noise. Higher ATR period and multiplier create stable SuperTrend that won't flip on minor corrections. Stricter quality requirements ensure only strongest setups generate signals.
Signals per week: 2-5 typically
Hold time: Days to couple weeks
Best for: Part-time traders, swing style
"POSITION TRADING (D-W)" - Long-Term Trends
Optimized for: Daily to Weekly charts, major trend changes, portfolio allocation
Target holding period: Weeks to months
Best markets: Blue-chip stocks, major indices, established cryptocurrencies
Parameter Configuration:
• Supertrend: ATR 21, Multiplier 4.0 (very stable)
• Volume: MA 50, High 1.2x, Spike 2.0x (long-term accumulation)
• Volume Momentum: 20/50 periods (major trend confirmation)
• Quality minimum: 70 points (excellent setups only)
• Duration Analysis: Heavy emphasis on multi-year historical data
Trading Logic:
Conservative approach focusing on major trend changes. Extended ATR period and high multiplier create SuperTrend that only flips on significant reversals. Very strict quality filters ensure signals represent genuine long-term opportunities.
Signals per month: 1-2 typically
Hold time: Weeks to months
Best for: Long-term investors, set-and-forget approach
"CUSTOM" - Advanced Configuration
Purpose: Complete manual control for experienced traders
Use when: You understand the parameters and want specific optimization
Best for: Testing new approaches, unusual market conditions, specific instruments
Full control over:
• All SuperTrend parameters
• Volume thresholds and momentum periods
• Quality scoring weights
• analysis mode and multipliers
• Advanced features tuning
Preset Comparison Quick Reference:
Chart Timeframe: Scalping (1M-5M) | Day Trading (15M-1H) | Swing (4H-D) | Position (D-W)
Signals Frequency: Very High | High | Medium | Low
Hold Duration: Minutes | Hours | Days | Weeks-Months
Quality Threshold: 40 pts | 50 pts | 60 pts | 70 pts
ATR Sensitivity: Highest | Medium | Lower | Lowest
Time Investment: Highest | High | Medium | Lowest
Experience Level: Expert | Advanced | Intermediate | Beginner+
3. QUALITY SCORING SYSTEM (0-70 Points)
Every signal is rated in real-time across three dimensions:
Volume Confirmation (0-30 points):
• Volume Spike (2.5x+ average): 30 points
• High Volume (1.5x+ average): 20 points
• Above Average (1.0x+ average): 10 points
• Below Average: 0 points
Volatility Assessment (0-30 points):
• Expanding ATR (1.2x+ average): 30 points
• Rising ATR (1.0-1.2x average): 15 points
• Contracting/Stable ATR: 0 points
Volume Momentum (0-10 points):
• Strong Momentum (1.2x+ ratio): 10 points
• Rising Momentum (1.0-1.2x ratio): 5 points
• Weak/Neutral Momentum: 0 points
Score Interpretation:
60-70 points - EXCELLENT:
• All factors aligned
• High conviction setup
• Maximum position size (within risk limits)
• Primary trading opportunities
45-59 points - STRONG:
• Multiple confirmations present
• Above-average setup quality
• Standard position size
• Good trading opportunities
30-44 points - GOOD:
• Basic confirmations met
• Acceptable setup quality
• Reduced position size
• Wait for additional confirmation or trade smaller
Below 30 points - WEAK:
• Minimal confirmations
• Low probability setup
• Consider passing
• Only for aggressive traders in strong trends
Only signals meeting your minimum quality threshold (configurable per preset) generate alerts and labels.
4. MULTI-TIMEFRAME CONFLUENCE ANALYSIS
The system can simultaneously analyze trend alignment across 6 timeframes (optional feature):
Timeframes analyzed:
• 5-minute (scalping context)
• 15-minute (intraday momentum)
• 1-hour (day trading bias)
• 4-hour (swing context)
• Daily (primary trend)
• Weekly (macro trend)
Confluence Interpretation:
• 5-6/6 aligned - Very strong multi-timeframe agreement (highest confidence)
• 3-4/6 aligned - Moderate agreement (standard setup)
• 1-2/6 aligned - Weak agreement (caution advised)
Dashboard shows real-time alignment count with color-coding. Higher confluence typically correlates with longer, stronger trends.
5. VOLUME MOMENTUM FILTER - Institutional Money Flow
Unlike traditional volume indicators that just measure size, Volume Momentum tracks the RATE OF CHANGE in volume:
How it works:
• Compares short-term volume average (fast period) to long-term average (slow period)
• Ratio above 1.0 = Volume accelerating (money flowing IN)
• Ratio above 1.2 = Strong acceleration (institutional participation likely)
• Ratio below 0.8 = Volume decelerating (money flowing OUT)
Why it matters:
• Confirms trend with actual money flow, not just price
• Leading indicator (volume often leads price)
• Catches accumulation/distribution before breakouts
• More intuitive than complex mathematical filters
Integration with signals:
• Optional filter - can be enabled/disabled per preset
• When enabled: Only signals with rising volume momentum fire
• AUTO-DISABLED in Scalping mode (too restrictive for fast trading)
• Configurable fast/slow periods per trading style
6. ADAPTIVE SUPERTREND MULTIPLIER
Traditional SuperTrend uses fixed ATR multiplier. This system dynamically adjusts the multiplier (0.8x to 1.2x base) based on:
• Trend Strength: Price correlation over lookback period
• Volume Weight: Current volume relative to average
Benefits:
• Tighter bands in calm markets (less premature exits)
• Wider bands in volatile conditions (avoids whipsaws)
• Better adaptation to biotech, small-cap, and crypto volatility
• Optional - can be disabled for classic constant multiplier
7. VISUAL GRADIENT RIBBON
26-layer exponential gradient fill between price and SuperTrend line provides instant visual trend strength assessment:
Color System:
• Green shades - Bullish trend + volume confirmation (strongest)
• Blue shades - Bullish trend, normal volume
• Orange shades - Bearish trend + volume confirmation
• Red shades - Bearish trend (weakest)
Opacity varies based on:
• Distance from SuperTrend (farther = more opaque)
• Volume intensity (higher volume = stronger color)
The ribbon provides at-a-glance trend strength without cluttering your chart. Can be toggled on/off.
8. INTELLIGENT ALERT SYSTEM
Two-tier alert architecture for flexibility:
Automatic Alerts:
• Fire automatically on BUY and SELL signals
• Include full context: quality score, volume state, volume momentum
• One alert per bar close (alert.freq_once_per_bar_close)
• Message format: "BUY: Supertrend bullish + Quality: 65/70 | Volume: HIGH | Vol Momentum: STRONG (1.35x)"
Customizable Alert Conditions:
• Appear in TradingView's "Create Alert" dialog
• Three options: BUY Signal Only, SELL Signal Only, ANY Signal (BUY or SELL)
• Use TradingView placeholders: {{ticker}}, {{interval}}, {{close}}, {{time}}
• Fully customizable message templates
All alerts use barstate.isconfirmed - Zero repaint guarantee.
9. ANTI-REPAINT ARCHITECTURE
Every component guaranteed non-repainting:
• Entry signals: Only appear after bar close
• duration analysis boxes: Created only on confirmed SuperTrend flips
• Informative labels: Wait for bar confirmation
• Alerts: Fire once per closed bar
• Multi-timeframe data: Uses lookahead=barmerge.lookahead_off
What you see in history is exactly what you would have seen in real-time. No disappearing signals, no changed duration estimates.
HOW TO USE THE INDICATOR
QUICK START - 3 Steps to Trading:
Step 1: Select Your Trading Style
Open indicator settings → "Quick Setup" section → Trading Style Preset dropdown
Options:
• Auto (Detect from TF) - RECOMMENDED: Automatically configures based on your chart timeframe
• Scalping (1-5m) - For 1-5 minute charts, ultra-fast signals
• Day Trading (15m-1h) - For 15m-1h charts, balanced approach
• Swing Trading (4h-D) - For 4h-Daily charts, trend stability
• Position Trading (D-W) - For Daily-Weekly charts, long-term trends
• Custom - Manual configuration (advanced users only)
Choose "Auto" and you're done - all parameters optimize automatically.
Step 2: Understand the Signals
BUY Signal (Green Triangle Below Price):
• SuperTrend flipped bullish
• Quality score meets minimum threshold (varies by preset)
• Volume confirmation present (if filter enabled)
• Volume momentum rising (if filter enabled)
• duration analysis box shows expected trend duration
SELL Signal (Red Triangle Above Price):
• SuperTrend flipped bearish
• Quality score meets minimum threshold
• Volume confirmation present (if filter enabled)
• Volume momentum rising (if filter enabled)
• duration analysis box shows expected trend duration
Duration Analysis Box:
• Appears at SuperTrend flip (start of new trend)
• Shows median, average, and range duration estimates
• Extends to estimated endpoint based on historical data visually
• Updates mode-specific intelligence (Simple/Standard/Advanced)
Step 3: Use the Dashboard for Context
Dashboard (top-right corner) shows real-time metrics:
• Row 1 - Quality Score: Current setup rating (0-70)
• Row 2 - SuperTrend: Direction and current level
• Row 3 - Volume: Status (Spike/High/Normal/Low) with color
• Row 4 - Volatility: State (Expanding/Rising/Stable/Contracting)
• Row 5 - Volume Momentum: Ratio and trend
• Row 6 - Duration Statistics: Accuracy metrics and track record
Every cell has detailed tooltip - hover for full explanations.
SIGNAL INTERPRETATION BY QUALITY SCORE:
Excellent Setup (60-70 points):
• Quality Score: 60-70
• Volume: Spike or High
• Volatility: Expanding
• Volume Momentum: Strong (1.2x+)
• MTF Confluence (if enabled): 5-6/6
• Action: Primary trade - maximum position size (within risk limits)
• Statistical reliability: Highest - duration estimates most accurate
Strong Setup (45-59 points):
• Quality Score: 45-59
• Volume: High or Above Average
• Volatility: Rising
• Volume Momentum: Rising (1.0-1.2x)
• MTF Confluence (if enabled): 3-4/6
• Action: Standard trade - normal position size
• Statistical reliability: Good - duration estimates reliable
Good Setup (30-44 points):
• Quality Score: 30-44
• Volume: Above Average
• Volatility: Stable or Rising
• Volume Momentum: Neutral to Rising
• MTF Confluence (if enabled): 3-4/6
• Action: Cautious trade - reduced position size, wait for additional confirmation
• Statistical reliability: Moderate - duration estimates less certain
Weak Setup (Below 30 points):
• Quality Score: Below 30
• Volume: Low or Normal
• Volatility: Contracting or Stable
• Volume Momentum: Weak
• MTF Confluence (if enabled): 1-2/6
• Action: Pass or wait for improvement
• Statistical reliability: Low - duration estimates unreliable
USING duration analysis boxES FOR TRADE MANAGEMENT:
Entry Timing:
• Enter on SuperTrend flip (signal bar close)
• duration analysis box appears simultaneously
• Note the median duration - this is your expected hold time
Profit Targets:
• Conservative: Use MEDIAN duration as profit target (50% probability)
• Moderate: Use AVERAGE duration (mean of similar trends)
• Aggressive: Aim for MAX duration from range (best historical outcome)
Position Management:
• Scale out at median duration (take partial profits)
• Trail stop as trend extends beyond median
• Full exit at average duration or SuperTrend flip (whichever comes first)
• Re-evaluate if trend exceeds estimated range
analysis mode Selection:
• Simple: Clean trending markets, beginners, minimal complexity
• Standard: Most markets, most traders (recommended default)
• Advanced: Volatile markets, complex instruments, experienced traders seeking highest accuracy
Asset Type Configuration (Advanced Mode):
If using Advanced analysis mode, configure Asset Type for optimal accuracy:
• Small Cap: Stocks under $2B market cap, low liquidity
• Biotech / Speculative: Clinical-stage pharma, penny stocks, high-risk
• Blue Chip / Large Cap: S&P 500, mega-cap tech, stable large companies
• Tech Growth: High-growth tech (TSLA, NVDA, growth SaaS)
• Dividend / Value: Dividend aristocrats, value stocks, utilities
• Cyclical: Energy, materials, industrials (macro-driven)
• Crypto / High Volatility: Bitcoin, altcoins, highly volatile assets
Correct asset type selection improves Statistical accuracy by 15-20%.
RISK MANAGEMENT GUIDELINES:
1. Stop Loss Placement:
Long positions:
• Place stop below recent swing low OR
• Place stop below SuperTrend level (whichever is tighter)
• Use 1-2 ATR distance as guideline
• Recommended: SuperTrend level (built-in volatility adjustment)
Short positions:
• Place stop above recent swing high OR
• Place stop above SuperTrend level (whichever is tighter)
• Use 1-2 ATR distance as guideline
• Recommended: SuperTrend level
2. Position Sizing by Quality Score:
• Excellent (60-70): Maximum position size (2% risk per trade)
• Strong (45-59): Standard position size (1.5% risk per trade)
• Good (30-44): Reduced position size (1% risk per trade)
• Weak (Below 30): Pass or micro position (0.5% risk - learning trades only)
3. Exit Strategy Options:
Option A - Statistical Duration-Based Exit:
• Exit at median estimated duration (conservative)
• Exit at average estimated duration (moderate)
• Trail stop beyond average duration (aggressive)
Option B - Signal-Based Exit:
• Exit on opposite signal (SELL after BUY, or vice versa)
• Exit on SuperTrend flip (trend reversal)
• Exit if quality score drops below 30 mid-trend
Option C - Hybrid (Recommended):
• Take 50% profit at median estimated duration
• Trail stop on remaining 50% using SuperTrend as trailing level
• Full exit on SuperTrend flip or quality collapse
4. Trade Filtering:
For higher win-rate (fewer trades, better quality):
• Increase minimum quality score (try 60 for swing, 50 for day trading)
• Enable volume momentum filter (ensure institutional participation)
• Require higher MTF confluence (5-6/6 alignment)
• Use Advanced analysis mode with appropriate asset type
For more opportunities (more trades, lower quality threshold):
• Decrease minimum quality score (40 for day trading, 35 for scalping)
• Disable volume momentum filter
• Lower MTF confluence requirement
• Use Simple or Standard analysis mode
SETTINGS OVERVIEW
Quick Setup Section:
• Trading Style Preset: Auto / Scalping / Day Trading / Swing / Position / Custom
Dashboard & Display:
• Show Dashboard (ON/OFF)
• Dashboard Position (9 options: Top/Middle/Bottom + Left/Center/Right)
• Text Size (Auto/Tiny/Small/Normal/Large/Huge)
• Show Ribbon Fill (ON/OFF)
• Show SuperTrend Line (ON/OFF)
• Bullish Color (default: Green)
• Bearish Color (default: Red)
• Show Entry Labels - BUY/SELL signals (ON/OFF)
• Show Info Labels - Volume events (ON/OFF)
• Label Size (Auto/Tiny/Small/Normal/Large/Huge)
Supertrend Configuration:
• ATR Length (default varies by preset: 7-21)
• ATR Multiplier Base (default varies by preset: 2.0-4.0)
• Use Adaptive Multiplier (ON/OFF) - Dynamic 0.8x-1.2x adjustment
• Smoothing Factor (0.0-0.5) - EMA smoothing applied to bands
• Neutral Bars After Flip (0-10) - Hide ST immediately after flip
Volume Momentum:
• Enable Volume Momentum Filter (ON/OFF)
• Fast Period (default varies by preset: 3-20)
• Slow Period (default varies by preset: 10-50)
Volume Analysis:
• Volume MA Length (default varies by preset: 10-50)
• High Volume Threshold (default: 1.5x)
• Spike Threshold (default: 2.5x)
• Low Volume Threshold (default: 0.7x)
Quality Filters:
• Minimum Quality Score (0-70, varies by preset)
• Require Volume Confirmation (ON/OFF)
Trend Duration Analysis:
• Show Duration Analysis (ON/OFF) - Display duration analysis boxes
• analysis mode - Simple / Standard / Advanced
• Asset Type - 7 options (Small Cap, Biotech, Blue Chip, Tech Growth, Dividend, Cyclical, Crypto)
• Use Exponential Weighting (ON/OFF) - Recent trends weighted more
• Decay Factor (0.5-0.99) - How much more recent trends matter
• Structure Lookback (3-30) - Pivot detection period for support/resistance
• Proximity Threshold (xATR) - How close to level qualifies as "near"
• Enable Error Learning (ON/OFF) - System learns from estimation errors
• Memory Depth (3-20) - How many past errors to remember
Box Visual Settings:
• duration analysis box Border Color
• duration analysis box Background Color
• duration analysis box Text Color
• duration analysis box Border Width
• duration analysis box Transparency
Multi-Timeframe (Optional Feature):
• Enable MTF Confluence (ON/OFF)
• Minimum Alignment Required (0-6)
• Individual timeframe enable/disable toggles
• Custom timeframe selection options
All preset configurations override manual inputs except when "Custom" is selected.
ADVANCED FEATURES
1. Scalpel Mode (Optional)
Advanced pullback entry system that waits for healthy retracements within established trends before signaling entry:
• Monitors price distance from SuperTrend levels
• Requires pullback to configurable range (default: 30-50%)
• Ensures trend remains intact before entry signal
• Reduces whipsaw and false breakouts
• Inspired by Mark Minervini's VCP pullback entries
Best for: Swing traders and day traders seeking precision entries
Scalpers: Consider disabling for faster entries
2. Error Learning System (Advanced analysis mode Only)
The system learns from its own estimation errors:
• Tracks last 10-20 completed duration estimates (configurable memory depth)
• Calculates error ratio for each: estimated duration / Actual Duration
• If system consistently over-estimates: Applies negative correction (-15%)
• If system consistently under-estimates: Applies positive correction (+15%)
• Adapts to current market regime automatically
This self-correction mechanism improves accuracy over time as the system gathers more data on your specific symbol and timeframe.
3. Regime Detection (Advanced analysis mode Only)
Automatically detects whether market is in trending or choppy regime:
• Compares last 3 trends to historical average
• Recent trends 20%+ longer → Trending regime (+20% to estimates)
• Recent trends 20%+ shorter → Choppy regime (-20% to estimates)
• Applied separately to bullish and bearish trends
Helps duration estimates adapt to changing market conditions without manual intervention.
4. Exponential Weighting
Option to weight recent trends more heavily than distant history:
• Default decay factor: 0.9
• Recent trends get higher weight in statistical calculations
• Older trends gradually decay in importance
• Rationale: Recent market behavior more relevant than old data
• Can be disabled for equal weighting
5. Backtest Statistics
System backtests its own duration estimates using historical data:
• Walks through past trends chronologically
• Calculates what duration estimate WOULD have been at each flip
• Compares to actual duration that occurred
• Displays accuracy metrics in duration analysis boxes and dashboard
• Helps assess statistical reliability on your specific chart
Note: Backtest uses only data available AT THE TIME of each historical flip (no lookahead bias).
TECHNICAL SPECIFICATIONS
• Pine Script Version: v6
• Indicator Type: Overlay (draws on price chart)
• Max Boxes: 500 (for duration analysis box storage)
• Max Bars Back: 5000 (for comprehensive historical analysis)
• Security Calls: 1 (for MTF if enabled - optimized)
• Repainting: NO - All signals and duration estimates confirmed on bar close
• Lookahead Bias: NO - All HTF data properly offset, all duration estimates use only historical data
• Real-time Updates: YES - Dashboard and quality scores update live
• Alert Capable: YES - Both automatic alerts and customizable alert conditions
• Multi-Symbol: Works on stocks, crypto, forex, futures, indices
Performance Optimization:
• Conditional calculations (duration analysis can be disabled to reduce load)
• Efficient array management (circular buffers for trend storage)
• Streamlined gradient rendering (26 layers, can be toggled off)
• Smart label cooldown system (prevents label spam)
• Optimized similarity matching (analyzes only relevant trends)
Data Requirements:
• Minimum 50-100 bars for initial duration analysis (builds historical database)
• Optimal: 500+ bars for robust statistical analysis
• Longer history = more accurate duration estimates
• Works on any timeframe from 1 minute to monthly
KNOWN LIMITATIONS
• Trending Markets Only: Performs best in clear trends. May generate false signals in choppy/sideways markets (use quality score filtering and regime detection to mitigate)
• Lagging Nature: Like all trend-following systems, signals occur AFTER trend establishment, not at exact tops/bottoms. Use duration analysis boxes to set realistic profit targets.
• Initial Learning Period: Duration analysis system requires 10-15 completed trends to build reliable historical database. Early duration estimates less accurate (first few weeks on new symbol/timeframe).
• Visual Load: 26-layer gradient ribbon may slow performance on older devices. Disable ribbon if experiencing lag.
• Statistical accuracy Variables: Duration estimates are statistical estimates, not guarantees. Accuracy varies by:
- Market regime (trending vs choppy)
- Asset volatility characteristics
- Quality of historical pattern matches
- Timeframe traded (higher TF = more reliable)
• Not Best Suitable For:
- Ultra-short-term scalping (sub-1-minute charts)
- Mean-reversion strategies (designed for trend-following)
- Range-bound trading (requires trending conditions)
- News-driven spikes (estimates based on technical patterns, not fundamentals)
FREQUENTLY ASKED QUESTIONS
Q: Does this indicator repaint?
A: Absolutely not. All signals, duration analysis boxes, labels, and alerts use barstate.isconfirmed checks. They only appear after the bar closes. What you see in history is exactly what you would have seen in real-time. Zero repaint guarantee.
Q: How accurate are the trend duration estimates?
A: Accuracy varies by mode, market conditions, and historical data quality:
• Simple mode: 60-70% accuracy (within ±20% of actual duration)
• Standard mode: 70-80% accuracy (within ±20% of actual duration)
• Advanced mode: 75-85% accuracy (within ±20% of actual duration)
Best accuracy achieved on:
• Higher timeframes (4H, Daily, Weekly)
• Trending markets (not choppy/sideways)
• Assets with consistent behavior (Blue Chip, Large Cap)
• After 20+ historical trends analyzed (builds robust database)
Remember: All duration estimates are statistical calculations based on historical patterns, not guarantees.
Q: Which analysis mode should I use?
A:
• Simple: Beginners, clean trending markets, want minimal complexity
• Standard: Most traders, general market conditions (RECOMMENDED DEFAULT)
• Advanced: Experienced traders, volatile/complex markets (biotech, small-cap, crypto), seeking maximum accuracy
Advanced mode requires correct Asset Type configuration for optimal results.
Q: What's the difference between the trading style presets?
A: Each preset optimizes ALL parameters for a specific trading approach:
• Scalping: Ultra-sensitive (ATR 7, Mult 2.0), more signals, shorter holds
• Day Trading: Balanced (ATR 10, Mult 2.5), moderate signals, intraday holds
• Swing Trading: Stable (ATR 14, Mult 3.0), fewer signals, multi-day holds
• Position Trading: Very stable (ATR 21, Mult 4.0), rare signals, week/month holds
Auto mode automatically selects based on your chart timeframe.
Q: Should I use Auto mode or manually select a preset?
A: Auto mode is recommended for most traders. It automatically matches settings to your timeframe and re-optimizes if you switch charts. Only use manual preset selection if:
• You want scalping settings on a 15m chart (overriding auto-detection)
• You want swing settings on a 1h chart (more conservative than auto would give)
• You're testing different approaches on same timeframe
Q: Can I use this for scalping and day trading?
A: Absolutely! The preset system is specifically designed for all trading styles:
• Select "Scalping (1-5m)" for 1-5 minute charts
• Select "Day Trading (15m-1h)" for 15m-1h charts
• Or use "Auto" mode and it configures automatically
Volume momentum filter is auto-disabled in Scalping mode for faster signals.
Q: What is Volume Momentum and why does it matter?
A: Volume Momentum compares short-term volume (fast MA) to long-term volume (slow MA). It answers: "Is money flowing into this asset faster now than historically?"
Why it matters:
• Volume often leads price (early warning system)
• Confirms institutional participation (smart money)
• No lag like price-based indicators
• More intuitive than complex mathematical filters
When the ratio is above 1.2, you have strong evidence that institutions are accumulating (bullish) or distributing (bearish).
Q: How do I set up alerts?
A: Two options:
Option 1 - Automatic Alerts:
1. Right-click on chart → Add Alert
2. Condition: Select this indicator
3. Choose "Any alert() function call"
4. Configure notification method (app, email, webhook)
5. You'll receive detailed alerts on every BUY and SELL signal
Option 2 - Customizable Alert Conditions:
1. Right-click on chart → Add Alert
2. Condition: Select this indicator
3. You'll see three options in dropdown:
- "BUY Signal" (long signals only)
- "SELL Signal" (short signals only)
- "ANY Signal" (both BUY and SELL)
4. Choose desired option and customize message template
5. Uses TradingView placeholders: {{ticker}}, {{close}}, {{time}}, etc.
All alerts fire only on confirmed bar close (no repaint).
Q: What is Scalpel Mode and should I use it?
A: Scalpel Mode waits for healthy pullbacks within established trends before signaling entry. It reduces whipsaws and improves entry timing.
Recommended ON for:
• Swing traders (want precision entries on pullbacks)
• Day traders (willing to wait for better prices)
• Risk-averse traders (prefer fewer but higher-quality entries)
Recommended OFF for:
• Scalpers (need immediate entries, can't wait for pullbacks)
• Momentum traders (want to enter on breakout, not pullback)
• Aggressive traders (prefer more opportunities over precision)
Q: Why do some duration estimates show wider ranges than others?
A: Range width reflects historical trend variability:
• Narrow range: Similar historical trends had consistent durations (high confidence)
• Wide range: Similar historical trends had varying durations (lower confidence)
Wide ranges often occur:
• Early in analysis (fewer historical trends to learn from)
• In volatile/choppy markets (inconsistent trend behavior)
• On lower timeframes (more noise, less consistency)
The median and average still provide useful targets even when range is wide.
Q: Can I customize the dashboard position and appearance?
A: Yes! Dashboard settings include:
• Position: 9 options (Top/Middle/Bottom + Left/Center/Right)
• Text Size: Auto, Tiny, Small, Normal, Large, Huge
• Show/Hide: Toggle entire dashboard on/off
Choose position that doesn't overlap important price action on your specific chart.
Q: Which timeframe should I trade on?
A: Depends on your trading style and time availability:
• 1-5 minute: Active scalping, requires constant monitoring
• 15m-1h: Day trading, check few times per session
• 4h-Daily: Swing trading, check once or twice daily
• Daily-Weekly: Position trading, check weekly
General principle: Higher timeframes produce:
• Fewer signals (less frequent)
• Higher quality setups (stronger confirmations)
• More reliable duration estimates (better statistical data)
• Less noise (clearer trends)
Start with Daily chart if new to trading. Move to lower timeframes as you gain experience.
Q: Does this work on all markets (stocks, crypto, forex)?
A: Yes, it works on all markets with trending characteristics:
Excellent for:
• Stocks (especially growth and momentum names)
• Crypto (BTC, ETH, major altcoins)
• Futures (indices, commodities)
• Forex majors (EUR/USD, GBP/USD, etc.)
Best results on:
• Trending markets (not range-bound)
• Liquid instruments (tight spreads, good fills)
• Volatile assets (clear trend development)
Less effective on:
• Range-bound/sideways markets
• Ultra-low volatility instruments
• Illiquid small-caps (use caution)
Configure Asset Type (in Advanced analysis mode) to match your instrument for best accuracy.
Q: How many signals should I expect per day/week?
A: Highly variable based on:
By Timeframe:
• 1-5 minute: 5-15 signals per session
• 15m-1h: 2-5 signals per day
• 4h-Daily: 2-5 signals per week
• Daily-Weekly: 1-2 signals per month
By Market Volatility:
• High volatility = more SuperTrend flips = more signals
• Low volatility = fewer flips = fewer signals
By Quality Filter:
• Higher threshold (60-70) = fewer but better signals
• Lower threshold (30-40) = more signals, lower quality
By Volume Momentum Filter:
• Enabled = Fewer signals (only volume-confirmed)
• Disabled = More signals (all SuperTrend flips)
Adjust quality threshold and filters to match your desired signal frequency.
Q: What's the difference between entry labels and info labels?
A:
Entry Labels (BUY/SELL):
• Your primary trading signals
• Based on SuperTrend flip + all confirmations (quality, volume, momentum)
• Include quality score and confirmation icons
• These are actionable entry points
Info Labels (Volume Spike):
• Additional market context
• Show volume events that may support or contradict trend
• 8-bar cooldown to prevent spam
• NOT necessarily entry points - contextual information only
Control separately: Can show entry labels without info labels (recommended for clean charts).
Q: Can I combine this with other indicators?
A: Absolutely! This works well with:
• RSI: For divergences and overbought/oversold conditions
• Support/Resistance: Confluence with key levels
• Fibonacci Retracements: Pullback targets in Scalpel Mode
• Price Action Patterns: Flags, pennants, cup-and-handle
• MACD: Additional momentum confirmation
• Bollinger Bands: Volatility context
This indicator provides trend direction and duration estimates - complement with other tools for entry refinement and additional confluence.
Q: Why did I get a low-quality signal? Can I filter them out?
A: Yes! Increase the Minimum Quality Score in settings.
If you're seeing signals with quality below your preference:
• Day Trading: Set minimum to 50
• Swing Trading: Set minimum to 60
• Position Trading: Set minimum to 70
Only signals meeting the threshold will appear. This reduces frequency but improves win-rate.
Q: How do I interpret the MTF Confluence count?
A: Shows how many of 6 timeframes agree with current trend:
• 6/6 aligned: Perfect agreement (extremely rare, highest confidence)
• 5/6 aligned: Very strong alignment (high confidence)
• 4/6 aligned: Good alignment (standard quality setup)
• 3/6 aligned: Moderate alignment (acceptable)
• 2/6 aligned: Weak alignment (caution)
• 1/6 aligned: Very weak (likely counter-trend)
Higher confluence typically correlates with longer, stronger trends. However, MTF analysis is optional - you can disable it and rely solely on quality scoring.
Q: Is this suitable for beginners?
A: Yes, but requires foundational knowledge:
You should understand:
• Basic trend-following concepts (higher highs, higher lows)
• Risk management principles (position sizing, stop losses)
• How to read candlestick charts
• What volume and volatility mean
Beginner-friendly features:
• Auto preset mode (zero configuration)
• Quality scoring (tells you signal strength)
• Dashboard tooltips (hover for explanations)
• duration analysis boxes (visual profit targets)
Recommended for beginners:
1. Start with "Auto" or "Swing Trading" preset on Daily chart
2. Use Standard Analysis Mode (not Advanced)
3. Set minimum quality to 60 (fewer but better signals)
4. Paper trade first for 2-4 weeks
5. Study methodology references (Minervini, O'Neil, Zanger)
Q: What is the Asset Type setting and why does it matter?
A: Asset Type (in Advanced analysis mode) adjusts duration estimates based on volatility characteristics:
• Small Cap: Explosive moves, extended trends (+30-40%)
• Biotech / Speculative: Parabolic potential, news-driven (+40%)
• Blue Chip / Large Cap: Baseline, steady trends (0% adjustment)
• Tech Growth: Momentum-driven, longer trends (+20%)
• Dividend / Value: Slower, grinding trends (-20%)
• Cyclical: Macro-driven, variable (±10%)
• Crypto / High Volatility: Parabolic potential (+30%)
Correct configuration improves Statistical accuracy by 15-20%. Using Blue Chip settings on a biotech stock may underestimate trend length (you'll exit too early).
Q: Can I backtest this indicator?
A: Yes! TradingView's Strategy Tester works with this indicator's signals.
To backtest:
1. Note the entry conditions (SuperTrend flip + quality threshold + filters)
2. Create a strategy script using same logic
3. Run Strategy Tester on historical data
Additionally, the indicator includes BUILT-IN duration estimate validation:
• System backtests its own duration estimates
• Shows accuracy metrics in dashboard and duration analysis boxes
• Helps assess reliability on your specific symbol/timeframe
Q: Why does Volume Momentum auto-disable in Scalping mode?
A: Scalping requires ultra-fast entries to catch quick moves. Volume Momentum filter adds friction by requiring volume confirmation before signaling, which can cause missed opportunities in rapid scalping.
Scalping preset is optimized for speed and frequency - the filter is counterproductive for that style. It remains enabled for Day Trading, Swing Trading, and Position Trading presets where patience improves results.
You can manually enable it in Custom mode if desired.
Q: How much historical data do I need for accurate duration estimates?
A:
Minimum: 50-100 bars (indicator will function but duration estimates less reliable)
Recommended: 500+ bars (robust statistical database)
Optimal: 1000+ bars (maximum Statistical accuracy)
More history = more completed trends = better pattern matching = more accurate duration estimates.
New symbols or newly-switched timeframes will have lower Statistical accuracy initially. Allow 2-4 weeks for the system to build historical database.
IMPORTANT DISCLAIMERS
No Guarantee of Profit:
This indicator is an educational tool and does not guarantee any specific trading results. All trading involves substantial risk of loss. Duration estimates are statistical calculations based on historical patterns and are not guarantees of future performance.
Past Performance:
Historical backtest results and Statistical accuracy statistics do not guarantee future performance. Market conditions change constantly. What worked historically may not work in current or future markets.
Not Financial Advice:
This indicator provides technical analysis signals and statistical duration estimates only. It is not financial, investment, or trading advice. Always consult with a qualified financial advisor before making investment decisions.
Risk Warning:
Trading stocks, options, futures, forex, and cryptocurrencies involves significant risk. You can lose all of your invested capital. Never trade with money you cannot afford to lose. Only risk capital you can lose without affecting your lifestyle.
Testing Required:
Always test this indicator on a demo account or with paper trading before risking real capital. Understand how it works in different market conditions. Verify Statistical accuracy on your specific instruments and timeframes before trusting it with real money.
User Responsibility:
You are solely responsible for your trading decisions. The developer assumes no liability for trading losses, incorrect duration estimates, software errors, or any other damages incurred while using this indicator.
Statistical Estimation Limitations:
Trend Duration estimates are statistical estimates based on historical pattern matching. They are NOT guarantees. Actual trend durations may differ significantly from duration estimates due to unforeseen news events, market regime changes, or lack of historical precedent for current conditions.
CREDITS & ACKNOWLEDGMENTS
Methodology Inspiration:
• Mark Minervini - Volatility Contraction Pattern (VCP) concepts and pullback entry techniques
• William O'Neil - Volume analysis principles and CANSLIM institutional buying patterns
• Dan Zanger - Momentum breakout strategies and volatility expansion entries
Technical Components:
• SuperTrend calculation - Classic ATR-based trend indicator (public domain)
• Statistical analysis - Standard median, average, range calculations
• k-Nearest Neighbors - Classic machine learning similarity matching concept
• Multi-timeframe analysis - Standard request.security implementation in Pine Script
For questions, feedback, or support, please comment below or send a private message.
Happy Trading!
Statisticalprobability

Z-Score Regime DetectorThe Z-Score Regime Detector is a statistical market regime indicator that helps identify bullish and bearish market conditions based on normalized momentum of three core metrics:
- Price (Close)
- Volume
- Market Capitalization (via CRYPTOCAP:TOTAL)
Each metric is standardized using the Z-score over a user-defined period, allowing comparison of relative extremes across time. This removes raw value biases and reveals underlying momentum structure.
📊 How it Works
- Z-Score: Measures how far a current value deviates from its average in terms of standard deviations.
- A Bullish Regime is identified when both price and market cap Z-scores are above the volume Z-score.
- A Bearish Regime occurs when price and market cap Z-scores fall below volume Z-score.
Bias Signal:
- Bullish Bias = Price Z-score > Market Cap Z-score
- Bearish Bias = Market Cap Z-score > Price Z-score
This provides a statistically consistent framework to assess whether the market is flowing with strength or stress.
✅ Why This Might Be Effective
- Normalizing the data via Z-scores allows comparison of diverse metrics on a common scale.
- Using market cap offers broader insight than price alone, especially for crypto.
- Volume as a reference threshold helps identify accumulation/distribution regimes.
- Simple regime logic makes it suitable for trend confirmation, filtering, or position biasing in systems.
⚠️ Disclaimer
This script is for educational purposes only and should not be considered financial advice. Always perform your own research and risk management. Past performance is not indicative of future results. Use at your own discretion.

Central Limit Theorem Reversion IndicatorDear TV community, let me introduce you to the first-ever Central Limit Theorem indicator on TradingView.
The Central Limit Theorem is used in statistics and it can be quite useful in quant trading and understanding market behaviors.
In short, the CLT states: "When you take repeated samples from any population and calculate their averages, those averages will form a normal (bell curve) distribution—no matter what the original data looks like."
In this CLT indicator, I use statistical theory to identify high-probability mean reversion opportunities in the markets. It calculates statistical confidence bands and z-scores to identify when price movements deviate significantly from their expected distribution, signaling potential reversion opportunities with quantifiable probability levels.
Mathematical Foundation
The Central Limit Theorem (CLT) says that when you average many data points together, those averages will form a predictable bell-curve pattern, even if the original data is completely random and unpredictable (which often is in the markets). This works no matter what you're measuring, and it gets more reliable as you use more data points.
Why using it for trading?
Individual price movements seem random and chaotic, but when we look at the average of many price movements, we can actually predict how they should behave statistically. This lets us spot when prices have moved "too far" from what's normal—and those extreme moves tend to snap back (mean reversion).
Key Formula:
Z = (X̄ - μ) / (σ / √n)
Where:
- X̄ = Sample mean (average return over n periods)
- μ = Population mean (long-term expected return)
- σ = Population standard deviation (volatility)
- n = Sample size
- σ/√n = Standard error of the mean
How I Apply CLT
Step 1: Calculate Returns
Measures how much price changed from one bar to the next (using logarithms for better statistical properties)
Step 2: Average Recent Returns
Takes the average of the last n returns (e.g., last 100 bars). This is your "sample mean."
Step 3: Find What's "Normal"
Looks at historical data to determine: a) What the typical average return should be (the long-term mean) and b) How volatile the market usually is (standard deviation)
Step 4: Calculate Standard Error
Determines how much sample averages naturally vary. Larger samples = smaller expected variation.
Step 5: Calculate Z-Score
Measures how unusual the current situation is.
Step 6: Draw Confidence Bands
Converts these statistical boundaries into actual price levels on your chart, showing where price is statistically expected to stay 95% and 99% of the time.
Interpretation & Usage
The Z-Score:
The z-score tells you how statistically unusual the current price deviation is:
|Z| < 1.0 → Normal behavior, no action
|Z| = 1.0 to 1.96 → Moderate deviation, watch closely
|Z| = 1.96 to 2.58 → Significant deviation (95%+), consider entry
|Z| > 2.58 → Extreme deviation (99%+), high probability setup
The Confidence Bands
- Upper Red Bands: 95% and 99% overbought zones → Expect mean reversion downward as the price is not likely to cross these lines.
- Center Gray Line: Statistical expectation (fair value)
- Lower Blue Bands: 95% and 99% oversold zones → Expect mean reversion upward
Trading Logic:
- When price exceeds the upper 95% band (z-score > +1.96), there's only a 5% probability this is random noise → Strong sell/short signal
- When price falls below the lower 95% band (z-score < -1.96), there's a 95% statistical expectation of upward reversion → Strong buy/long signal
Background Gradient
The background color provides real-time visual feedback:
- Blue shades: Oversold conditions, expect upward reversion
- Red shades: Overbought conditions, expect downward reversion
- Intensity: Darker colors indicate stronger statistical significance
Trading Strategy Examples
Hypothetically, this is how the indicator could be used:
- Long: Z-score < -1.96 (below 95% confidence band)
- Short: Z-score > +1.96 (above 95% confidence band)
- Take profit when price returns to center line (Z ≈ 0)
Input Parameters
Sample Size (n) - Default: 100
Lookback Period (m) - Default: 100
You can also create alerts based on the indicator.
Final notes:
- The indicator uses logarithmic returns for better statistical properties
- Converts statistical bands back to price space for practical use
- Adaptive volatility: Bands automatically widen in high volatility, narrow in low volatility
- No repainting: yay! All calculations use historical data only
Feedback is more than welcome!
Henri

GARCH Range PredictorThis was inspired by deltatrendtrading's video on GARCH models to predict daily trading ranges and identify favorable trading conditions. Based on advanced volatility forecasting techniques, it predicts whether a trading day's true range will exceed a threshold, helping traders decide when to trade or skip a session.
Key Features
GARCH(1,1) Volatility Modeling: Uses log-transformed true ranges with exponential moving average centering
Forward-Looking Predictions: Makes predictions at session start before the day unfolds
Dynamic or Static Thresholds: Choose between fixed dollar thresholds or adaptive 20-day averages
Accuracy Tracking: Monitors prediction accuracy with overall and recent (20-day) hit rates
Visual Session Boxes: Colors trading sessions green (trade) or red (skip) based on predictions
Real-Time Statistics: Displays current predictions, thresholds, and performance metrics
How It Works
Data Transformation: Log-transforms daily true ranges and centers them using an EMA
Variance Modeling: Updates GARCH variance using: σ²ₜ = ω + α(residual²) + β(σ²ₜ₋₁)
Prediction Generation: Back-transforms log predictions to dollar values
Signal Generation: Compares predictions to threshold to generate trade/skip signals
Performance Tracking: Validates predictions against actual outcomes
Parameters
GARCH Parameters (ω, α, β): Control volatility persistence and mean reversion
EMA Period: Smoothing period for log range centering
Threshold Settings: Static dollar amount or dynamic multiplier of recent averages
Session Time: Define regular trading hours for analysis
Best Use Cases
Breakout and momentum strategies that perform better on high-range days
Risk management by avoiding low-volatility sessions
Futures day trading (optimized for MNQ/NQ detection)
Any strategy where daily range impacts profitability
Important Notes
Requires 5+ sessions for initialization and warm-up
Accuracy depends heavily on proper parameter tuning for your specific instrument
Default parameters may need adjustment for different markets
Monitor the hit rate to validate effectiveness on your timeframe

Markov 3D Trend AnalyzerMarkov 3D Trend Analyzer
🔹 What Is a Markov State?
A Markov chain models systems as states with probabilities of transitioning from one state to another. The key property is memorylessness: the next state depends only on the current state, not the full past history. In financial markets, this allows us to study how conditions tend to persist or flip — for example, whether a green candle is more likely to be followed by another green or by a red.
🔹 How This Indicator Uses It
The Markov 3D Trend Analyzer tracks three independent Markov chains:
Direction Chain (short-term): Probability that a green/red candle continues or reverses.
Volatility Chain (mid-term): Probability of volatility staying Low/Medium/High or transitioning between them.
Momentum Chain (structural): Probability of momentum (Bullish, Neutral, Bearish) persisting or flipping.
Each chain is updated dynamically using exponentially weighted probabilities (EMA), which balance the law of large numbers (stability) with adaptivity to new market conditions.
The indicator then classifies each chain’s dominant state and combines them into an actionable summary at the bottom of the table (e.g. “📈 Bullish breakout,” “⚠️ Choppy bearish fakeouts,” “⏳ Trend squeeze / possible reversal”).
🔹 Settings
Direction Lookback / Volatility Lookback / Momentum Lookback
Control the rolling window length (sample size) for each chain. Larger = smoother but slower to adapt.
EMA Weight
Adjusts how much weight is given to recent transitions vs. older history. Lower values adapt faster, higher values stabilize.
Table Position
Choose where the table is displayed on your chart.
Table Size
Adjust the font size for readability.
🔹 How To Consider Using
Contextual tool: Use the summary row to understand the current market condition (trending, mean-reverting, expanding, compressing, continuation, fakeout risk).
Complementary filter: Combine with your existing strategies to confirm or filter signals. For example:
📈 If your breakout strategy fires and the summary says Bullish breakout, that’s confirmation.
⚠️ If it says Choppy fakeouts, be cautious of traps.
Visualization aid: The table lets you see how probabilities shift across direction, volatility, and momentum simultaneously.
⚠️ This indicator is not a signal generator. It is designed to help interpret market states probabilistically. Always use in conjunction with broader analysis and risk management.
🔹 Disclaimer
This script is for educational and informational purposes only. It does not constitute financial advice or a recommendation to buy or sell any security, cryptocurrency, or instrument. Trading involves risk, and past probabilities or behaviors do not guarantee future outcomes. Always conduct your own research and use proper risk management.

HTF Current/Average RangeThe "HTF(Higher Timeframe) Current/Average Range" indicator calculates and displays the current and average price ranges across multiple timeframes, including daily, weekly, monthly, 4 hour, and user-defined custom timeframes.
Users can customize the lookback period, table size, timeframe, and font color; with the indicator efficiently updating on the final bar to optimize performance.
When the current range surpasses the average range for a given timeframe, the corresponding table cell is highlighted in green, indicating potential maximum price expansion and signaling the possibility of an impending retracement or consolidation.
For day trading strategies, the daily average range can serve as a guide, allowing traders to hold positions until the current daily range approaches or meets the average range, at which point exiting the trade may be considered.
For scalping strategies, the 15min and 5min average range can be utilized to determine optimal holding periods for fast trades.
Other strategies:
Intraday Trading - 1h and 4h Average Range
Swing Trading - Monthly Average Range
Short-term Trading - Weekly Average Range
Also using these statistics in accordance with Power 3 ICT concepts, will assist in holding trades to their statistical average range of the chosen HTF candle.
CODE
The core functionality lies in the data retrieval and table population sections.
The request.security function (e.g., = request.security(syminfo.tickerid, "D", , lookahead = barmerge.lookahead_off)) retrieves high and low prices from specified timeframes without lookahead bias, ensuring accurate historical data.
These values are used to compute current ranges and average ranges (ta.sma(high - low, avgLength)), which are then displayed in a dynamically generated table starting at (if barstate.islast) using table.new, with conditional green highlighting when the current range is greater than average range, providing a clear visual cue for volatility analysis.

Bitcoin Monthly Seasonality [Alpha Extract]The Bitcoin Monthly Seasonality indicator analyzes historical Bitcoin price performance across different months of the year, enabling traders to identify seasonal patterns and potential trading opportunities. This tool helps traders:
Visualize which months historically perform best and worst for Bitcoin.
Track average returns and win rates for each month of the year.
Identify seasonal patterns to enhance trading strategies.
Compare cumulative or individual monthly performance.
🔶 CALCULATION
The indicator processes historical Bitcoin price data to calculate monthly performance metrics
Monthly Return Calculation
Inputs:
Monthly open and close prices.
User-defined lookback period (1-15 years).
Return Types:
Percentage: (monthEndPrice / monthStartPrice - 1) × 100
Price: monthEndPrice - monthStartPrice
Statistical Measures
Monthly Averages: ◦ Average return for each month calculated from historical data.
Win Rate: ◦ Percentage of positive returns for each month.
Best/Worst Detection: ◦ Identifies months with highest and lowest average returns.
Cumulative Option
Standard View: Shows discrete monthly performance.
Cumulative View: Shows compounding effect of consecutive months.
Example Calculation (Pine Script):
monthReturn = returnType == "Percentage" ?
(monthEndPrice / monthStartPrice - 1) * 100 :
monthEndPrice - monthStartPrice
calcWinRate(arr) =>
winCount = 0
totalCount = array.size(arr)
if totalCount > 0
for i = 0 to totalCount - 1
if array.get(arr, i) > 0
winCount += 1
(winCount / totalCount) * 100
else
0.0
🔶 DETAILS
Visual Features
Monthly Performance Bars: ◦ Color-coded bars (teal for positive, red for negative returns). ◦ Special highlighting for best (yellow) and worst (fuchsia) months.
Optional Trend Line: ◦ Shows continuous performance across months.
Monthly Axis Labels: ◦ Clear month names for easy reference.
Statistics Table: ◦ Comprehensive view of monthly performance metrics. ◦ Color-coded rows based on performance.
Interpretation
Strong Positive Months: Historically bullish periods for Bitcoin.
Strong Negative Months: Historically bearish periods for Bitcoin.
Win Rate Analysis: Higher win rates indicate more consistently positive months.
Pattern Recognition: Identify recurring seasonal patterns across years.
Best/Worst Identification: Quickly spot the historically strongest and weakest months.
🔶 EXAMPLES
The indicator helps identify key seasonal patterns
Bullish Seasons: Visualize historically strong months where Bitcoin tends to perform well, allowing traders to align long positions with favorable seasonality.
Bearish Seasons: Identify historically weak months where Bitcoin tends to underperform, helping traders avoid unfavorable periods or consider short positions.
Seasonal Strategy Development: Create trading strategies that capitalize on recurring monthly patterns, such as entering positions in historically strong months and reducing exposure during weak months.
Year-to-Year Comparison: Assess how current year performance compares to historical seasonal patterns to identify anomalies or confirmation of trends.
🔶 SETTINGS
Customization Options
Lookback Period: Adjust the number of years (1-15) used for historical analysis.
Return Type: Choose between percentage returns or absolute price changes.
Cumulative Option: Toggle between discrete monthly performance or cumulative effect.
Visual Style Options: Bar Display: Enable/disable and customize colors for positive/negative bars, Line Display: Enable/disable and customize colors for trend line, Axes Display: Show/hide reference axes.
Visual Enhancement: Best/Worst Month Highlighting: Toggle special highlighting of extreme months, Custom highlight colors for best and worst performing months.
The Bitcoin Monthly Seasonality indicator provides traders with valuable insights into Bitcoin's historical performance patterns throughout the year, helping to identify potentially favorable and unfavorable trading periods based on seasonal tendencies.

Statistical Trailing Stop [LuxAlgo]The Statistical Trailing Stop tool offers traders a way to lock in profits in trending markets with four statistical levels based on the log-normal distribution of volatility.
The indicator also features a dashboard with statistics of all detected signals.
🔶 USAGE
The tool works out of the box, traders can adjust the data used with two parameters: data & distribution length.
By default, the tool takes volatility measures of groups of 10 candles, and statistical measures of the last 100 of these groups then traders can adjust the base level to use as trailing, the larger the level, the more resistant the tool will be to moves against the trend.
🔹 Base Levels
Traders can choose up to 4 different levels of trailing, all based on the statistical distribution of volatility.
As we can see in the chart above, each higher level is more resistant to market movements, so level 0 is the most reactive and level 3 the least.
It is up to the trader to determine the best level for each underlying, time frame and market conditions.
🔹 Dashboard
The tool provides a dashboard with the statistics of all trades, making it very easy to assess the performance of the parameters used for any given market.
As we can see on the chart, all Daily BTC signals with default parameters but different base levels, level 2 is the best performing of all four, giving a positive expectation of $2435 per trade, taking into account all long and short trades.
Of note are the long trades with a win rate of 76.47% and a risk-to-reward of 3.34, giving a positive expectation of $4839 per trade, with winners having an average duration of 210 days and losers 32 days.
This, compared to short trades with negative expectation, speaks to the uptrend bias of this particular market.
🔶 SETTINGS
Data Length: Select how many bars to use per data point
Distribution Length: Select how many data points the distribution will have
Base Level: Choose between 4 different trailing levels
🔹 Dashboard
Show Statistics: Enable/disable dashboard
Position: Select dashboard position
Size: Select dashboard size

Multi-Timeframe Anchored VWAP Valuation# Multi-Timeframe Anchored VWAP Valuation
## Overview
This indicator provides a unique perspective on potential price valuation by comparing the current price to the Volume Weighted Average Price (VWAP) anchored to the start of multiple timeframes: Weekly, Monthly, Quarterly, and Yearly. It synthesizes these comparisons into a single oscillator value, helping traders gauge if the current price is potentially extended relative to significant volume-weighted levels.
## Core Concept & Calculation
1. **Anchored VWAP:** The script calculates the VWAP separately for the current Week, Month, Quarter (3 Months), and Year (12 Months), starting the calculation from the first bar of each period.
2. **Price Deviation:** It measures how far the current `close` price is from each of these anchored VWAPs. This distance is measured in terms of standard deviations calculated *within* that specific anchor period (e.g., how many weekly standard deviations the price is away from the weekly VWAP).
3. **Deviation Score (Multiplier):** Based on this standard deviation distance, a score is assigned. The further the price is from the VWAP (in terms of standard deviations), the higher the absolute score. The indicator uses linear interpolation to determine scores between the standard deviation levels (defaulted at 1, 2, and 3 standard deviations corresponding to scores of +/-2, +/-3, +/-4, with a score of 1 at the VWAP).
4. **Timeframe Weighting:** Longer timeframes are considered more significant. The deviation scores are multiplied by fixed scalars: Weekly (x1), Monthly (x2), Quarterly (x3), Yearly (x4).
5. **Final Valuation Metric:** The weighted scores from all four timeframes are summed up to produce the final oscillator value plotted in the indicator pane.
## How to Interpret and Use
* **Histogram (Indicator Pane):**
* The main output is the histogram representing the `Final Valuation Metric`.
* **Positive Values:** Suggest the price is generally trading above its volume-weighted averages across the timeframes, potentially indicating strength or relative "overvaluation."
* **Negative Values:** Suggest the price is generally trading below its volume-weighted averages, potentially indicating weakness or relative "undervaluation."
* **Values Near Zero:** Indicate the price is relatively close to its volume-weighted averages.
* **Histogram Color:**
* The color of the histogram bars provides context based on the metric's *own recent history*.
* **Green (Positive Color):** The metric is currently *above* its recent average plus a standard deviation band (dynamic upper threshold). This highlights potentially significant "overvalued" readings relative to its normal range.
* **Red (Negative Color):** The metric is currently *below* its recent average minus a standard deviation band (dynamic lower threshold). This highlights potentially significant "undervalued" readings relative to its normal range.
* **Gray (Neutral Color):** The metric is within its typical recent range (between the dynamic upper and lower thresholds).
* **Orange Line:** Plots the moving average of the `Final Valuation Metric` itself (based on the "Threshold Lookback Period"), serving as the centerline for the dynamic thresholds.
* **On-Chart Table:**
* Provides a detailed breakdown for transparency.
* Shows the calculated VWAP, the raw deviation multiplier score, and the final weighted (adjusted) metric for each individual timeframe (W, M, Q, Y).
* Displays the current price, the final combined metric value, and a textual interpretation ("Overvalued", "Undervalued", "Neutral") based on the dynamic thresholds.
## Potential Use Cases
* Identifying potential exhaustion points when the indicator reaches statistically high (green) or low (red) levels relative to its recent history.
* Assessing whether price trends are supported by underlying volume-weighted average prices across multiple timeframes.
* Can be used alongside other technical analysis tools for confirmation.
## Settings
* **Calculation Settings:**
* `STDEV Level 1`: Adjusts the 1st standard deviation level (default 1.0).
* `STDEV Level 2`: Adjusts the 2nd standard deviation level (default 2.0).
* `STDEV Level 3`: Adjusts the 3rd standard deviation level (default 3.0).
* **Interpretation Settings:**
* `Threshold Lookback Period`: Defines the number of bars used to calculate the average and standard deviation of the final metric for dynamic thresholds (default 200).
* `Threshold StDev Multiplier`: Controls how many standard deviations above/below the metric's average are used to set the "Overvalued"/"Undervalued" thresholds (default 1.0).
* **Table Settings:** Customize the position and colors of the data table displayed on the chart.
## Important Considerations
* This indicator measures price deviation relative to *anchored* VWAPs and its *own historical range*. It is not a standalone trading system.
* The interpretation of "Overvalued" and "Undervalued" is relative to the indicator's logic and calculations; it does not guarantee future price movement.
* Like all indicators, past performance is not indicative of future results. Use this tool as part of a comprehensive analysis and risk management strategy.
* The anchored VWAP and Standard Deviation values reset at the beginning of each respective period (Week, Month, Quarter, Year).

Elastic Volume-Weighted Student-T TensionOverview
The Elastic Volume-Weighted Student-T Tension Bands indicator dynamically adapts to market conditions using an advanced statistical model based on the Student-T distribution. Unlike traditional Bollinger Bands or Keltner Channels, this indicator leverages elastic volume-weighted averaging to compute real-time dispersion and location parameters, making it highly responsive to volatility changes while maintaining robustness against price fluctuations.
This methodology is inspired by incremental calculation techniques for weighted mean and variance, as outlined in the paper by Tony Finch:
📄 "Incremental Calculation of Weighted Mean and Variance" .
Key Features
✅ Adaptive Volatility Estimation – Uses an exponentially weighted Student-T model to dynamically adjust band width.
✅ Volume-Weighted Mean & Dispersion – Incorporates real-time volume weighting, ensuring a more accurate representation of market sentiment.
✅ High-Timeframe Volume Normalization – Provides an option to smooth volume impact by referencing a higher timeframe’s cumulative volume, reducing noise from high-variability bars.
✅ Customizable Tension Parameters – Configurable standard deviation multipliers (σ) allow for fine-tuned volatility sensitivity.
✅ %B-Like Oscillator for Relative Price Positioning – The main indicator is in form of a dedicated oscillator pane that normalizes price position within the sigma ranges, helping identify overbought/oversold conditions and potential momentum shifts.
✅ Robust Statistical Foundation – Utilizes kurtosis-based degree-of-freedom estimation, enhancing responsiveness across different market conditions.
How It Works
Volume-Weighted Elastic Mean (eμ) – Computes a dynamic mean price using an elastic weighted moving average approach, influenced by trade volume, if not volume detected in series, study takes true range as replacement.
Dispersion (eσ) via Student-T Distribution – Instead of assuming a fixed normal distribution, the bands adapt to heavy-tailed distributions using kurtosis-driven degrees of freedom.
Incremental Calculation of Variance – The indicator applies Tony Finch’s incremental method for computing weighted variance instead of arithmetic sum's of fixed bar window or arrays, improving efficiency and numerical stability.
Tension Calculation – There are 2 dispersion custom "zones" that are computed based on the weighted mean and dynamically adjusted standard student-t deviation.
%B-Like Oscillator Calculation – The oscillator normalizes the price within the band structure, with values between 0 and 1:
* 0.00 → Price is at the lower band (-2σ).
* 0.50 → Price is at the volume-weighted mean (eμ).
* 1.00 → Price is at the upper band (+2σ).
* Readings above 1.00 or below 0.00 suggest extreme movements or possible breakouts.
Recommended Usage
For scalping in lower timeframes, it is recommended to use the fixed α Decay Factor, it is in raw format for better control, but you can easily make a like of transformation to N-bar size window like in EMA-1 bar dividing 2 / decayFactor or like an RMA dividing 1 / decayFactor.
The HTF selector catch quite well Higher Time Frame analysis, for example using a Daily chart and using as HTF the 200-day timeframe, weekly or monthly.
Suitable for trend confirmation, breakout detection, and mean reversion plays.
The %B-like oscillator helps gauge momentum strength and detect divergences in price action if user prefer a clean chart without bands, this thanks to pineScript v6 force overlay feature.
Ideal for markets with volume-driven momentum shifts (e.g., futures, forex, crypto).
Customization Parameters
Fixed α Decay Factor – Controls the rate of volume weighting influence for an approximation EWMA approach instead of using sum of series or arrays, making the code lightweight & computing fast O(1).
HTF Volume Smoothing – Instead of a fixed denominator for computing α , a volume sum of the last 2 higher timeframe closed candles are used as denominator for our α weight factor. This is useful to review mayor trends like in daily, weekly, monthly.
Tension Multipliers (±σ) – Adjusts sensitivity to dispersion sigma parameter (volatility).
Oscillator Zone Fills – Visual cues for price positioning within the cloud range.
Posible Interpretations
As market within indicators relay on each individual edge, this are just some key ideas to glimpse how the indicator could be interpreted by the user:
📌 Price inside bands – Market is considered somehow "stable"; price is like resting from tension or "charging batteries" for volume spike moves.
📌 Price breaking outer bands – Potential breakout or extreme movement; watch for reversals or continuation from strong moves. Market is already in tension or generating it.
📌 Narrowing Bands – Decreasing volatility; expect contraction before expansion.
📌 Widening Bands – Increased volatility; prepare for high probability pull-back moves, specially to the center location of the bands (the mean) or the other side of them.
📌 Oscillator is just the interpretation of the price normalized across the Student-T distribution fitting "curve" using the location parameter, our Elastic Volume weighted mean (eμ) fixed at 0.5 value.
Final Thoughts
The Elastic Volume-Weighted Student-T Tension indicator provides a powerful, volume-sensitive alternative to traditional volatility bands. By integrating real-time volume analysis with an adaptive statistical model, incremental variance computation, in a relative price oscillator that can be overlayed in the chart as bands, it offers traders an edge in identifying momentum shifts, trend strength, and breakout potential. Think of the distribution as a relative "tension" rubber band in which price never leave so far alone.
DISCLAIMER:
The Following indicator/code IS NOT intended to be a formal investment advice or recommendation by the author, nor should be construed as such. Users will be fully responsible by their use regarding their own trading vehicles/assets.
The following indicator was made for NON LUCRATIVE ACTIVITIES and must remain as is, following TradingView's regulations. Use of indicator and their code are published for work and knowledge sharing. All access granted over it, their use, copy or re-use should mention authorship(s) and origin(s).
WARNING NOTICE!
THE INCLUDED FUNCTION MUST BE CONSIDERED FOR TESTING. The models included in the indicator have been taken from open sources on the web and some of them has been modified by the author, problems could occur at diverse data sceneries, compiler version, or any other externality.

Naive Bayes Candlestick Pattern Classifier v1.1 BETAAn intermezzo on why i made this script publication..
A : Candlestick Pattern took hours to backtest, why not using Machine Learning techniques?
B : Machine Learning, no that's gonna be really heavy bro!
A : Not really, because we use Naive Bayes.
B : The simplest, yet powerful machine learning algorithm to separate (a.k.a classify) multivariate data.
----------------------------------------------------------------------------------------------------------------------
Hello, everyone!
After deep research in extracting meaningful information from the market, I ended up building this powerful machine learning indicator based on the evolution of Bayesian Statistics. This indicator not only leverages the simplicity of Naive Bayes but also extends its application to candlestick pattern analysis, making it an invaluable tool for traders who are looking to enhance their technical analysis without spending countless hours manually backtesting each pattern on each market!.
What most interesting part is actually after learning all of likely useless methods like fibonacci, supply and demand, volume profile, etc. We always ended up back to basic like support and resistance and candlestick patterns, but with a slight twist on strategy algorithm design and statistical approach. Thus, the only reason why i made this, because i exactly know that you guys will ended up in this position as time goes by.
The essence of this indicator lies in its ability to automate the recognition and statistical evaluation of various candlestick patterns. Traditionally, traders have relied on visual inspection and manual backtesting to determine the effectiveness of patterns like Bullish Engulfing, Bearish Engulfing, Harami variations, Hammer formations, and even more complex multi-candle patterns such as Three White Soldiers, Three Black Crows, Dark Cloud Cover, and Piercing Pattern. However, these conventional methods are both time-consuming and prone to subjective bias.
To address these challenges, I employed Naive Bayes—a probabilistic classifier that, despite its simplicity, offers robust performance in various domains. Naive Bayes assumes that each feature is independent of the others given the class label, which, although a strong assumption, works remarkably well in practice, especially when the dataset is large like market data and the feature space is high-dimensional. In our case, each candlestick pattern acts as a feature that can be statistically evaluated based on its historical performance. The indicator calculates a probability that a given pattern will lead to a price reversal, by comparing the pattern’s close price to the highest or lowest price achieved in a lookahead window.
One of the standout features of this script is its flexibility. Each candlestick pattern is not only coded into the system but also comes with individual toggles to enable or disable them based on your trading strategy. This means you can choose to focus on single-candle patterns like Bullish Engulfing or more complex multi-candle formations such as Three White Soldiers, without modifying the core code. The built-in customization options allow you to adjust colors and labels for each pattern, giving you the freedom to tailor the visual output to your preference. This level of customization ensures that the indicator integrates seamlessly into your existing TradingView setup.
Moreover, the indicator isn’t just about pattern recognition—it also incorporates outcome-based learning. Every time a pattern is detected, it looks ahead a predefined number of bars to evaluate if the expected reversal actually materialized. This outcome is then stored in arrays, and over time, the script dynamically calculates the probability of success for each pattern. These probabilities are presented in a real-time updating table on your chart, which shows not only the percentage probability but also the count of historical occurrences. With this information at your fingertips, you can quickly gauge the reliability of each pattern in your chosen market and timeframe.
Another significant advantage of this approach is its speed and efficiency. While more complex machine learning models like neural networks might require heavy computational resources and longer training times, the Naive Bayes classifier in this script is lightweight, instantaneous and can be updated on the fly with each new bar. This real-time capability is essential for modern traders who need to make quick decisions in fast-paced markets.
Furthermore, by automating the process of backtesting, the indicator frees up your time to focus on other aspects of trading strategy development. Instead of manually analyzing hundreds or even thousands of candles, you can rely on the statistical power of Naive Bayes to provide you with insights on which patterns are most likely to result in profitable moves. This not only enhances your efficiency but also helps to eliminate the cognitive biases that often plague manual analysis.
In summary, this indicator represents a fusion of traditional candlestick analysis with modern machine learning techniques. It harnesses the simplicity and effectiveness of Naive Bayes to deliver a dynamic, real-time evaluation of various candlestick patterns. Whether you are a seasoned trader looking to refine your technical analysis or a beginner eager to understand market dynamics, this tool offers a powerful, customizable, and efficient solution. Welcome to a new era where advanced statistical methods meet practical trading insights—happy trading and may your patterns always be in your favor!
Note : On this current released beta version, you must manually adjust reversal percentage move based on each market. Further updates may include automated best range detection and probability.

Smart Market Bias [PhenLabs]📊 Smart Market Bias Indicator (SMBI)
Version: PineScript™ v6
Description
The Smart Market Bias Indicator (SMBI) is an advanced technical analysis tool that combines multiple statistical approaches to determine market direction and strength. It utilizes complexity analysis, information theory (Kullback Leibler divergence), and traditional technical indicators to provide a comprehensive market bias assessment. The indicator features adaptive parameters based on timeframe and trading style, with real-time visualization through a sophisticated dashboard.
🔧 Components
Complexity Analysis: Measures price movement patterns and trend strength
KL Divergence: Statistical comparison of price distributions
Technical Overlays: RSI and Bollinger Bands integration
Filter System: Volume and trend validation
Visual Dashboard: Dynamic color-coded display of all components
Simultaneous current timeframe + higher time frame analysis
🚨Important Explanation Feature🚨
By hovering over each individual cell in this comprehensive dashboard, you will get a thorough and in depth explanation of what each cells is showing you
Visualization
HTF Visualization
📌 Usage Guidelines
Based on your own trading style you should alter the timeframe length that you would like to be analyzing with your dashboard
The longer the term of the position you are planning on entering the higher timeframe you should have your dashboard set to
Bias Interpretation:
Values > 50% indicate bullish bias
Values < 50% indicate bearish bias
Neutral zone: 45-55% suggests consolidation
✅ Best Practices:
Use appropriate timeframe preset for your trading style
Monitor all components for convergence/divergence
Consider filter strength for signal validation
Use color intensity as confidence indicator
⚠️ Limitations
Requires sufficient historical data for accurate calculations
Higher computational complexity on lower timeframes
May lag during extremely volatile conditions
Best performance during regular market hours
What Makes This Unique
Multi-Component Analysis: Combines complexity theory, statistical analysis, and traditional technical indicators
Adaptive Parameters: Automatically optimizes settings based on timeframe
Triple-Layer Filtering: Uses trend, volume, and minimum strength thresholds
Visual Confidence System: Color intensity indicates signal strength
Multi-Timeframe Capabilities: Allowing the trader to analyze not only their current time frame but also the higher timeframe bias
🔧 How It Works
The indicator processes market data through four main components:
Complexity Score (40% weight): Analyzes price returns and pattern complexity
Kullback Leibler Divergence (30% weight): Compares current and historical price distributions
RSI Analysis (20% weight): Momentum and oversold/overbought conditions
Bollinger Band Position (10% weight): Price position relative to volatility
Underlying Method
Maintains rolling windows of price data for multiple calculations
Applies custom normalization using hyperbolic tangent function
Weights component scores based on reliability and importance
Generates final bias percentage with confidence visualization
💡 Note: For optimal results, use in conjunction with price action analysis and consider multiple timeframe confirmation. The indicator performs best when all components show alignment.

Trend Reversal Probability [Algoalpha]Introducing Trend Reversal Probability by AlgoAlpha – a powerful indicator that estimates the likelihood of trend reversals based on an advanced custom oscillator and duration-based statistics. Designed for traders who want to stay ahead of potential market shifts, this indicator provides actionable insights into trend momentum and reversal probabilities.
Key Features :
🔧 Custom Oscillator Calculation: Combines a dual SMA strategy with a proprietary RSI-like calculation to detect market direction and strength.
📊 Probability Levels & Visualization: Plots average signal durations and their statistical deviations (±1, ±2, ±3 SD) on the chart for clear visual guidance.
🎨 Dynamic Color Customization: Choose your preferred colors for upward and downward trends, ensuring a personalized chart view.
📈 Signal Duration Metrics: Tracks and displays signal durations with columns representing key percentages (80%, 60%, 40%, and 20%).
🔔 Alerts for High Probability Events: Set alerts for significant reversal probabilities (above 84% and 98% or below 14%) to capture key trading moments.
How to Use :
Add the Indicator: Add Trend Reversal Probability to your favorites by clicking the star icon.
Market Analysis: Use the plotted probability levels (average duration and ±SD bands) to identify overextended trends and potential reversals. Use the color of the duration counter to identify the current trend.
Leverage Alerts: Enable alerts to stay informed of high or extreme reversal probabilities without constant chart monitoring.
How It Works :
The indicator begins by calculating a custom oscillator using short and long simple moving averages (SMA) of the midpoint price. A proprietary RSI-like formula then transforms these values to estimate trend direction and momentum. The duration between trend reversals is tracked and averaged, with standard deviations plotted to provide probabilistic guidance on trend longevity. Additionally, the indicator incorporates a cumulative probability function to estimate the likelihood of a trend reversal, displaying the result in a data table for easy reference. When probability levels cross key thresholds, alerts are triggered, helping traders take timely action.

Statistical Trend Analysis (Scatterplot) [BigBeluga]Statistical Trend Analysis (Scatterplot) provides a unique perspective on market dynamics by combining the statistical concept of z-scores with scatterplot visualization to assess price momentum and potential trend shifts.
🧿 What is Z-Score?
Definition: A z-score is a statistical measure that quantifies how far a data point is from the mean, expressed in terms of standard deviations.
In this Indicator:
A high positive z-score indicates the price is significantly above the average.
A low negative z-score indicates the price is significantly below the average.
The indicator also calculates the rate of change of the z-score, helping identify momentum shifts in the market.
🧿 Key Features:
Scatterplot Visualization:
Displays data points of z-score and its change across four quadrants.
Quadrants help interpret market conditions:
Upper Right (Strong Bullish Momentum): Most data points here signal an ongoing uptrend.
Upper Left (Weakening Momentum): Data points here may indicate a potential market shift or ranging market.
Lower Left (Strong Bearish Momentum): Indicates a dominant downtrend.
Lower Right (Trend Shift to Bullish/Ranging): Suggests weakening bearish momentum or an emerging uptrend.
Color-Coded Candles:
Candles are dynamically colored based on the z-score, providing a visual cue about the price's deviation from the mean.
Z-Score Time Series:
A line plot of z-scores over time shows price deviation trends.
A gray histogram displays the rate of change of the z-score, highlighting momentum shifts.
🧿 Usage:
Use the scatterplot and quadrant gauges to understand the current market momentum and potential shifts.
Monitor the z-score line plot to identify overbought/oversold conditions.
Utilize the gray histogram to detect momentum reversals and trend strength.
This tool is ideal for traders who rely on statistical insights to confirm trends, detect potential reversals, and assess market momentum visually and quantitatively.
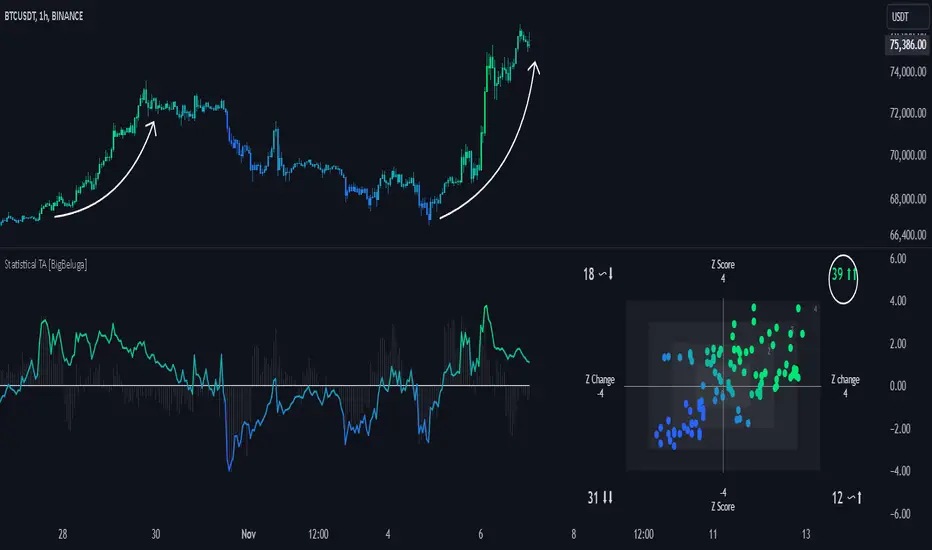
Range Channel by Atilla YurtsevenThis script creates a dynamic channel around a user-selected moving average (MA). It calculates the relative difference between price and the MA, then finds the average of the positive differences and the negative differences separately. Using these averages, it plots upper and lower bands around the MA as well as a histogram-like oscillator to show when price moves above or below the average thresholds.
How It Works
Moving Average Selection
The indicator allows you to choose among multiple MA types (SMA, EMA, WMA, Linear Regression, etc.). Depending on your preference, it calculates the chosen MA for the selected lookback period.
Relative Difference Calculation
It then computes the percentage difference between the source (typically the closing price) and the MA. (diff = (src / ma - 1) * 100)
Positive & Negative Averages
- Positive differences are averaged and represent how far the price typically moves above the MA.
- Negative differences are similarly averaged for when price moves below the MA.
Range Channel & Oscillator
- The channel is plotted around the MA using the average positive and negative differences (Upper Edge and Lower Edge).
- The “Untrended” histogram plots the difference (diff). Green bars occur when price is above the MA on average, and red bars when below. Two additional lines mark the upper and lower average thresholds on this histogram.
How to Use
Identify Overbought/Oversold Zones: The upper edge can serve as a dynamic overbought level, while the lower edge can suggest potential oversold conditions. When the histogram approaches or crosses these levels, it may signal price extremes relative to its average movement.
Trend Confirmation: Compare price action relative to the channel. If price and the histogram consistently remain above the MA and upper threshold, it could indicate a stronger bullish trend. If they remain below, it might signal a prolonged bearish trend.
Entry/Exit Timings:
- Entry: Traders can look for moments when price breaks back inside the channel from an extreme, anticipating a mean reversion.
- Exit: Watching how price interacts with these dynamic edges can help define stop-loss or take-profit points.
Because these thresholds adapt over time based on actual price behavior, they can be more responsive than fixed-percentage bands. However, like all indicators, it’s most effective when used in conjunction with other technical and fundamental tools.
Disclaimer
This script is provided for educational and informational purposes only. It does not guarantee any specific outcome or profit. Use it at your own discretion and risk.
Trade smart, stay safe.
Atilla Yurtseven

Trend Forecasting - The Quant Science🌏 Trend Forecasting | ENG 🌏
This plug-in acts as a statistical filter, adding new information to your chart that will allow you to quickly verify the direction of a trend and the probability with which the price will be above or below the average in the future, helping you to uncover probable market inefficiencies.
🧠 Model calculation
The model calculates the arithmetic mean in relation to positive and negative events within the available sample for the selected time series. Where a positive event is defined as a closing price greater than the average, and a negative event as a closing price less than the average. Once all events have been calculated, the probabilities are extrapolated by relating each event.
Example
Positive event A: 70
Negative event B: 30
Total events: 100
Probabilities A: (100 / 70) x 100 = 70%
Probabilities B: (100 / 30) x 100 = 30%
Event A has a 70% probability of occurring compared to Event B which has a 30% probability.
🔍 Information Filter
The data on the graph show the future probabilities of prices being above average (default in green) and the probabilities of prices being below average (default in red).
The information that can be quickly retrieved from this indicator is:
1. Trend: Above-average prices together with a constant of data in green greater than 50% + 1 indicate that the observed historical series shows a bullish trend. The probability is correlated proportionally to the value of the data; the higher and increasing the expected value, the greater the observed bullish trend. On the other hand, a below-average price together with a red-coloured data constant show quantitative data regarding the presence of a bearish trend.
2. Future Probability: By analysing the data, it is possible to find the probability with which the price will be above or below the average in the future. In green are classified the probabilities that the price will be higher than the average, in red are classified the probabilities that the price will be lower than the average.
🔫 Operational Filter .
The indicator can be used operationally in the search for investment or trading opportunities given its ability to identify an inefficiency within the observed data sample.
⬆ Bullish forecast
For bullish trades, the inefficiency will appear as a historical series with a bullish trend, with high probability of a bullish trend in the future that is currently below the average.
⬇ Bearish forecast
For short trades, the inefficiency will appear as a historical series with a bearish trend, with a high probability of a bearish trend in the future that is currently above the average.
📚 Settings
Input: via the Input user interface, it is possible to adjust the periods (1 to 500) with which the average is to be calculated. By default the periods are set to 200, which means that the average is calculated by taking the last 200 periods.
Style: via the Style user interface it is possible to adjust the colour and switch a specific output on or off.
🇮🇹Previsione Della Tendenza Futura | ITA 🇮🇹
Questo plug-in funge da filtro statistico, aggiungendo nuove informazioni al tuo grafico che ti permetteranno di verificare rapidamente tendenza di un trend, probabilità con la quale il prezzo si troverà sopra o sotto la media in futuro aiutandoti a scovare probabili inefficienze di mercato.
🧠 Calcolo del modello
Il modello calcola la media aritmetica in relazione con gli eventi positivi e negativi all'intero del campione disponibile per la serie storica selezionata. Dove per evento positivo si intende un prezzo alla chiusura maggiore della media, mentre per evento negativo si intende un prezzo alla chiusura minore della media. Calcolata la totalità degli eventi le probabilità vengono estrapolate rapportando ciascun evento.
Esempio
Evento positivo A: 70
Evento negativo B: 30
Totale eventi : 100
Formula A: (100 / 70) x 100 = 70%
Formula B: (100 / 30) x 100 = 30%
Evento A ha una probabilità del 70% di realizzarsi rispetto all' Evento B che ha una probabilità pari al 30%.
🔍 Filtro informativo
I dati sul grafico mostrano le probabilità future che i prezzi siano sopra la media (di default in verde) e le probabilità che i prezzi siano sotto la media (di default in rosso).
Le informazioni che si possono rapidamente reperire da questo indicatore sono:
1. Trend: I prezzi sopra la media insieme ad una costante di dati in verde maggiori al 50% + 1 indicano che la serie storica osservata presenta un trend rialzista. La probabilità è correlata proporzionalmente al valore del dato; tanto più sarà alto e crescente il valore atteso e maggiore sarà la tendenza rialzista osservata. Viceversa, un prezzo sotto la media insieme ad una costante di dati classificati in colore rosso mostrano dati quantitativi riguardo la presenza di una tendenza ribassista.
2. Probabilità future: analizzando i dati è possibile reperire la probabilità con cui il prezzo si troverà sopra o sotto la media in futuro. In verde vengono classificate le probabilità che il prezzo sarà maggiore alla media, in rosso vengono classificate le probabilità che il prezzo sarà minore della media.
🔫 Filtro operativo
L' indicatore può essere utilizzato a livello operativo nella ricerca di opportunità di investimento o di trading vista la capacità di identificare un inefficienza all'interno del campione di dati osservato.
⬆ Previsione rialzista
Per operatività di tipo rialzista l'inefficienza apparirà come una serie storica a tendenza rialzista, con alte probabilità di tendenza rialzista in futuro che attualmente si trova al di sotto della media.
⬇ Previsione ribassista
Per operatività di tipo short l'inefficienza apparirà come una serie storica a tendenza ribassista, con alte probabilità di tendenza ribassista in futuro che si trova attualmente sopra la media.
📚 Impostazioni
Input: tramite l'interfaccia utente Input è possibile regolare i periodi (da 1 a 500) con cui calcolare la media. Di default i periodi sono impostati sul valore di 200, questo significa che la media viene calcolata prendendo gli ultimi 200 periodi.
Style: tramite l'interfaccia utente Style è possibile regolare il colore e attivare o disattivare un specifico output.
Moving Average Cross Probability [AlgoAlpha]Moving Average Cross Probability 📈✨
The Moving Average Cross Probability by AlgoAlpha calculates the probability of a cross-over or cross-under between the fast and slow values of a user defined Moving Average type before it happens, allowing users to benefit by front running the market.
✨ Key Features:
📊 Probability Histogram: Displays the Probability of MA cross in the form of a histogram.
🔄 Data Table: Displays forecast information for quick analysis.
🎨 Customizable MAs: Choose from various moving averages and customize their length.
🚀 How to Use:
🛠 Add Indicator: Add the indicator to favorites, and customize the settings to suite your trading style.
📊 Analyze Market: Watch the indicator to look for trend shifts early or for trend continuations.
🔔 Set Alerts: Get notified of bullish/bearish points.
✨ How It Works:
The Moving Average Cross Probability Indicator by AlgoAlpha determines the probability by looking at a probable range of values that the price can take in the next bar and finds out what percentage of those possibilities result in the user defined moving average crossing each other. This is done by first using the HMA to predict what the next price value will be, a standard deviation based range is then calculated. The range is divided by the user defined resolution and is split into multiple levels, each of these levels represent a possible value for price in the next bar. These possible predicted values are used to calculate the possible MA values for both the fast and slow MAs that may occur in the next bar and are then compared to see how many of those possible MA results end up crossing each other.
Stay ahead of the market with the Moving Average Cross Probability Indicator AlgoAlpha! 📈💡
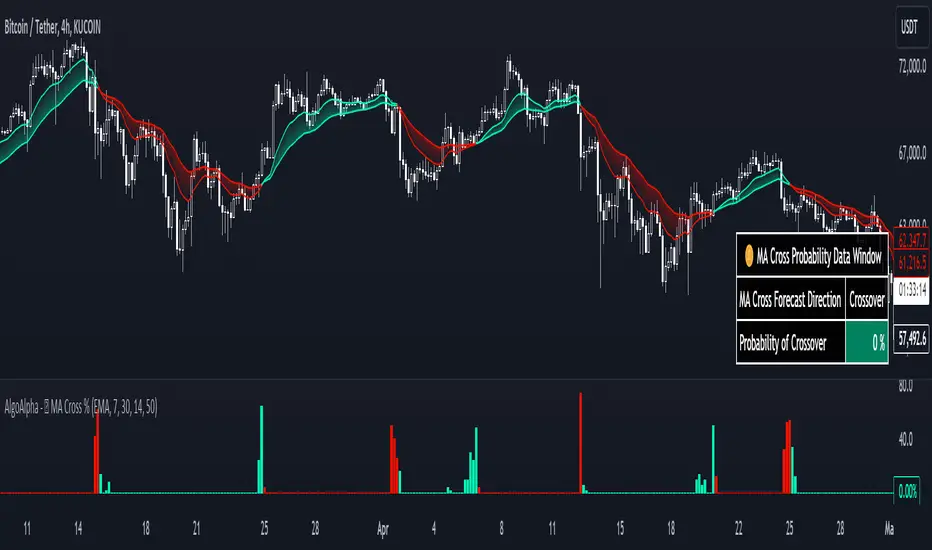
Vwap Z-Score with Signals [UAlgo]The "VWAP Z-Score with Signals " is a technical analysis tool designed to help traders identify potential buy and sell signals based on the Volume Weighted Average Price (VWAP) and its Z-Score. This indicator calculates the VWAP Z-Score to show how far the current price deviates from the VWAP in terms of standard deviations. It highlights overbought and oversold conditions with visual signals, aiding in the identification of potential market reversals. The tool is customizable, allowing users to adjust parameters for their specific trading needs.
🔶 Features
VWAP Z-Score Calculation: Measures the deviation of the current price from the VWAP using standard deviations.
Customizable Parameters: Allows users to set the length of the VWAP Z-Score calculation and define thresholds for overbought and oversold levels.
Reversal Signals: Provides visual signals when the Z-Score crosses the specified thresholds, indicating potential buy or sell opportunities.
🔶 Usage
Extreme Z-Score values (both positive and negative) highlight significant deviations from the VWAP, useful for identifying potential reversal points.
The indicator provides visual signals when the Z-Score crosses predefined thresholds:
A buy signal (🔼) appears when the Z-Score crosses above the lower threshold, suggesting the price may be oversold and a potential upward reversal.
A sell signal (🔽) appears when the Z-Score crosses below the upper threshold, suggesting the price may be overbought and a potential downward reversal.
These signals can help you identify potential entry and exit points in your trading strategy.
🔶 Disclaimer
The "VWAP Z-Score with Signals " indicator is designed for educational purposes and to assist traders in their technical analysis. It does not guarantee profitable trades and should not be considered as financial advice.
Users should conduct their own research and use this indicator in conjunction with other tools and strategies.
Trading involves significant risk, and it is possible to lose more than your initial investment.

BTC Valuation
The BTC Valuation indicator
is a powerful tool designed to assist traders and analysts in evaluating the current state of Bitcoin's market valuation. By leveraging key moving averages and a logarithmic trendline, this indicator offers valuable insights into potential buying or selling opportunities based on historical price value.
Key Features:
200MA/P (200-day Moving Average to Price Ratio):
Provides a perspective on Bitcoin's long-term trend by comparing the current price to its 200-day Simple Moving Average (SMA).
A positive value suggests potential undervaluation, while a negative value may indicate overvaluation.
50MA/P (50-day Moving Average to Price Ratio):
Focuses on short-term trends, offering insights into the relationship between Bitcoin's current price and its 50-day SMA.
Helps traders identify potential bullish or bearish trends in the near term.
LTL/P (Logarithmic TrendLine to Price Ratio):
Incorporates a logarithmic trendline, considering Bitcoin's historical age in days.
Assists in evaluating whether the current price aligns with the long-term logarithmic trend, signaling potential overvaluation or undervaluation.
How to Use:
Z Score Indicator Integration:
The BTC Valuation indicator leverages the Z Score Indicator to score the ratios in a statistical way.
Statistical scoring provides a standardized measure of how far each ratio deviates from the mean, aiding in a more nuanced and objective evaluation.
Z Score Indicator
This BTC Valuation indicator provides a comprehensive view of Bitcoin's valuation dynamics, allowing traders to make informed decisions.
While indicators like BTC Valuation provide valuable insights, it's crucial to remember that no indicator guarantees market predictions.
Traders should use indicators as part of a comprehensive strategy and consider multiple factors before making trading decisions.
Historical performance is not indicative of future results. Exercise caution and continually refine your approach based on market dynamics.

Commitments of Traders Report [Advanced]This indicator displays the Commitment of Traders (COT) report data in a clear, table format similar to an Excel spreadsheet, with additional functionalities to analyze open interest and position changes. The COT report, published weekly by the Commodity Futures Trading Commission (CFTC), provides valuable insights into market sentiment by revealing the positioning of various trader categories.
Display:
Release Date: When the data was released.
Open Interest: Shows the total number of open contracts for the underlying instrument held by selected trader category.
Net Contracts: Shows the difference between long and short positions for selected trader category.
Long/Short OI: Displays the long and short positions held by selected trader category.
Change in Long/Short OI: Displays the change in long and short positions since the previous reporting period. This can highlight buying or selling pressure.
Long & Short Percentage: Displays the percentage of total long and short positions held by each category.
Trader Categories (Configurable)
Commercials: Hedgers who use futures contracts to manage risk associated with their underlying business (e.g., producers, consumers).
Non-Commercials (Large Speculators): Speculative traders with large positions who aim to profit from price movements (e.g., hedge funds, investment banks).
Non-Reportable (Small Speculators/Retail Traders): Smaller traders with positions below the CFTC reporting thresholds.
CFTC Code: If the indicator fails to retrieve data, you can manually enter the CFTC code for the specific instrument. The code for instrument can be found on CFTC's website.
Using the Indicator Effectively
Market Sentiment Gauge: Analyze the positioning of each trader category to gauge overall market sentiment.
High net longs by commercials might indicate a bullish outlook, while high net shorts could suggest bearish sentiment.
Changes in open interest and long/short positions can provide additional insights into buying and selling pressure.
Trend Confirmation: Don't rely solely on COT data for trade signals. Use it alongside price action and other technical indicators for confirmation.
Identify Potential Turning Points: Extreme readings in COT data, combined with significant changes in open interest or positioning, might precede trend reversals, but exercise caution and combine with other analysis tools.
Disclaimer
Remember, the COT report is just one piece of the puzzle. It should not be used for making isolated trading decisions. Consider incorporating it into a comprehensive trading strategy that factors in other technical and fundamental analysis.
Credit
A big shoutout to Nick from Transparent FX ! His expertise and thoughtful analysis have been a major inspiration in developing this COT Report indicator. To know more about this indicator and how to use it, be sure to check out his work.

Likelihood of Winning - Probability Density FunctionIn developing the "Likelihood of Winning - Probability Density Function (PDF)" indicator, my aim was to offer traders a statistical tool to quantify the probability of reaching target prices. This indicator, grounded in risk assessment principles, enables users to analyze potential outcomes based on the normal distribution, providing insights into market dynamics.
The tool's flexibility allows for customization of the data series, lookback periods, and target settings for both long and short scenarios. It features a color-coded visualization to easily distinguish between probabilities of hitting specified targets, enhancing decision-making in trading strategies.
I'm excited to share this indicator with the trading community, hoping it will enhance data-driven decision-making and offer a deeper understanding of market risks and opportunities. My goal is to continuously improve this tool based on user feedback and market evolution, contributing to more informed trading practices.
This indicator leverages the "NormalDistributionFunctions" library, enabling easy integration into other indicators or strategies. Users can readily embed advanced statistical analysis into their trading tools, fostering innovation within the Pine Script community.
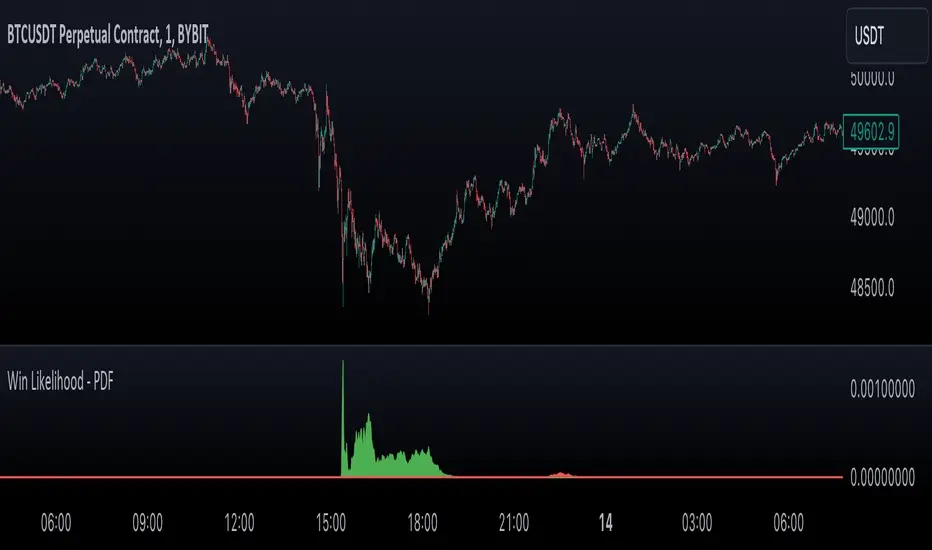
Mean Reversion Watchlist [Z score]Hi Traders !
What is the Z score:
The Z score measures a values variability factor from the mean, this value is denoted by z and is interpreted as the number of standard deviations from the mean.
The Z score is often applied to the normal distribution to “standardize” the values; this makes comparison of normally distributed random variables with different units possible.
This popular reversal based indicator makes an assumption that the sample distribution (in this case the sample of price values) is normal, this allows for the interpretation that values with an extremely high or low percentile or “Z” value will likely be reversal zones.
This is because in the population data (the true distribution) which is known, anomaly values are very rare, therefore if price were to take a z score factor of 3 this would mean that price lies 3 standard deviations from the mean in the positive direction and is in the ≈99% percentile of all values. We would take this as a sign of a negative reversal as it is very unlikely to observe a consecutive equal to or more extreme than this percentile or Z value.
The z score normalization equation is given by
In Pine Script the Z score can be computed very easily using the below code.
// Z score custom function
Zscore(source, lookback) =>
sma = ta.sma(source, lookback)
stdev = ta.stdev(source, lookback, true)
zscore = (source - sma) / stdev
zscore
The Indicator:
This indicator plots the Z score for up to 20 different assets ( Note the maximum is 40 however the utility of 40 plots in one indicator is not much, there is a diminishing marginal return of the number of plots ).
Z score threshold levels can also be specified, the interpretation is the same as stated above.
The timeframe can also be fixed, by toggling the “Time frame lock” user input under the “TIME FRAME LOCK” user input group ( Note this indicator does not repain t).

VWMA/SMA Delta Volatility (Statistical Anomaly Detector)The "VWMA/SMA Delta Volatility (Statistical Anomaly Detector)" indicator is a tool designed to detect and visualize volatility in a financial market's price data. The indicator calculates the difference (delta) between two moving averages (VWMA/SMA) and uses statistical analysis to identify anomalies or extreme price movements. Here's a breakdown of its components:
Hypothesis:
The hypothesis behind this indicator is that extreme price movements or anomalies in the market can be detected by analyzing the difference between two moving averages and comparing it to a statistically derived normal distribution. When the MA delta (the difference between two MAs: VWMA/SMA) exceeds a certain threshold based on standard deviation and the Z-score coefficient, it may indicate increased market volatility or potential trading opportunities.
Calculation of MA Delta:
The indicator calculates the MA delta by subtracting a simple moving average (SMA) from a volume-weighted moving average (VWMA) of a selected price source. This calculation represents the difference in the market's short-term and long-term trends.
Statistical Analysis:
To detect anomalies, the indicator performs statistical analysis on the MA delta. It calculates a moving average (MA) of the MA delta and its standard deviation over a specified sample size. This MA acts as a baseline, and the standard deviation is used to measure how much the MA delta deviates from the mean.
Delta Normalization:
The MA delta, lower filter, and upper filter are normalized using a function that scales them to a specific range, typically from -100 to 100. Normalization helps in comparing these values on a consistent scale and enhances their visual representation.
Visual Representation:
The indicator visualizes the results through histograms and channels:
The histogram bars represent the normalized MA delta. Red bars indicate negative and below-lower-filter values, green bars indicate positive and above-upper-filter values, and silver bars indicate values within the normal range.
It also displays a Z-score channel, which represents the upper and lower filters after normalization. This channel helps traders identify price levels that are statistically significant and potentially indicative of market volatility.
In summary, the "MA Delta Volatility (Statistical Anomaly Detector)" indicator aims to help traders identify abnormal price movements in the market by analyzing the difference between two moving averages and applying statistical measures. It can be a valuable tool for traders looking to spot potential opportunities during periods of increased volatility or to identify potential market anomalies.