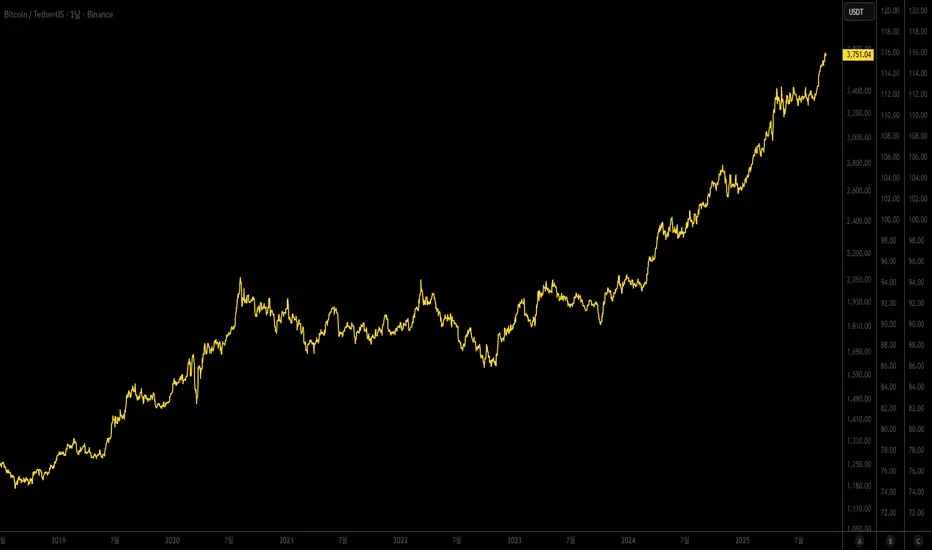
Gold Lagging (N days)This indicator overlays the price of gold (XAUUSD) on any chart with a customizable lag in days. You can choose the price source (open, high, low, close, hlc3, ohlc4), shift the series by a set number of daily bars, and optionally normalize the values so that the first visible bar equals 100. The original gold line can also be displayed alongside the lagged series for direct comparison.
It is especially useful for analyzing delayed correlations between gold and other assets, observing shifts in safe-haven demand, or testing hypotheses about lagging market reactions. Since the lag is calculated on daily data, it remains consistent even if applied on intraday charts, while the indicator itself can be plotted on a separate price scale for clarity.
이 지표는 금(XAUUSD) 가격을 원하는 차트 위에 N일 지연된 형태로 표시합니다. 가격 소스(시가, 고가, 저가, 종가, hlc3, ohlc4)를 선택할 수 있으며, 지정한 일 수만큼 시리즈를 뒤로 이동시킬 수 있습니다. 또한 첫 값 기준으로 100에 맞춰 정규화하거나, 원래 금 가격선을 함께 표시해 비교할 수도 있습니다.
금과 다른 자산 간의 지연 상관관계를 분석하거나 안전자산 수요 변화를 관찰할 때 유용하며, 시장 반응의 시차 효과를 검증하는 데에도 활용할 수 있습니다. 지연은 일봉 데이터 기준으로 계산되므로 단기 차트에 적용해도 일 단위 기준이 유지되며, 별도의 가격 스케일에 표시되어 가독성을 높일 수 있습니다.
Statistics
Morning Peak FadeMorning Peak Fade is an intraday analysis tool that identifies and measures the probability of early session rallies turning into sharp pullbacks.
📊 Core Idea
• Many stocks surge after the open, reaching an intraday peak before fading lower.
• This script anchors at the first significant morning high and tracks the drawdowns that follow within a customizable time window.
• It provides:
• Probability of a fade after the peak
• Average and maximum drawdown statistics
• Event-day hit rate (how often such setups occur)
🎯 Use Cases
• Spot potential “fade setups” where early enthusiasm exhausts quickly.
• Quantify how often chasing the morning high turns into a losing trade.
• Backtest opening range failure or fade strategies with hard data.
⚙️ Features
• Customizable thresholds for the initial surge (relative to prior close).
• Marks the peak (max) and subsequent low (min) used in calculations.
• Draws a reference line at the surge threshold to visualize when the fade triggers.
• Outputs summary stats directly on the chart.

Premarket Power MovePremarket Power Move is an intraday research tool that tracks what happens after strong premarket or opening gaps.
📊 Core Idea
• When a stock opens +X% above the prior close, it often attracts momentum traders.
• This script measures whether the stock continues to follow through higher or instead fades back down within the first trading hour.
• It calculates:
• The probability of a post-gap rally vs. a drawdown
• Average and maximum retracements after the surge
• Event-day hit rate (how many days actually triggered the condition)
🎯 Use Cases
• Identify “gap-and-go” opportunities where strong premarket strength leads to further gains.
• Spot potential fade setups where early enthusiasm quickly reverses.
• Backtest your intraday strategies with objective statistics instead of gut feeling.
⚙️ Features
• Customizable thresholds for premarket/open surge (%) and follow-through window (minutes).
• Marks the chart with reference lines:
• Prior close
• Surge threshold (e.g. +6%)
• Intraday high/low used for probability calculations.
• Outputs summary statistics (probabilities, averages, counts) directly on the chart.
🔔 Note
This is not a buy/sell signal generator. It is a probability and behavior analysis tool that helps traders understand how often strong premarket gaps continue vs. fade.

PongExperience PONG! The classic arcade game, now on your charts!
With this indicator, you can finally achieve your lifelong dream of beating the Markets. . . at PONG!
Pong is jam-packed with features! Such as:
2 Paddles
A moving dot
Floating numbers
The idea of a net
This indicator is solely a visualization, it serves simply as an exercise to depict what is capable through PineScript. It can be used to re-skin other indicators or data, but on its own, is not intended as a market indicator.
With that out of the way...
> PONG
The Pong indicator is a recreation of the classic arcade game Pong developed to pit the markets against the cold hard logic of a CPU player.
Given the lack of interaction that is capable, the game is not played in the typical sense, by a player and computer or 2 players.
This version of Pong uses the chart price movements to control the "Market" Paddle, and it is contrasted by a (not AI) "CPU" Paddle, which is controlled by its own set of logic.
> Market Paddle
The Market Paddle is controlled by a data source which can be input by the user.
By default (Auto Mode), the Market Paddle is controlled through a fixed length Donchian channel range, pinning the range high to 100 and range low to 0. As seen below.
This can be altered to use data from different symbols or indicators, and can optionally be smoothed using multiple types of Moving Averages.
In the chart below, you can see how the RSI indicator is imported and smoothed to control the Market Paddle.
Note: The Market Paddle follows the moving average. If not desired, simply set the "Smoothing" input to "NONE".
> CPU Paddle
In simple terms, the CPU Paddle is a handicapped Aimbot.
Its logic is, more or less, "move directly towards the ball's vertical location".
If it were allowed to have full range of the screen, it would be impossible for it to lose a point. Due to this, we must slow it down to "play fair"... as fair as that may be.
The CPU Paddle is allowed to move at a rate specified by a certain Percent of its vertical width. By default, this is set to 2%.
Each update, the CPU Paddle can advance up or down 2% of its vertical width. The directional movement is determined based on the angle of the ball, and it's current position relative to the CPU Paddle's position. Given that it is not a direct follow, it may at times seem more... "human".
When a point is scored, the CPU paddle maintains its position, similar to the original Pong game, the paddles were controlled solely by the raw output of the controllers and did not reset.
> Ball
At the start of each point, the ball begins at the center of the screen and moves in a randomly determined angle at its base speed.
The direction is determined by the player who scored the last point. The loser of the last point "serves" the ball.
Given the circumstances, serving is a gigantic advantage. So the loser serving is just another place where the Market is given an advantage.
The ball's base speed is 1, it will move 1 (horizontal) bar on each update of the script. This speed can "technically" increase to infinity over time, if given the perfect rally. This is due to the hit logic as described below.
Note: The minimum ball speed is also 1.
> Bonk Math
When the ball hits a paddle, essentially 3 outcomes can occur, each resulting in the ball's direction being changed from positive to negative.
Action A: Its angle is doubled, and its speed is doubled.
Action B: Its angle is reversed, and its speed is decreased if it is going faster than base speed.
Action C: Its angle is preserved, and its speed is preserved. "Basic Bounce"
Each paddle is segmented into 3 zones, with the higher and lower tips (20%) of the paddles producing special actions.
The central 60% of each paddle produces a basic bounce. The special actions are determined by the trajectory of the ball and location on the paddle.
> Custom Mode
As stated above, the script loads in "Auto Mode" by default. While this works fine to simply watch the gameplay, the Custom Mode unlocks the ability to visualize countless possibilities of indicators and analyses playing Pong!
In the chart below, we have set up the game to use the NYSE TICK Index as our Market Player. The NYSE TICK Index shows the number of NYSE stocks trading on an uptick minus those on a downtick. Its values fluctuate throughout the day, typically ranging between +1000 and -1000.
Therefore, we have set up Pong to use Ticker USI:TICK and set the Upper Boundary to 1000 and Lower Boundary to -1000. With this method, the paddle is directly controlled by the overall (NYSE) market behaviors.
As seen in a chart earlier, you can also take advantage of the Custom Mode to overlay Pong onto traditional oscillators for use anywhere!
> Styles
This version of Pong comes stocked with 5 colorways to suit your chart vibes!
> Pro Tips & Additional Information
- This game has sound! For the full experience, set alerts for this indicator and a notification sound will play on each hit!*
*Due to server processing, the notification sounds are not precisely played at each hit. :(
- In auto mode, decreasing the length used will give an advantage to the market, as its actions become more sporadic over this window.
- The CPU logic system actually allows the market to have a "technical" edge, since the Market Paddle is not bound to any speed, and is solely controlled by the raw market movements/data input.
- This type of visualization only works on live charts, charts without updates will not see any movement.
- Indicator sources can only be imported from other indicators on the same chart.
- The base screen resolution is 159 bars wide, with the height determined by the boundaries.
- When using a symbol and an outside source, be mindful that the script is attempting to pull the source from the input symbol. Data can appear wonky when not considering the interactions of these inputs.
There are many small interesting details that can't be seen through the description. For example, the mid-line is made from a box. This is because a line object would not appear on top of the box used for the screen. For those keen eye'd coders, feel free to poke around in the source code to make the game truly custom.
Just remember:
The market may never be fair, but now at least it can play Pong!
Enjoy!


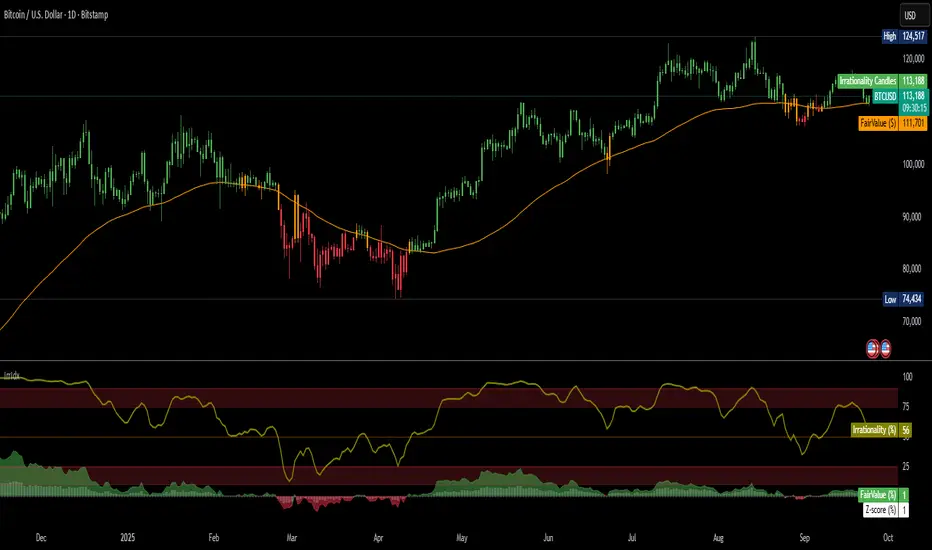
Irrationality Index by CRYPTO_ADA_BTC"The market can be irrational longer than you can stay solvent" ~ John Maynard Keynes
This indicator, the Irrationality Index, measures how far the current market price has deviated from a smoothed estimate of its "fair value," normalized for recent volatility. It provides traders with a visual sense of when the market may be behaving irrationally, without giving direct buy or sell signals.
How it works:
1. Fair Value Calculation
The indicator estimates a "fair value" for the asset using a combination of a long-term EMA (exponential moving average) and a linear regression trend over a configurable period. This fair value serves as a smoothed baseline for price, balancing trend-following and mean-reversion.
2. Volatility-Adjusted Z-Score
The deviation between price and fair value is measured in standard deviations of recent log returns:
Z = (log(price) - log(fairValue)) / volatility
This standardization accounts for different volatility environments, allowing comparison across assets.
3. Irrationality Score (0–100)
The Z-score is transformed using a logistic mapping into a 0–100 scale:
- 50 → price near fair value (rational zone)
- >75 → high irrationality, price stretched above fair value
- >90 → extreme irrationality, unsustainable extremes
- <25 → high irrationality, price stretched below fair value
- <10 → extreme bearish irrationality
4. Price vs Fair Value (% deviation)
The indicator plots the percentage difference between price and fair value:
pctDiff = (price - fairValue) / fairValue * 100
- Positive values → Percentage above fair value (optimistic / overvalued)
- Negative values → Percentage below fair value (pessimistic / undervalued)
Visuals:
- Irrationality (%) Line (0–100) shows irrationality level.
- Background Colors: Yellow= high bullish irrationality, Green= extreme bullish irrationality, Orange= high bearish irrationality, Red= extreme bearish irrationality.
- Price - FairValue (%) plot: price deviation vs fair value (%), Colored green above 0 and red below 0.
- Label: display actual price, estimated fair value, and Z-score for the latest bar.
- Alerts: configurable thresholds for high and extreme irrationality.
How to read it:
- 50 → Market trading near fair value.
- >75 / >90 → Price may be irrationally high; risk of pullback increases.
- <25 / <10 → Price may be irrationally low; potential rebound zones, but trends can continue.
- Price - FairValue (%) plot → visual guide for % price stretch relative to fair value.
Notes / Warnings:
- Measures relative deviation, not fundamental value!
- High irrationality scores do not automatically indicate trades; markets can remain can be irrational longer than you can stay solvent .
- Best used with other tools: momentum, volume, divergence, and multi-timeframe analysis.
Volume ClusteringThis Volume Clustering script is a powerful tool for analyzing intraday trading dynamics by combining two key metrics: volume Z-Score and Cumulative Volume Delta (CVD). By categorizing market activity into distinct clusters, it helps you identify high-conviction trading opportunities and understand underlying market pressure.
How It Works
The script operates on a simple, yet effective, premise: it classifies each trading bar based on its statistical significance (volume Z-Score) and buying/selling pressure (CVD).
Volume Z-Score
The volume Z-Score measures how far the current bar's volume is from its average, helping to identify periods of unusually high or low volume. This metric is a powerful way to spot when institutional or large players might be entering the market. A high Z-Score suggests a significant event is taking place, regardless of direction.
Cumulative Volume Delta (CVD)
CVD tracks the net buying and selling pressure across different timeframes. The script uses a lower timeframe (e.g., 1-minute) and anchors it to a higher timeframe (e.g., 1-day) to capture intraday pressure. A positive CVD indicates more buying pressure, while a negative CVD suggests more selling pressure.
Cluster Categories
The script analyzes the confluence of these two metrics to assign a cluster to each bar, providing actionable insights. The clusters are color-coded and labeled to make them easy to interpret:
🟢 High Conviction Bullish: Unusually high volume (high Z-Score) combined with significant buying pressure (high CVD). This cluster suggests strong bullish momentum.
🔴 High Conviction Bearish: Unusually high volume (high Z-Score) coupled with significant selling pressure (low CVD). This cluster suggests strong bearish momentum.
🟡 Low Conviction/Noise: Low to moderate volume and mixed buying/selling pressure. This represents periods of indecision or consolidation, where market noise is more prevalent.
🟣 Other Clusters: The script also identifies other combinations, such as high volume with moderate CVD, or low volume with high CVD, which can provide additional context for understanding market dynamics.
Key Features & Customization
The script offers several customizable settings to tailor the analysis to your specific trading style:
Z-Score Lookback Length: Adjust the lookback period for calculating the average volume. A shorter period focuses on recent volume trends, while a longer period provides a broader context.
CVD Anchor & Lower Timeframe: Define the timeframes used for CVD calculation. You can anchor the analysis to a daily or weekly timeframe while using a lower timeframe (e.g., 1-minute) to capture granular intraday pressure.
High/Low Volume Mode: Toggle between "High Volume" mode (which uses 90th and 10th percentiles for clustering) and "Low Volume" mode (which uses 75th and 25th percentiles). This allows you to choose whether to focus on extreme events or more subtle shifts in market sentiment.

Combined Cluster & Market StructureI barrowed code from the Mxwll Price Action Suite script as appreciated the structure in which the script defined structure, however I renamed variables and reduced the original script to define only the outer structure. I added volume and CVD clustering to define ranges and initiation market structures and add the ADX to assist with determining trend strength prior to labeling market structure breaks.
Combined Cluster & Market Structure indicator, a powerful and comprehensive tool for technical analysis. This script integrates two core concepts to provide a holistic view of market dynamics:
Z-Score Clustering & Volume Analysis: The indicator calculates Z-scores for both volume and Cumulative Volume Delta (CVD) to categorize market activity into six distinct clusters:
High-Conviction Bullish/Bearish: Signals of strong directional momentum based on high volume and corresponding CVD.
Effort vs. Result: High volume with moderate CVD, suggesting potential indecision or absorption.
Quiet Accumulation/Distribution: Low-volume periods with strong CVD, often preceding major moves.
Low Conviction/Noise: Represents periods of low market participation and weak signals.
These clusters are visually marked on the chart to provide real-time insight into market sentiment.
Market Structure Mapping: The indicator automatically detects and labels significant structural points to help you navigate price action. It identifies:
Higher Highs (HH) and Lower Lows (LL) to show the primary trend direction.
Breaks of Structure (BoS), indicating trend continuation.
Changes of Character (CHoCH), signaling a potential trend reversal.
Additionally, the script features consolidation box detection, which automatically highlights periods of low-conviction market activity, helping you avoid choppy, sideways markets. An integrated ADX filter ensures that structural breaks are only labeled during periods of strong trend strength, reducing false signals.
I want to thank Mxwll Capital for their contribution to the Combined Cluster & Market Structure indicator.

Pairs Trading Scanner [BackQuant]Pairs Trading Scanner
What it is
This scanner analyzes the relationship between your chart symbol and a chosen pair symbol in real time. It builds a normalized “spread” between them, tracks how tightly they move together (correlation), converts the spread into a Z-Score (how far from typical it is), and then prints clear LONG / SHORT / EXIT prompts plus an at-a-glance dashboard with the numbers that matter.
Why pairs at all?
Markets co-move. When two assets are statistically related, their relationship (the spread) tends to oscillate around a mean.
Pairs trading doesn’t require calling overall market direction you trade the relative mispricing between two instruments.
This scanner gives you a robust, visual way to find those dislocations, size their significance, and structure the trade.
How it works (plain English)
Step 1 Pick a partner: Select the Pair Symbol to compare against your chart symbol. The tool fetches synchronized prices for both.
Step 2 Build a spread: Choose a Spread Method that defines “relative value” (e.g., Log Spread, Price Ratio, Return Difference, Price Difference). Each lens highlights a different flavor of divergence.
Step 3 Validate relationship: A rolling Correlation checks if the pair is moving together enough to be tradable. If correlation is weak, the scanner stands down.
Step 4 Standardize & score: The spread is normalized (mean & variability over a lookback) to form a Z-Score . Large absolute Z means “stretched,” small means “near fair.”
Step 5 Signals: When the Z-Score crosses user-defined thresholds with sufficient correlation , entries print:
LONG = long chart symbol / short pair symbol,
SHORT = short chart symbol / long pair symbol,
EXIT = mean reversion into the exit zone or correlation failure.
Core concepts (the three pillars)
Spread Method Your definition of “distance” between the two series.
Guidance:
Log Spread: Focuses on proportional differences; robust when prices live on different scales.
Price Ratio: Classic relative value; good when you care about “X per Y.”
Return Difference: Emphasizes recent performance gaps; nimble for momentum-to-mean plays.
Price Difference: Straight subtraction; intuitive for similar-scale assets (e.g., two ETFs).
Correlation A rolling score of co-movement. The scanner requires it to be above your Min Correlation before acting, so you’re not trading random divergence.
Z-Score “How abnormal is today’s spread?” Positive = chart richer than pair; negative = cheaper. Thresholds define entries/exits with transparent, statistical context.
What you’ll see on the chart
Correlation plot (blue line) with a dashed Min Correlation guide. Above the line = green zone for signals; below = hands off.
Z-Score plot (white line) with colored, dashed Entry bands and dotted Exit bands. Zero line for mean.
Normalized spread (yellow) for a quick “shape read” of recent divergence swings.
Signal markers :
LONG (green label) when Z < –Entry and corr OK,
SHORT (red label) when Z > +Entry and corr OK,
EXIT (gray label) when Z returns inside the Exit band or correlation drops below the floor.
Background tint for active state (faint green for long-spread stance, faint red for short-spread stance).
The two built-in dashboards
Statistics Table (top-right)
Pair Symbol Your chosen partner.
Correlation Live value vs. your minimum.
Z-Score How stretched the spread is now.
Current / Pair Prices Real-time anchors.
Signal State NEUTRAL / LONG / SHORT.
Price Ratio Context for ratio-style setups.
Analysis Table (bottom-right)
Avg Correlation Typical co-movement level over your window.
Max |Z| The recent extremes of dislocation.
Spread Volatility How “lively” the spread has been.
Trade Signal A human-readable prompt (e.g., “LONG A / SHORT B” or “NO TRADE” / “LOW CORRELATION”).
Risk Level LOW / MEDIUM / HIGH based on current stretch (absolute Z).
Signals logic (plain English)
Entry (LONG): The spread is unusually negative (chart cheaper vs pair) and correlation is healthy. Expect mean reversion upward in the spread: long chart, short pair.
Entry (SHORT): The spread is unusually positive (chart richer vs pair) and correlation is healthy. Expect mean reversion downward in the spread: short chart, long pair.
Exit: The spread relaxes back toward normal (inside your exit band), or correlation deteriorates (relationship no longer trusted).
A quick, repeatable workflow
1) Choose your pair in context (same sector/theme or known macro link). Think: “Do these two plausibly co-move?”
2) Pick a spread lens that matches your narrative (ratio for relative value, returns for short-term performance gaps, etc.).
3) Confirm correlation is above your floor no corr, no trade.
4) Wait for a stretch (Z beyond Entry band) and a printed LONG / SHORT .
5) Manage to the mean (EXIT band) or correlation failure; let the scanners’ state/labels keep you honest.
Settings that matter (and why)
Spread Method Defines the “mispricing” you care about.
Correlation Period Longer = steadier regime read, shorter = snappier to regime change.
Z-Score Period The window that defines “normal” for the spread; it sets the yardstick.
Use Percentage Returns Normalizes series when using return-based logic; keep on for mixed-scale assets.
Entry / Exit Thresholds Set your stretch and your target reversion zone. Wider entries = rarer but stronger signals.
Minimum Correlation The gatekeeper. Raising it favors quality over quantity.
Choosing pairs (practical cheat sheet)
Same family: two index ETFs, two oil-linked names, two gold miners, two L1 tokens.
Hedge & proxy: stock vs. sector ETF, BTC vs. BTC index, WTI vs. energy ETF.
Cross-venue or cross-listing: instruments that are functionally the same exposure but price differently intraday.
Reading the cues like a pro
Divergence shape: The yellow normalized spread helps you see rhythm fast spike and snap-back versus slow grind.
Corr-first discipline: Don’t fight the “Min Correlation” line. Good pairs trading starts with a relationship you can trust.
Exit humility: When Z re-centers, let the EXIT do its job. The edge is the journey to the mean, not overstaying it.
Frequently asked (quick answers)
“Long/Short means what exactly?”
LONG = long the chart symbol and short the pair symbol.
SHORT = short the chart symbol and long the pair symbol.
“Do I need same price scales?” No. The spread methods normalize in different ways; choose the one that fits your use case (log/ratio are great for mixed scales).
“What if correlation falls mid-trade?” The scanner will neutralize the state and print EXIT . Relationship first; trade second.
Field notes & patterns
Snap-back days: After a one-sided session, return-difference spreads often flag cleaner intraday mean reversions.
Macro rotations: Ratio spreads shine during sector re-weights (e.g., value vs. growth ETFs); look for steady corr + elevated |Z|.
Event bleed-through: If one symbol reacts to news and its partner lags, Z often flags a high-quality, short-horizon re-centering.
Display controls at a glance
Show Statistics Table Live state & key numbers, top-right.
Show Analysis Table Context/risk read, bottom-right.
Show Correlation / Spread / Z-Score Toggle the sub-charts you want visible.
Show Entry/Exit Signals Turn markers on/off as needed.
Coloring Adjust Long/Short/Neutral and correlation line colors to match your theme.
Alerts (ready to route to your workflow)
Pairs Long Entry Z falls through the long threshold with correlation above minimum.
Pairs Short Entry Z rises through the short threshold with correlation above minimum.
Pairs Trade Exit Z returns to neutral or the relationship fails your correlation floor.
Correlation Breakdown Rolling correlation crosses your minimum; relationship caution.
Final notes
The scanner is designed to keep you systematic: require relationship (correlation), quantify dislocation (Z-Score), act when stretched, stand down when it normalizes or the relationship degrades. It’s a full, visual loop for relative-value trading that stays out of your way when it should and gets loud only when the numbers line up.

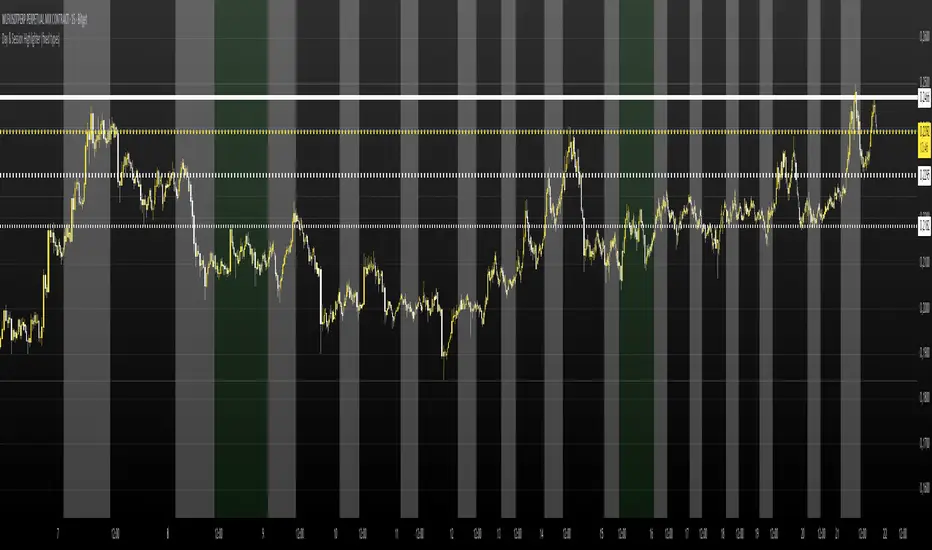
FRANJAS POR FECHAS - RSDescription:
This indicator allows you to highlight specific dates on your chart with vertical background stripes, similar to a session indicator.
Input your dates in the format DD.MM.YYYY (you can separate them with commas, spaces, line breaks, or semicolons).
The script automatically normalizes the format and applies a shaded vertical band for each matching day.
Works on daily and intraday charts: in intraday, the shading will cover the full trading day.
Options available to adjust the color and transparency of the stripes.
Optional dotted lines can be enabled at the start and end of each highlighted day.
This is useful for marking important events such as FOMC meetings, earnings releases, economic data announcements, or any custom list of key dates you want to track directly on your chart.

Japan Yen Carry Trade to Risk Ratio Sharpe Ratio By UncleBFMStep-by-Step Calculation in the ScriptFetch Rates:Pulls rates dynamically using request.security() from user-specified symbols (e.g., TVC:JP10Y for yen, TVC:US10Y for target). If unavailable (NA), uses fallback inputs (e.g., 0.25% for yen, 4.50% for target).
Converts rates to decimals: (target_rate - yen_rate) / 100.
Calculate Carry:Carry = (Target Rate - Yen Rate) / 100
Example: If US 10Y yield is 4.50% and Japan 10Y is 0.25%, carry = (4.50 - 0.25) / 100 = 0.0425 (4.25% annual yield).
Calculate Daily Log Returns:Log Returns = ln(Close / Close ), where Close is the current price of the pair (e.g., USDJPY) and Close is the previous day's price.
This measures daily percentage changes in a way suitable for volatility calculations.
Calculate Annualized Volatility:Volatility = Standard Deviation of Log Returns over a lookback period (default 63 days, ~3 months) × √252.
Example: If the standard deviation of USDJPY log returns is 0.005 (0.5% daily), annualized volatility = 0.005 × √252 ≈ 0.0794 (7.94%).
Compute the Ratio:Ratio = Carry / Volatility
Example: Using above, 0.0425 / 0.0794 ≈ 0.535.
If volatility is zero, the ratio is set to NA to avoid division errors.
Plot:Plots the ratio as a line, with optional thresholds (e.g., 0.2 for "high attractiveness") to guide interpretation.
NotesDynamic Rates: Using bond yields (e.g., TVC:JP10Y) or policy rates (e.g., ECONOMICS:JPINTR) makes the indicator responsive to historical and current rate changes, unlike static inputs.
Context: BIS reports use similar ratios to assess carry trade viability. For USDJPY in 2025, with Fed rates around 4.5% and BoJ at 0.25–0.5%, the carry is positive but sensitive to volatility spikes (e.g., during 2024 unwind events).
Usage: Apply to a yen pair chart (e.g., USDJPY, AUDJPY). Adjust symbols for the target currency (e.g., TVC:AU10Y for AUD). The ratio helps compare carry trade profitability across pairs or over time.

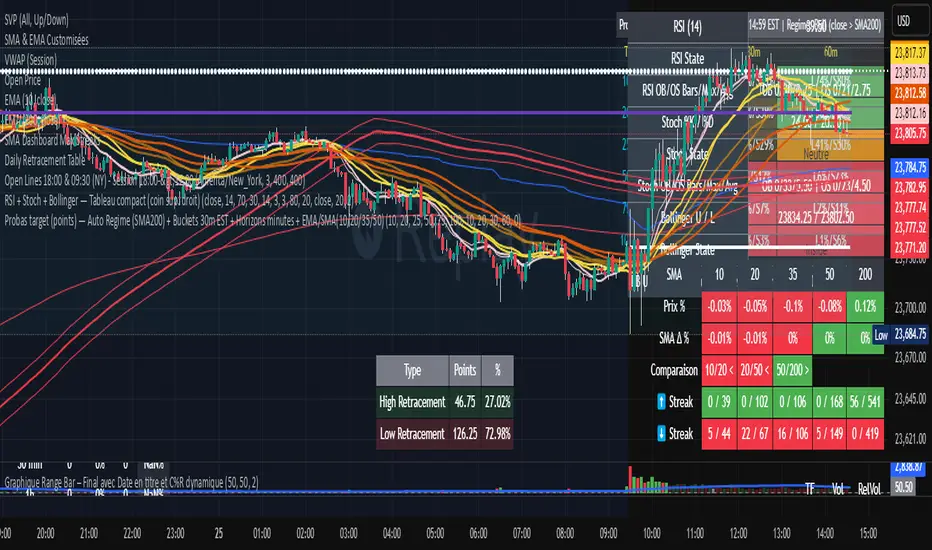
Shashwat Khurana (v6) – VWAP ±1SD + RSI + ATR Filter A multi-factor volatility-adjusted mean-reversion model integrating dynamic liquidity thresholds and higher-order momentum filters for asymmetric risk calibration

Probas target and touching (points)Probability of Touching Long or Short X nb of point in 10 mins, 20 mins, 30 mins, 60 mins

Дни недели и торговые сесииIndicator for visual analysis by trading sessions and days.
Индикатор для наглядного анализа по торговым сесиям и дням.
Dynamic Stop Loss Optimizer [BackQuant]Dynamic Stop Loss Optimizer
Overview
Stop placement decides expectancy. This tool gives you three professional-grade, adaptive stop engines, ATR, Volatility, and Hybrid. So your exits scale with current conditions instead of guessing fixed ticks. It trails intelligently, redraws as the market evolves, and annotates the chart with clean labels/lines and a compact stats table. Pick the engine that fits the trade, or switch on the fly.
What it does
Calculates three adaptive stops in real time (ATR-based, Volatility-based, and Hybrid) and keeps them trailed as price makes progress.
Shows exactly where your risk lives with on-chart levels, color-coded markers (long/short), and precise “Risk %” labels at the current bar.
Surfaces context you actually use - current ATR, daily volatility, selected method, and the live stop level—in a tidy, movable table.
Fires alerts on stop hits so you can automate exits or journal outcomes without staring at the screen.
Why it matters
Adaptive risk control: Stops expand in fast tape and tighten in quiet tape. You’re not punished for volatility; you’re aligned with it.
Consistency across assets: The same playbook works whether you’re trading indexes, FX, crypto, or equities, because the engine normalizes to each symbol’s behavior.
Cleaner decision-making: One chart shows your entry idea and its invalidation in the same breath. If price trespasses, you know it instantly.
The three methods (choose your engine)
1) ATR Based “Structure-aware” distance
This classic approach keys off Average True Range to set a stop just beyond typical bar-to-bar excursion. It adapts smoothly to changing ranges and respects swing structure.
Use when: you want a steady, intuitive buffer that tracks trend legs without hugging price.
See it in action:
2) Volatility Based “Behavior-aware” distance
This engine derives stop distance from current return volatility (annualized, then scaled back down to the session). It reacts to regime shifts quickly and normalizes risk across symbols with very different prices.
Use when: you want the stop to breathe with realized volatility and respond faster to heat-ups/cool-downs.
See it in action:
3) Hybrid “Best of both worlds”
The Hybrid blends the ATR and Volatility distances into one consensus level, then trails it intelligently. You get the structural common sense of ATR and the regime sensitivity of Vol.
Use when: you want robust, all-weather behavior without micromanaging inputs.
See it in action:
How it trails
Longs: The stop ratchets up with favorable movement and holds its ground on shallow pullbacks. If price closes back into the risk zone, the level refreshes to the newest valid distance.
Shorts: Mirror logic ratchets down with trend, resists noise, and refreshes if price reclaims the zone.
Hybrid trailing: Uses the blended distance and the same “no give-backs” principle to keep gains protected as structure builds.
Reading the chart
Markers: Circles = ATR stops, Crosses = Vol stops, Diamonds = Hybrid. Colors indicate long (red level under price) vs short (green level above price).
Lines: The latest active stop is extended with a dashed line so you can see it at a glance.
Labels: “Long SL / Short SL” shows the exact price and current risk % from the last close no math required.
Table: ATR value, Daily Vol %, your chosen Method, the Current SL, and Risk %—all in one compact block that you can pin top-left/right/center.
Quick workflow
Define the idea: Long or Short, and which engine fits the tape (ATR, Vol, or Hybrid).
Place and trail: Let the optimizer print the level; trail automatically as the move develops.
Manage outcomes: If the line is tagged, you’re out clean. If it holds, you’ve contained heat while giving the trade room to work.
Inputs you’ll actually touch
Calculation Settings
ATR Length / Multiplier: Controls the “structural” cushion.
Volatility Length / Multiplier: Controls the “behavioral” cushion.
Trading Days: 252 or 365 to keep the volatility math aligned with the asset’s trading calendar.
Stop Loss Method
ATR Based | Volatility Based | Hybrid : Switch engines instantly to fit the trade.
Position Type
Long | Short | Both : Show only what you need for the current strategy.
Visual Settings
Show ATR / Vol / Hybrid Stops: Toggle families on/off.
Show Labels: Print price + Risk % at the live stop.
Table Position: Park the metrics where you like.
Coloring
Long/Short/Hybrid colors: Set a palette that matches your theme and stands out on your background.
Practical patterns to watch
Trend-pullback continuation: The stop ratchets behind higher lows (long) or lower highs (short). If price tests the level and rejects, that’s your risk-defined continuation cue.
Break-and-run: After a clean break, the Hybrid will usually sit slightly wider than pure Vol, use it to avoid getting shaken on the first retest.
Range compression: When the ATR and Vol distances converge, the table will show small Risk %. That’s your green light to size up with the same dollar risk, or keep it conservative if you expect expansion.
Alerts
Long Stop Loss Hit : Notifies when price crosses below the live long stop.
Short Stop Loss Hit : Notifies when price crosses above the live short stop.
Why this feels “set-and-serious”
You get a single look that answers three questions in real time: “Where’s my line in the sand?”, “How much heat am I taking right now?”, and “Is this distance appropriate for current conditions?” With ATR, Vol, and Hybrid in one tool, you can run the exact same playbook across symbols and regimes while keeping your chart clean and your risk explicit.

RSI + Stoch + Bollinger — Tableau compact (coin sup. droit)RSI + Stoch + Bollinger — Tableau compact (coin sup. droit)

DashBoard 2.3.1📌 Indicator Name:
DashBoard 2.3 – Smart Visual Market Overlay
📋 Description:
DashBoard 2.3 is a clean, efficient, and highly informative market overlay, designed to give you real-time context directly on your chart — without distractions. Whether you're swing trading or investing long-term, this tool keeps critical market data at your fingertips.
🔍 Key Features:
Symbol + Timeframe + Market Cap
Shows the current ticker and timeframe, optionally with real-time market cap.
ATR 14 with Volatility Signal
Displays ATR with color-coded risk levels:
🟢 Low
🟡 Moderate
🔴 High
⚫️ Extreme
You can choose between Daily ATR or timeframe-based ATR (auto-adjusted to chart resolution).
Adaptive Labeling
The ATR label updates to reflect the resolution:
ATR 14d (daily)
ATR 14W (weekly)
ATR 14H (hourly), etc.
Moving Average Tracker
Instantly shows whether price is above or below your selected moving average (e.g., 150 MA), with green/red indication.
Earnings Countdown
Clearly shows how many days remain until the next earnings report.
Industry & Sector Info (optional)
Useful for thematic or sector-based trading strategies.
Fully Customizable UI
Choose positioning, padding, font size, and which data to show. Designed for minimalism and clarity.
✅ Smart Logic:
Color dots appear only in relevant conditions (e.g., ATR color signals shown only on daily when enabled).
ATR display automatically reflects your time frame, if selected.
Clean chart integration – the overlay sits quietly in a corner, enhancing your analysis without intruding.
🧠 Ideal for:
Swing traders, position traders, and investors who want fast, high-impact insights directly from the chart.
Anyone looking for a compact, beautiful, and informative dashboard while they trade.

Avg Candle Size (Ticks) – Last 9 Closed BarsWhat it does:
Shows the average candle size in ticks for the last N closed bars (defaults to 9). I built this so I can glance at a 5-min chart and instantly know the typical bar size in ticks, updating only after each bar closes (no intrabar wiggle).
How it works:
Measures each bar’s full range (High–Low), not ATR and not candle body.
Averages the last N closed bars, converts to ticks using syminfo.mintick.
Displays a simple line plus a small readout (e.g., “32 ticks”).
Why I built it:
Gives me a realistic sense of current volatility in ticks so I can size stops/targets quickly without doing mental math.
Extras:
Lookback is configurable (default 9).
Optional rounding (floor/nearest/ceil).
Works on any timeframe/instrument that has a defined tick size.
If you want it to match ATR exactly (in ticks), swap the range calc for ta.atr(len) / syminfo.mintick
Flux Power Dashboard (Updated and Renamed)Flux Power Dashboard is a compact market-state heads-up display for TradingView. It blends trend, momentum, and volume-flow into a single on-chart panel with color-coded cues and minimal lag. You get:
Clean visual trend via fast/slow MA with slope/debounce filters
MACD state and most recent cross (with “freshness” tint)
OBV confirmation and gating to reduce noise
Session awareness (Asia/London/New York + pre-sessions + overlap)
Optional HTF Regime row and regime gate to align signals to higher-timeframe bias
Context from VIX/VXN (volatility regime)
A single Flux Score (0–100) as a top-level read
It is deliberately “dashboard-first”: fast to read, consistent between symbols/timeframes, and designed to limit overtrading in chop.
What it can do (capabilities)
Signal gating: You can require multiple pillars to agree (Trend, MACD, OBV) before a “strong” bias is shown.
Debounced trend: Uses slope + confirmation bars to avoid flip-flopping.
Session presets: Auto-adjust the minimum confirmation bars by session (e.g., NY vs London vs Asia) to better match liquidity/volatility.
MACD presets: Quick switch between Scalp / Classic / Slow or roll your own custom speeds.
OBV confirmation: Volume flow must agree for trend/entries to “count” (optional).
HTF Regime awareness: Shows the higher-timeframe backdrop and (optionally) gates signals so you don’t fight the dominant trend.
Volatility context: VIX/VXN auto-colored cells based on your thresholds.
Top-center Session Title: Broadcasts the active session (or Overlap) with a matched background color.
Customizable UI: Column fonts, params font, transparency, dashboard corner, marker styles, colors, widths—tune it to your chart.
Practical use: Start with Flux Score + Summary for a snapshot, confirm with Trend & MACD, check OBV agreement (implicit in signal strength), glance at Regime to avoid counter-trend trades, and use Session + VIX/VXN for timing and risk context.
How it avoids common pitfalls
Repaint-aware: “Confirm on Close” can be enabled to read prior bar states, reducing intrabar noise.
Auto MA sanity: If fast ≥ slow length, it auto-swaps under the hood to keep calculations valid.
Debounce & confirm: Trend flips only after X bars satisfy conditions, cutting false flips in chop.
Freshness tint: New Cross/Signal rows tint slightly brighter for a few bars, so you can spot recency at a glance.
Every line of the dashboard (what it shows, how it’s colored)
Flux Score
What: Composite 0–100 built from three pillars: Trend (40%), MACD (30%), OBV (30%).
Read: ≥70 Bullish, ≤30 Bearish, else Neutral.
Use: Quick “state of play” gauge—stronger alignment pushes the score toward extremes.
Regime (optional row)
What: Higher-timeframe (your Regime TF) backdrop using the same MA pair with HTF slope/ATR buffer.
Values: Bull / Bear / Range.
Gate (optional): If Regime Gate is ON, Trend/Signals only go directional when HTF agrees.
Summary
What: One-line narrative combining the three pillars: MACD (up/down/flat), OBV (up/down/flat), Trend (up/down/flat).
Use: Human-readable cross-check; should rhyme with Flux Score.
Trend
What: Debounced MA relationship on the current chart.
Strict: needs fast > slow and slow rising (mirror for down) + slope debounce + confirmation bars.
Lenient: allows fast > slow or slow rising (mirror for down) with the same debounce/confirm.
Color: Green = UP, Red = DOWN, Gray = FLAT.
Use: Your structural bias on the trading timeframe.
MACD
What: Current MACD line vs signal, using your selected preset (or custom).
Values: Bull (line above), Bear (below), Flat (equal/indeterminate).
Color: Green/Red/Gray.
Cross
What: Most recent MACD cross and how many bars ago it occurred (e.g., “MACD XUP | 3 bars”).
Freshness: If the cross happened within Fresh Signal Tint bars, the cell brightens slightly.
Use: Timing helper for inflection points.
Signal
What: Latest directional shift (from short-bias to long-bias or vice versa) and age in bars.
Strength:
Strong = Trend + MACD + OBV all align
Weak = partial alignment (e.g., Trend + MACD, or Trend + OBV)
Color: Green for long bias, Red for short bias; fresh signals tint brighter.
Use: Action cue—treat Strong as higher quality; Weak as situational.
MA
What: Your slow MA type and length, plus slope direction (“up”/“down”).
Use: Context even when Trend is FLAT; slope often turns before full trend flips.
Session
What: Current market session by Eastern Time: New York / London / Asia, Pre- windows, Overlap, or Off-hours.
Logic: If ≥2 main sessions are active, shows Overlap (and grays the top title background).
Use: Timing and expectations for liquidity/volatility; also drives session-based confirmation presets if enabled.
VIX
What: Real-time CBOE:VIX on your chosen TF.
Auto-color (if on):
Calm (< Calm) → Green
Watch (< Watch) → Yellow
Elevated (< Elevated) → Orange
Very High (≥ Elevated) → Red
Use: Equity market–wide risk mood; higher = bigger moves, lower = quieter.
VXN
What: CBOE:VXN (Nasdaq volatility index) on your chosen TF.
Auto-color thresholds like VIX.
Use: Tech-heavy risk mood; helpful for growth/QQQ/NDX names.
Footer (params row, bottom-right)
What: Key live settings so you always know the context:
P= Trend Confirmation Bars
O= OBV Confirmation Bars
Strict/Lenient (trend mode)
MACD preset (or “Custom”)
swap if MA lengths were auto-swapped for validity
Regime gate if enabled
Candles for clarity
Use: Quick integrity check when comparing charts/screenshots or changing presets.
Recommended workflow
Start at Flux Score & Summary → snapshot of alignment.
Check Trend (color) and MACD (Bull/Bear).
Look at Signal (Strong vs Weak, and age).
Glance at Regime (and use gate if you’re trend-following).
Use Session + VIX/VXN to adjust expectations (breakout vs mean-revert, risk sizing, patience).
Keep Confirm on Close ON when you want stability; turn it OFF for faster (but noisier) reads.
Notes & limitations
Not advice: This is an informational tool; always combine with your own risk rules.
Repaint vs responsiveness: With “Confirm on Close” OFF you’ll see faster state changes but may get more churn intrabar.
Presets matter: Scalp MACD reacts fastest; Slow reduces whipsaw. Choose for your timeframe.
Session windows depend on the strings you set; adjust if your broker’s feed or DST handling needs tweaks.

Synthetic Point & Figure on RSIHere is a detailed description and user guide for the Synthetic Point & Figure RSI indicator, including how to use it for long and short trade considerations:
*
## Synthetic Point & Figure RSI Indicator – User Guide
### What It Is
This indicator applies classic Point & Figure (P&F) charting logic to the Relative Strength Index (RSI) instead of price. It transforms the RSI into synthetic “P&F candles” that filter out noise and highlight significant momentum moves and reversals based on configurable box size and reversal settings.
### How It Works
- The RSI is calculated normally over the selected length.
- The P&F engine tracks movements in the RSI above or below a defined “box size,” creating columns that switch direction only after a larger reversal.
- The synthetic candles connect these filtered RSI values visually, reducing false noise and emphasizing strong RSI trends.
- Optional EMA and SMA overlays on the synthetic P&F RSI allow smoother trend signals.
- Reference RSI levels at 33, 40, 50, 60, and 66 provide further context for momentum strength.
### How to Use for Trading
#### Long (Buy) Considerations
- The synthetic P&F RSI candle direction flips to *up (green candles)* indicating strength in momentum.
- Look for the RSI P&F value moving above the *40 or 50 level*, suggesting increasing bullish momentum.
- Confirmation is stronger if the synthetic RSI is above the EMA or SMA overlays.
- Ideal entries are after a reversal from a synthetic P&F downtrend (red candles) to an uptrend (green candles) near or above these levels.
#### Short (Sell) Considerations
- The candle direction flips to *down (red candles)*, showing weakening momentum or bearish reversal.
- Monitor if the synthetic RSI falls below the *60 or 50 level*, signaling momentum loss.
- Confirm bearish bias if the price is below the EMA or SMA overlays.
- Exit or short positions are signaled when the synthetic candle reverses from green to red near or below these threshold levels.
### Important RSI Levels to Watch
- *Level 33*: Lower bound indicating deep oversold conditions.
- *Level 40*: Early bullish zone suggesting momentum improvement.
- *Level 50*: Neutral midpoint; crossing above often signals bullish strength, below signals weakness.
- *Level 60*: Advanced bullish momentum; breaking below signals potential reversal.
- *Level 66*: Strong overbought area warning of possible pullback.
### Tips
- Use in conjunction with price action analysis and other volume/trend indicators for higher conviction.
- Adjust box size and reversal settings based on instrument volatility and timeframe for ideal filtering.
- The P&F RSI is best for identifying sustained momentum trends and avoiding false RSI whipsaws.
- Combine this indicator’s signals with stop-loss and risk management strategies.
*
This indicator converts RSI momentum analysis into a simplified, noise-filtered P&F chart format, helping traders better visualize and trade momentum shifts. It is especially useful when RSI signal noise can cause confusion in volatile markets.
Let me know if you want me to generate a shorter summary or code alerts based on these levels!
Sources
Relative Strength Index (RSI) — Indicators and Strategies in.tradingview.com
Indicators and strategies in.tradingview.com
Relative Strength Index (RSI) Indicator: Tutorial www.youtube.com
Stochastic RSI (STOCH RSI) in.tradingview.com
RSI Strategy docs.algotest.in
Stochastic RSI Indicator: Tutorial www.youtube.com
Relative Strength Index (RSI): What It Is, How It Works, and ... www.investopedia.com
rsi — Indicators and Strategies in.tradingview.com
Relative Strength Index (RSI) in.tradingview.com
Relative Strength Index (RSI) — Indicators and Strategies www.tradingview.com

Bar Statistics - DELTA/OI/TOTAL/BUY/SELL/LONGS/SHORTSBar Statistics - Advanced Volume & Open Interest Analysis
Overview
The Bar Statistics indicator is a comprehensive analytical tool designed to provide traders with detailed insights into market microstructure through advanced volume analysis, open interest tracking, and market flow detection. This indicator transforms complex market data into easily digestible visual information, displaying six key metrics in customizable colored boxes that update in real-time.
Unlike traditional volume indicators that only show basic volume data, this indicator combines multiple data sources to reveal the underlying forces driving price movement, including volume delta calculations from lower timeframes, open interest changes, and estimated market positioning.
What Makes This Indicator Unique
1. Multi-Timeframe Volume Delta Precision
The indicator utilizes lower timeframe data (default 1-second) to calculate highly accurate volume delta measurements, providing much more precise buy/sell pressure analysis than standard timeframe-based calculations. This approach captures intraday volume dynamics that are often missed by conventional indicators.
2. Real-Time Updates
Unlike many indicators that only update on bar completion, this tool provides live updates for the developing candle, allowing traders to see evolving market conditions as they happen.
3. Market Flow Analysis
The unique "L/S" (Long/Short) metric combines open interest changes with price/volume direction to estimate net market positioning, helping identify when participants are accumulating or distributing positions.
4. Adaptive Visual Intensity
The gradient color system automatically adjusts based on historical context, making it easy to identify when current values are significant relative to recent market activity.
5. Complete Customization
Every aspect of the display can be customized, from the order of metrics to individual color schemes, allowing traders to adapt the tool to their specific analysis needs.
6.All In One Solution
6 Metrics in one indicator no more using 5 different indicators.
Core Features Explained
DELTA (Volume Delta)
What it shows: Net difference between aggressive buy volume and aggressive sell volume
Calculation: Uses lower timeframe data to determine whether each trade was initiated by buyers or sellers
Interpretation:
Positive values indicate aggressive buying pressure
Negative values indicate aggressive selling pressure
Magnitude indicates the strength of directional pressure
OI Δ (Open Interest Change)
What it shows: Change in open interest from the previous bar
Data source: Fetches open interest data using the "_OI" symbol suffix
Interpretation:
Positive values indicate new positions entering the market
Negative values indicate positions being closed
Combined with price direction, reveals market participant behavior
L/S (Net Long/Short Bias)
What it shows: Estimated net change in long vs short market positions
Calculation method: Combines open interest changes with price/volume direction using configurable logic
Scenarios analyzed:
New Longs: Rising OI + Rising Price/Volume = Long position accumulation
Liquidated Longs: Falling OI + Falling Price/Volume = Long position exits
New Shorts: Rising OI + Falling Price/Volume = Short position accumulation
Covered Shorts: Falling OI + Rising Price/Volume = Short position exits
Result: Net bias toward long (positive) or short (negative) market sentiment
TOTAL (Total Volume)
What it shows: Standard volume for the current bar
Purpose: Provides context for other metrics and baseline activity measurement
Enhanced display: Uses gradient intensity based on recent volume history
BUY (Estimated Buy Volume)
What it shows: Estimated aggressive buy volume
Calculation: (Total Volume + Delta) / 2
Use case: Helps quantify the actual buying pressure in monetary/contract terms
SELL (Estimated Sell Volume)
What it shows: Estimated aggressive sell volume
Calculation: (Total Volume - Delta) / 2
Use case: Helps quantify the actual selling pressure in monetary/contract terms
Configuration Options
Timeframe Settings
Custom Timeframe Toggle: Enable/disable custom lower timeframe selection
Timeframe Selection: Choose the precision level for volume delta calculations
Auto-Selection Logic: Automatically selects optimal timeframe based on chart timeframe
Net Positions Calculation
Direction Method: Choose between Price-based or Volume Delta-based direction determination
Value Method: Select between Open Interest Change or Volume for position size calculations
Display Customization
Row Order: Completely customize which metrics appear and in what order (6 positions available)
Color Schemes: Individual color selection for positive/negative values of each metric
Gradient Intensity: Configurable lookback period (10-200 bars) for relative intensity calculations
Visual Elements
Box Format: Clean, professional box display with clear labels
Color Coding: Intuitive color schemes with customizable transparency gradients
Real-time Updates: Live updating for developing candles with historical stability
How to Use This Indicator
For Day Traders
Volume Confirmation: Use DELTA to confirm breakout validity - strong directional moves should show corresponding volume delta
Entry Timing: Watch for volume delta divergences at key levels to time entries
Exit Signals: Monitor when aggressive volume shifts against your position
For Swing Traders
Market Flow: Focus on the L/S metric to identify when participants are accumulating or distributing
Open Interest Analysis: Use OI Δ to confirm whether moves are backed by new money or position adjustments
Trend Validation: Combine multiple metrics to validate trend strength and sustainability
For Scalpers
Real-time Edge: Utilize the live updates to see developing imbalances before bar completion
Quick Decision Making: Focus on DELTA and BUY/SELL for immediate market pressure assessment
Volume Profile: Use TOTAL volume context for optimal entry/exit sizing
Setup Recommendations
Futures Markets: Enable OI tracking and use Volume Delta direction method
Crypto Markets: Focus on DELTA and volume metrics; OI may not be available
Stock Markets: Use Price direction method with volume value calculations
High-Frequency Analysis: Set lower timeframe to 1S for maximum precision
Technical Implementation
Data Accuracy
Utilizes TradingView's ta.requestVolumeDelta() function for precise buy/sell classification
Implements error checking for data availability
Handles missing data gracefully with fallback calculations
Performance Optimization
Efficient array management with configurable lookback periods
Smart box creation and deletion to prevent memory issues
Optimized real-time updates without historical data corruption
Compatibility
Works on all timeframes from seconds to daily
Compatible with futures, forex, crypto, and stock markets
Automatically adjusts calculation methods based on available data
Risk Disclaimers
This indicator is designed for educational and analytical purposes. It provides statistical analysis of market data but does not guarantee trading success. Users should:
Combine with other forms of analysis
Practice proper risk management
Understand that past performance doesn't predict future results
Be aware that volume delta and open interest data quality varies by market and data provider
Conclusion
The Bar Statistics indicator represents a significant advancement in retail trader access to professional-grade market analysis tools. By combining multiple data sources into a single, customizable display, it provides the depth of analysis needed for comprehensive market microstructure understanding while maintaining the simplicity required for effective decision-making.

