MP OSILADORESThis script uses a DMI, Stochastic , and one RSI , when they are all overbought or oversold (also applying price action and looking for bounce points) we can obtain a greater probability that the price will go in the direction we expect
This script is compact, which can be very useful for many traders
Default values
DMI:
Lenght=10
Stolenght=3
Stochastic:
K=5
D=1
Smooth=1
RSI:
Lenght=4
The indicators configured in this way can bring greater efficiency, do not confront only them, also use price action or other confirmat
They are arranged in a graph, such that the DMI has the oversold at 10 and the overbought at 90, the stochastic oversold at 120 and overbought at 180 and the RSI at oversold at 220 and overbought at 280, you can configure them your way taking into account that the DMI range is from 0-100, stochastic 100-200 and RSI 200-300.
Oscillateur Stochastique

Stochastic [SystemAlpha]This is a Stochastic Oscillator enhanced with:
- Show Buy and Sell Alert
- Show Regular and Hidden divergence
- Show Divergence Labels
- Generate Alerts: Buy/Sell and Divergence

TEC_MapHack_Main_Indicator_2_ver_2.0.0본 지표는 Stochastic Slow 지표입니다.
배경이 주황색이면 과매수구간을 나타내고, 배경이 하늘색이면 과매도구간을 나타냅니다.
This is a Stochastic Slow indicator.
An orange background indicates an overbought section, a sky blue background indicates an oversold section.

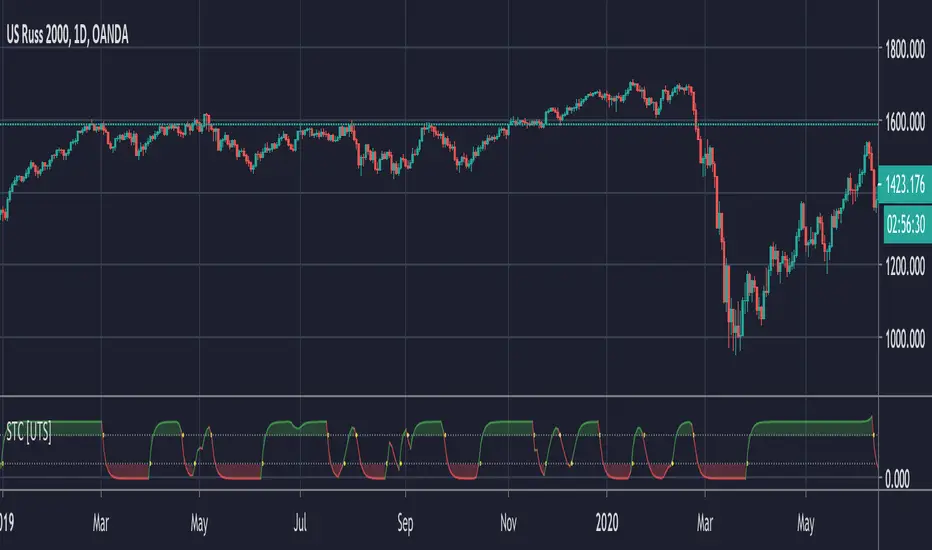
Uber STC - Schaff Trend Cycle [UTS]Desc:
The Schaff Trend Cycle (STC) is a charting indicator that is commonly used to identify market trends and provide
buy and sell signals to traders.
Developed in 1999 by noted currency trader Doug Schaff, STC is a type of oscillator and is based on the assumption that,
regardless of time frame, currency trends accelerate and decelerate in cyclical patterns.
This indicators source code is based on Releasing the Code to the Schaff Trend Cycle.pdf
Executive Summary
Schaff Trend Cycle is a charting indicator used to help spot buy and sell points in the markets.
Compared to the popular MACD indicator, STC will react faster to changing market conditions.
A drawback to STC is that it can stay in overbought or oversold territory for long stretches of time.
General Usage
There are two lines indicating overbought and oversold conditions, default at 75 and 25 which is customizable of course.
Signals are created on line crosses. They that can be used to enter LONG/SHORT or EXIT a trade.
If the STC crosses the lower line upwards a LONG signal is triggered and if it crosses the upper line a SHORT signal is triggered.
Line crosses in the other direction than the current trade also work as EXIT signal.
Alerts
Traders can easily use the reversal signal to trigger alerts from:
Cross Up
Cross Down
Those values are > zero if a condition is triggered.
Alert condition example: "Cross Up" - "Greater Than" - "0"
Moving Averages
16 different Moving Averages are available:
ALMA (Arnaud Legoux Moving Average)
DEMA (Double Exponential Moving Average)
EMA (Exponential Moving Average)
FRAMA (Fractal Adaptive Moving Average)
HMA (Hull Moving Average)
JURIK (Jurik Moving Average)
KAMA (Kaufman Adaptive Moving Average)
Kijun (Kijun-sen / Tenkan-sen of Ichimoku)
LSMA (Least Square Moving Average)
RMA (Running Moving Average)
SMA (Simple Moving Average)
SuperSmoothed (Super Smoothed Moving Average)
TEMA (Triple Exponential Moving Average)
VWMA (Volume Weighted Moving Average)
WMA (Weighted Moving Average)
ZLEMA (Zero Lag Moving Average)
A freely determinable length allows for sensitivity adjustments that fits your own requirements.
DMI-STOCHASTIC, STOCHASTIC AND RSIThis script uses a DMI, Stochastic , and one RSI , when they are all overbought or oversold (also applying price action and looking for bounce points) we can obtain a greater probability that the price will go in the direction we expect
This script is compact, which can be very useful for many traders
Default values
DMI:
Lenght=10
Stolenght=3
Stochastic:
K=5
D=3
Smooth=3
RSI Stochastic:
Lenght=4
The indicators configured in this way can bring greater efficiency, do not confront only them, also use price action or other confirmat
They are arranged in a graph, such that the DMI has the oversold at 10 and the overbought at 90, the stochastic oversold at 120 and overbought at 180 and the RSI at oversold at 220 and overbought at 280, you can configure them your way taking into account that the DMI range is from 0-100, stochastic 100-200 and RSI 200-300.

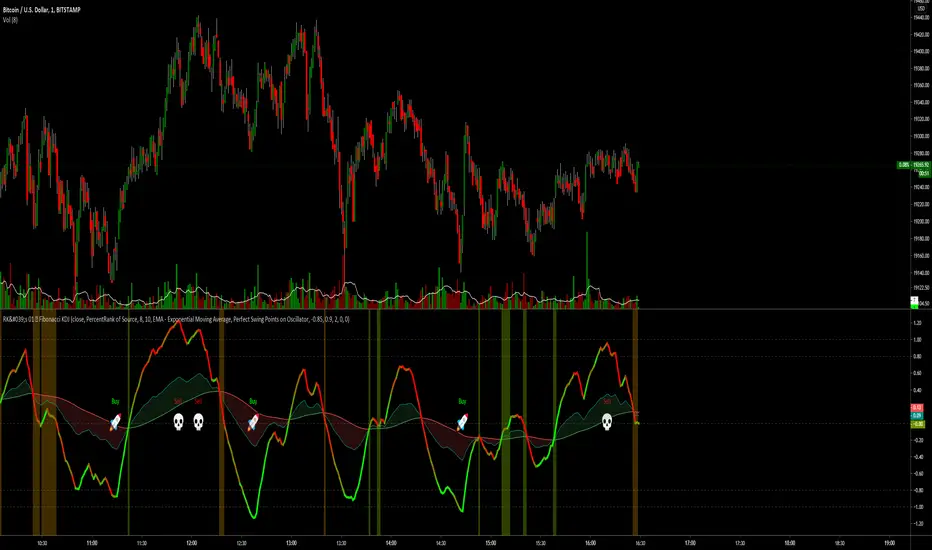
RK's 01 ∴ Fibonacci KDJAfter receiving some messages asking about my Fibonacci KDJ Indicator, I decided to share with everyone here, but, in this moment I prefer to keep the script hide. 😅
About this indicator:
This is a traditional KDJ indicator with more options:
You can choose the oscillator method between PercentRank, Stochastic and Williams %R;
Treat all the source values as a Logarithmic number;
Use Fibonacci's nth term number as Period and Signal Length, or uncheck this options and type your favorite Length numbers;
And choose what kind of moving average to apply on signal.
The other options is for help the user to enter or exit the market, and I put some visuals options to fit in different styles
Hope you like and have great lucky and profit.
Stochastic / RSI (Wilder's [RMA] or Arnaud Legoux [ALMA])This script displays the Stochastic and Relative Strength Index ("RSI") indicators. Each indicator can be displayed standalone or shown together. The Stochastic indicator also has functionality to highlight overbought/oversold levels as well as relative placement of K and D. The RSI indicator can also be updated to utilize the Arnaud Legoux Moving Average ("ALMA") (vs. the standard Wilder's Moving Average).
I use based on default settings. ALMA RSI can help indicate extent of drop/rise from Stochastic overbought/oversold levels.
Recognition due to @kurtsmock for the work on validating the ALMA calculation (pinescript built-in function has slight deviation from original design) ---> LINK ().

Hybrid Overbought/Oversold Detector + Put/Call SignalsThere are many indicators of overbought/oversold conditions out there. Some of more common ones are:
- Bollinger Bands %B
- Money Flow Index (MFI)
- Relative Strength Index (RSI)
- Stochastic
This script uses a combination of these 4 oscillators to confirm overbought/oversold and filter the signals of market reverse which could be used for trading binary options.
You may select which oscillators you want to apply and of course change the source, the length of the calculations and the overbought/oversold levels.
Also the script will draw a combined graph which is the average of the selected oscillators in the options.
Send me your ideas!

TESLA: RSI and StochasticThis script is part of the "TESLA" strategy and will help traders identifying overbought and oversold condition as well as other applications such as divergence. The features for this script are the following:
- 1 RSI index in order to identify market buying/selling strength
- 2x Stochastic in order to have fast and slow overbought and oversold zones.
Bollinger Band Reversal StudyThis strategy was inspired by ParallaxFX.
This strategy attempts to predict when a price reversal will happen. It uses bollinger bands, stochastics and candle formations.
The idea is that when an indecision candle, such as a doji, crosses outside the bollinger bands, then is followed by another candle that pushed sharply back inside the bands, you have a setup.
These setups are marked with green arrows to go long and red arrows to go short. Wait until the next candle begins before acting. The arrow may come and go as the price fluctuates, so wait until the candle closes.
Another play is when the same setup occurs, but on the middle bollinger band instead of the outer band.
These setups are marked with blue arrows to go long and yellow arrows to go short. Wait until the next candle begins before acting. The arrow may come and go as the price fluctuates, so wait until the candle closes.
Closing can happen a number of ways. You can use a predetermined risk-reward or look to sell when the price reaches another band.
In summary.
Go long when a green or blue arrow appears.
Go Short when a red or yellow arrow appears.
Green arrows show signs of reversal from lower BB.
Blue arrows show signs of reversal from middle BB.
Red arrows show signs of reversal from upper BB.
Yellow arrows show signs of reversal from middle BB.
Wait for candle with arrow to close before taking trade.

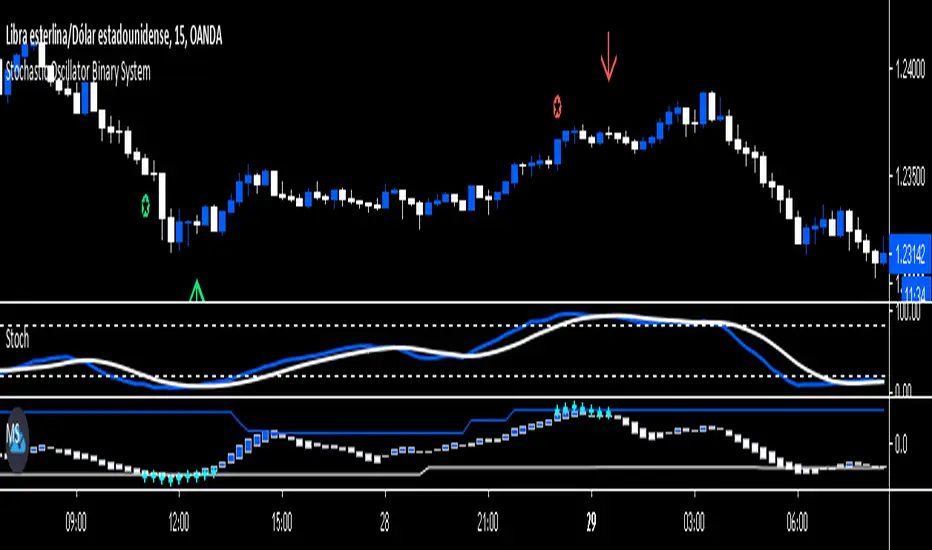
Stochastic Oscillator Binary System by Hashtag_binaryRules
- Time Frame 1 min.
- Expires Time 3 min or 15 min (the best option).
- Markets: Forex (only volatile currency pair), Futures.
- Sessions: London and New York.
Call
- Heiken Ashi Dodger blue;
-Stochastic Oscillator cross upward from oversold Zone (conservative trade, aggressive trade: Stochastic Oscillator cross upward ).
-Matrix three square dodger blue.
Put
- Heiken Ashi white;
- Stochastic Oscillator cross downward from overbougth Zone (conservative trade, aggressive trade: Stochastic Oscillator cross downward ).
- Matrix three square withe.
This Binary System is also good for trade scalping. The same rule for entry with conservative trade:
Exit position options
- For Buy close position when the stochastic line touches 80 levels,
- For Sell close positions when stochastic line touches 20 levels.
- Initial Stop loss on the previous swing.
Stoch+RSI With Color Combination. Hello Everyone This Indicater Base on (RSI and Stoch) COMBINATION With Color Combination.
You Can also use for
1-Divergence.
2-Overbought.
3-Oversold.
4-Breakout.
5-Support & Resistance Zones.

Jackrabbit.modulus.StochasticThis is the Stochastic for the Jackrabbit suite and modulus framework.
This indicator supports differential timeframe analysis and confirmational bias. Dynamic timeframes are supported.
This is an updated view of Stochastic and supports traditional overbought/sold boundaries and cross over regions.
The main indicatior and the confirmational indicator can both be individually tuned for the %K, and %D moving averages with different and independent lengths and 30 different moving average types:
SMA, Double SMA, Triple SMA,
EMA, Double EMA, Triple EMA,
RMA, Double RMA, Triple RMA
WMA, Double WMA, Triple WMA,
VWMA, Double VWMA, Triple VWMA,
Hull, Double Hull, Triple Hull,
ZLEMA, Double ZLEMA, Triple ZLEMA,
SWMA, Double SWMA, Triple SWMA,
SSMA, Double SSMA, Triple SSMA,
SMMA,Double SMMA, Triple SMMA
The Jackrabbit modulus framework is a plug in play paradigm built to operate through TradingView's indicator on indicatior (IoI) functionality. As such, this script receives a signal line from the previous script in the IoI chain, and evaluates the buy/sell signals appropriate to the current analysis. The results are either combined with the signal line, or used as confirmation to the signal line. A new signal line is generated for the next script in the link.
This script is not designed or meant to function outside my framework and contains no alert capabilities.
By default, the signal line is visible and the charts are turned off. Signal line visibility is controlled by the Style tab, and the charts display is controlled by the indicator settings tab.
This script is by invitation only. To learn more about accessing this script, please see my signature or send me a PM. Thank you.

Superb RSI Signal by Lukas, Version 1.0.0Buy and Sell Signal base on many momentum indicator.
Only works on Forex Major Pairs :)
I test on 1H timeframe and its looks good.
Use DEMA 20 for entry point, always entry near DEMA 20 for maximum profit, use your trailing stop and stop loss 1 ATR from entry.
Circle on top : trend 1st resolution
Circle on bottom : trend 2nd resolution
Set second resolution with higher timeframe for safer trade or lower timeframe for aggressive trade.
You can play around with other settings, it's about sensitivity.
Hope it useful,
Cheers.

Stochastic Weights - Basic [BigBitsIO]This script is a compilation of several different stochastic indicators (and RSI) where the K value of each indicator is equally weighted. The purpose of the indicator is to combine many indicators together in a fashion that weights them easier. By default, the Stochastic and Stochastic RSI are both enabled - the idea is to speed up the relatively slower Stochastic and to slow down the relatively fast Stochastic RSI. Other Stochastics are also available, including some of my own custom calculations that can also be added to the weighted calculation. Only the K value is weighted, as the D value is just a moving average of the weighted K.
Explained:
- Calculates enabled indicators
- Calculates the weighted value of K for enabled indicators
- Calculates a D value from the weighted K
FAQ:
- Why is this script useful?
- To weight multiple indicators together so that you can attempt to find optimal values shared amongst the indicators. Ex: If Stochastic RSI is 100 and Stochastic is 50, K would be 75 and not particularly high. If you add in a 50 RSI, the K would be 67 in this example. If we weight indicators together that all have a high value they could potentially help find elements that align together to produce a stronger signal.
DISCLAIMER: For educational and entertainment purposes only. Nothing in this content should be interpreted as financial advice or a recommendation to buy or sell any sort of security or investment including all types of crypto. DYOR, TYOB.
RSI, Stoch, DMI Stoch / By Mochero
With this indicator, we seek to find convergence of RSI, Stoch and DMI for purchases or sales.
Search Buy when,
-Rsi over sold
-Stoch over sold
-DMI Over sold
Search Sell when,
-Rsi oon purchased
-Stoch on purchased
-DMI on purchased
Suggested values
Rsi: 4
Stoch: 5.1.1
DMI: 10.3
Suggested time, 5M 15M
CCU MFI + RSI + STOCH RSIThis demonstrates the accuracy of entry signal of the MFI + RSI + STOCH RSI strategy

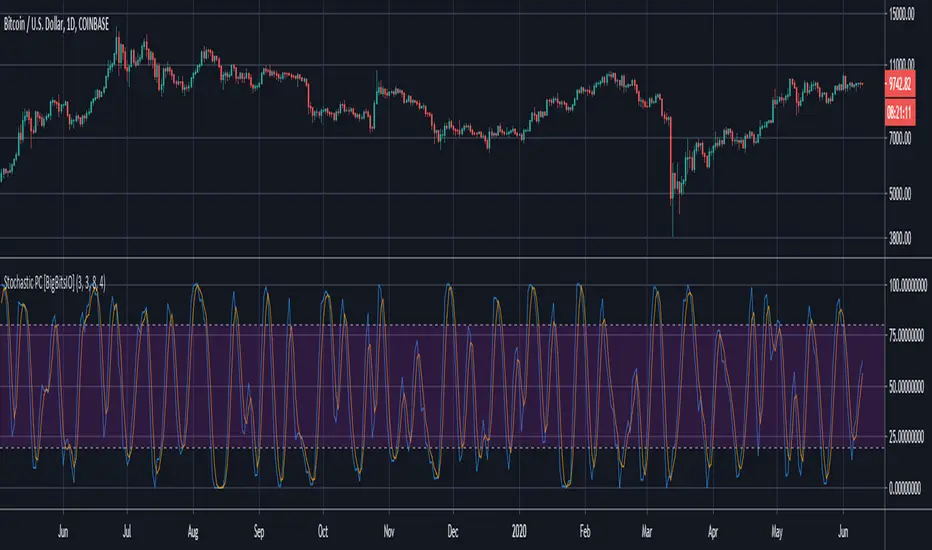
Stochastic PC [BigBitsIO]This script is a very simple stochastic calculation similar to Stochastic RSI that calculates a stochastic value of a moving average of the percentage price change. The purpose of the indicator is to find positive and negative volatility momentum peaks which might be able to help identify changes in trends. Like other stochastic indicators, it may be best used in combination with other indicators.
Explained:
- First gets the % change for the candle from open to close. Green candles produce positive values, red candles produce negative values.
- Then it creates a moving average of that number to try and reduce impacts of very large moves, although this can be changed with the super-fast smoothed length setting. Set it to 1 to remove all smoothing.
- After that, it creates a K value using a stochastic calculation based on the range of the price change moving average we created in the previous step. Set the smoothK to one to use a fast stochastic calculation, it is a slow stochastic calculation by default (3-period SMA of stochastic)
- Finally, to create the D value it calculates a 3-period SMA of the K value.
FAQ:
- Why is this script useful?
- This script can help identify the peaks and valleys of volatility momentum
DISCLAIMER: For educational and entertainment purposes only. Nothing in this content should be interpreted as financial advice or a recommendation to buy or sell any sort of security or investment including all types of crypto. DYOR, TYOB.
2. AutoBots Trading - BACKTEST: StochasticBACKTEST: Stochastic
1. Description: a momentum indicator comparing a particular closing price of a security to a range of its prices over a certain period of time. The sensitivity of the oscillator to market movements is reducible by adjusting that time period or by taking a moving average of the result. It is used to generate overbought and oversold trading signals, utilizing a 0-100 bounded range of values.
2. Strategy rules: defined based on the component, signal count, entry prices, open order count, position check, position averages, conditional closes and close signals.
3. Risk management: system was defined based on the choice of only long, only short or both sides. Defining the choice of take profit, stop loss and trailing stos (no repaint).
4. Symbol: BTCUSD (only)
5. Suggested Timeframe: D
6. Parameter for optimization: 7, 11, 1, false, 20, 80, side: both, tp: 5%, sl: 2.5%, ts: 2%/2%
7. Walk forward simulation
7.1. In sample period: jan/2018-jan/2020
7.2. Out of sample period: jan/2020 - ago/2020
** For purpose educate only

LIZ W STCH & TRENDStochastic for timely entry when the short-term reverse of the trend direction is over.
You can view two types of short-term configurations and medium-term configurations.
The color of the background changes from the order in which the three short-term moving average lines are displayed on the main chart.
(See Description of Another Indicator jp.tradingview.com
Wait for the long position to be held when the background is warm.
When the background is cold, wait for the timing to hold the short position.
When you have a long position, you will enter the price when you go up after touching the 20th line or when you go down below the 20th line and the price goes up after you go up above the 20th line.
If you have a short position, use the 80 line as a guideline to reverse the above.
When the background is gray, the volatility of the price movement may be reduced.
Since the direction of price fluctuations is often unclear and the price range is not clear, we should refrain from trading.
If you are interested in the invitation-only indicator, please contact us on private chat.
トレンド方向に対する短期的な逆行が終わった時、タイミングよくエントリーするためのストキャスティクスです。
短期間設定のものと、中期間設定のもの、2種類を表示できます。
メインチャートに表示されている短期移動平均線3本の並び順から背景の色が変化します。(こちらのインジケーターを参照 jp.tradingview.com
背景が暖色の時はロングポジションを持つタイミングを待ちます。
背景が寒色の時はショートポジションを持つタイミングを待ちます。
ロングポジションを持つ時は価格が“20ラインにタッチした後上昇した時“、“ラインを下回った後価格が上昇し20ラインを上回った時“にエントリーします。
ショートポジションを持つ時は80ラインを目安に、上記の反対を行います。
背景がグレーになっている時は値動きのボラティリティーが低下している可能性があります。
価格変動の方向性がはっきりせず値幅が出ない事が多いため、トレードを控えるべき期間です。
招待専用インジに興味ある方はプライベートチャットに連絡をください。

Lobowass 2 StochasticsThis script uses a DMI, Stochastic, and two stochastic RSI, when they are all overbought or oversold (also applying price action and looking for bounce points) we can obtain a greater probability that the price will go in the direction we expect
This script is compact, which can be very useful for many traders
Default values
DMI:
Lenght=10
Stolenght=3
Stochastic:
K=14
D=3
Smooth=3
RSI Stochastic:
K=3
D=3
Lenght=6
Lenght Stoch=6
RSI Stochastic 2:
K=3
D=3
Lenght=14
Lenght Stoch=14
The indicators configured in this way can bring greater efficiency, do not confront only them, also use price action or other confirmat
They are arranged in a graph, such that the DMI has the oversold at 10 and the overbought at 90, the stochastic oversold at 120 and overbought at 180, first stochastic RSI at oversold at 220 and overbought at 280, and last stochastic RSI at oversold at 320 and overbought at 380, you can configure them your way taking into account that the DMI range is from 0-100, stochastic 100-200, stochastic RSI 200-300 and stochastic RSI 2 from 300-400

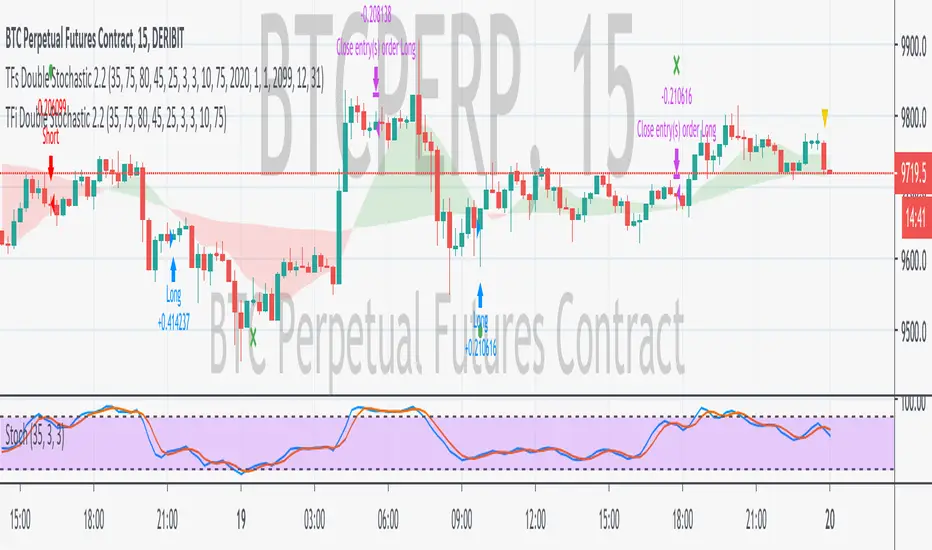
TFi Double Stochastic StudyThe Study script uses Stochastic indicators for entry and exit a position.
The entry and exit points are visualized in the chart via green arrows and crosses; the position follows the exact behavior of the strategy script.
The study also creates alerts, which follow the exact position of the entry/exit markers.
How to use
The Study works with most timeframes and instruments.
I'm also providing a "strategy" version of this Study, which can be used to backtest the strategy.
List of parameters
"Stochastic Length" ... Number of bars for Stochastic indicators
"Stochastic Overbought" ... Stochastic overbought level
"Stochastic Overbought Down Trend" ... Stochastic overbought level for down trends
"Stochastic Oversold Up Trend" ... Stochastic oversold level for up trends
"Stochastic Oversold" ... Stochastic oversold level
"Stochastic Smooth K" ... Stochastic K smoothing
"Stochastic Smooth D" ... Stochastic D smoothing
"Stochastic Confirmed" ... Enable to confirm the indicator value within the current bar
"MA Filter Enabled" ... Enable an additional filter for entering a position; the entries only follow the overall trend
"MA Fast Period" ... Fast filter period
"MA Slow Period" ... Slow filter period
List of alerts
Entry Long' ... Enter long position
'Entry Short' ... Enter short position
'Exit Long/Short' ... Exit long/short position
How to access
This Study is a "Invite Only" script. Please use the link below or send me a message via Tradingview to obtain access to the strategy and study script.
For enabling the script in your Tradingview chart window, click on "Indicators" and select "Invite-Only Scripts".