Alien Brain👉 What is this indicator ?
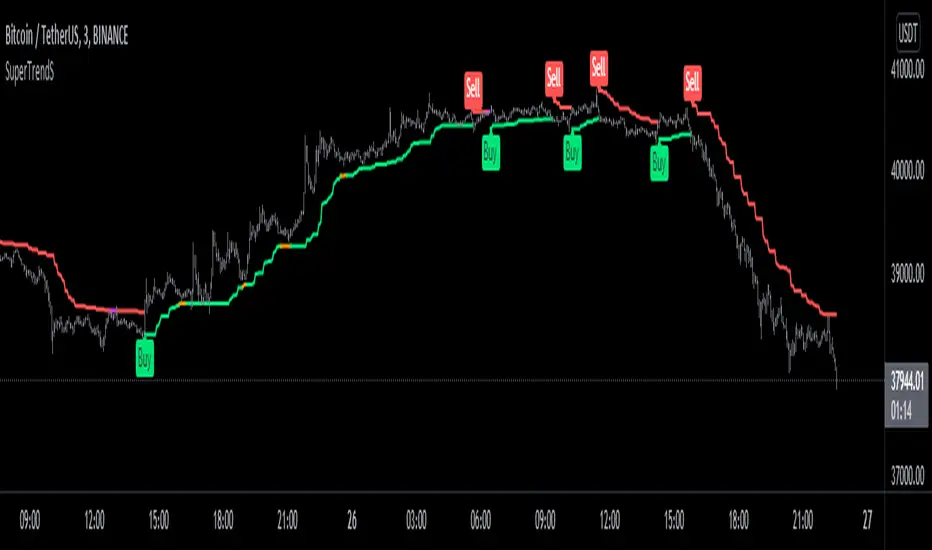
This indicator is made up with the help of Multi Trend , Moving Average and Price Action , In this beautiful indicator, The buy and sell entry is taken by comparing the trend in the higher time frame with the Trend in the short time frame using our secret logic.
👉 What kind of Buy and Sell signal is there on this indicator ?
Four types of buy and sell signals are displayed on this indicator, each marked as M.Buy(Master Buy) , M.Sell (Master Sell) , Buy1, Sell1, Buy2 , Sell2, Buy3 and Sell3 respectively. These four types of indications are obtained by comparing the trend in the higher time frame with the Trend in the short time frame.
👉 What kind of Take Profit signal is there on this indicator ?
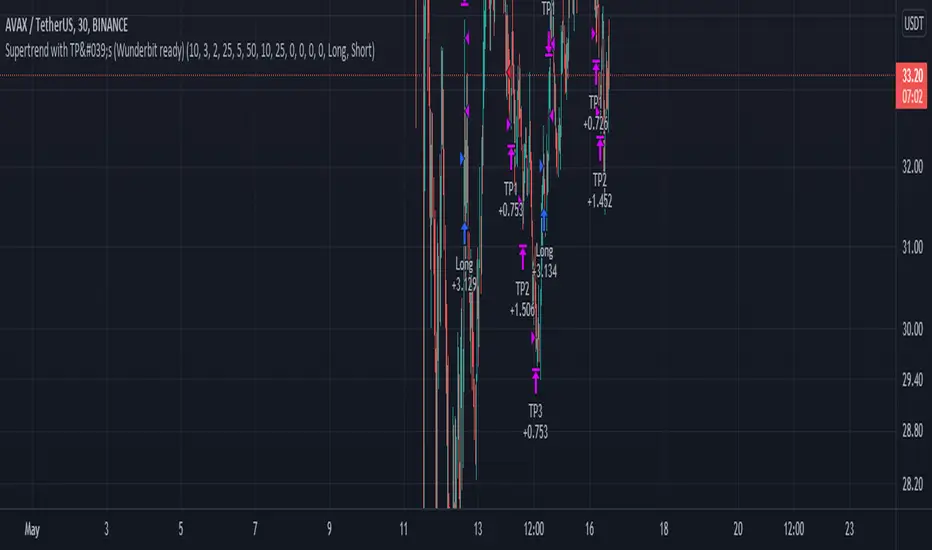
Four types of take profit signals are displayed on this indicator, each marked as TP1,TP2,TP3 and TP4 respectively. The take profit signals available for both buy and sell entries. The take profit of the buy entry is shown in Green Color and the take profit of the sell entry is shown in Red Color.
Note : Take Profit Signals Only Available for Master Buy and Master Sell
👉 What kind of Exit signal is there on this indicator ?
Exit signals can be seen at the end of the trend
Note : Exit Signals Only Available for Master Buy and Master Sell
👉 How many alarms does this indicator have ?
This indicator has 18 types of alarm for Buy , Sell , Take Profit and Exit signal, and it is best to set the alarm by selecting the Alert Once Bar Close option to avoid repaint.
👉 On which coins can this indicator be used ?
This indicator is best used on all cryptocurrencies, forex markets and stocks , This indicator is very helpful to get high returns on all cryptocurrencies with low price and high voltality
Note : This indicator only works well in 1 min time frame , Use appropriate values when using other coins. If you have difficulty finding the value, you can contact us.
Default Setup Instructions 👇
Time Frame : 1 Minute
Default Coin : OGNUSDT
The following settings can be found in this indicator
TOP BRAIN - Factor : This is the ATR Factor Value for High Time Frame trend. You can change this value according to the volatility, the ATR Factor value is also used to reduce the chance of a fake signal
MID BRAIN - Factor : This is the ATR Factor Value for Low Time Frame trend. You can change this value according to the volatility, the ATR Factor value is also used to reduce the chance of a fake signal
MID BRAIN - Threshold : This is the difference between price and moving average. Changing the value of this option will change the accuracy of the trading signal
LOW BRAIN - Factor : This is the ATR Factor Value for Second Low Time Frame trend.
Take Profit - TP1 Percentage : Give What percentage for take First TP of Master Signal
Take Profit - TP2 Percentage : Give What percentage for take Second TP of Master Signal
Take Profit - TP3 Percentage : Give What percentage for take Third TP of Master Signal
Take Profit - TP4 Percentage : Give What percentage for take Fourth TP of Master Signal
Indicateur Pine Script®