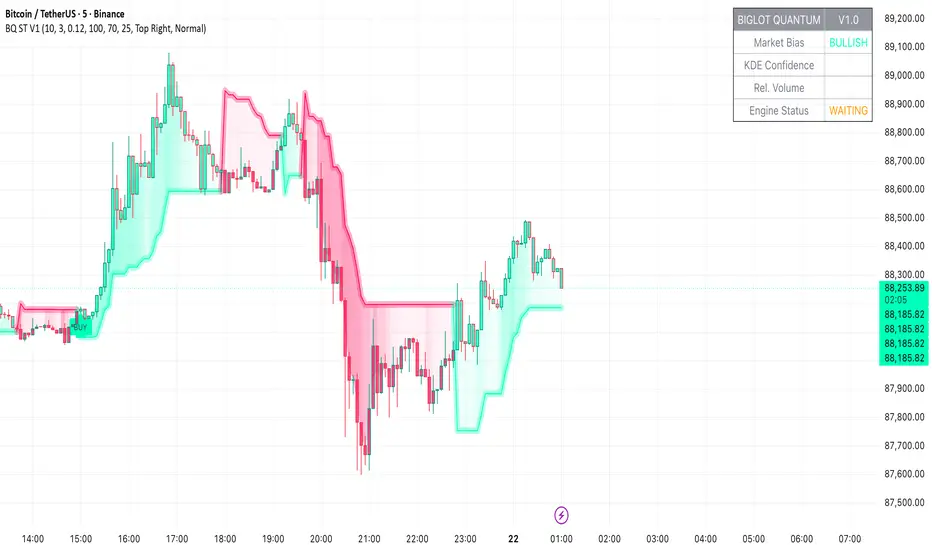
Supertrend ProThis is the Supertrend indicator based on ATR (Average True Range), which is most accepted technical way for such indicator.
Setting menu is fully customizable:
drive.google.com
1. You can change ATR lookback period means how many bars to check. default is 10, you can set it as per you trading style.
2. ATR multiplier is set to 3 by default. You can change it to your preferred value.
3. You can choose your own price reference.
4. Option to enable/disable ATR calculation, Background etc..
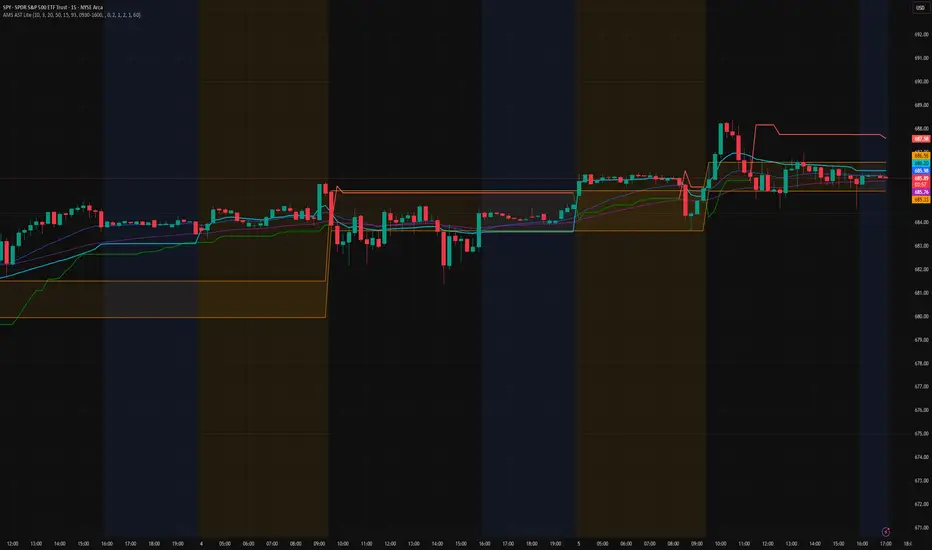
Style section is also fully customizable:
drive.google.com
Indicateur Pine Script®