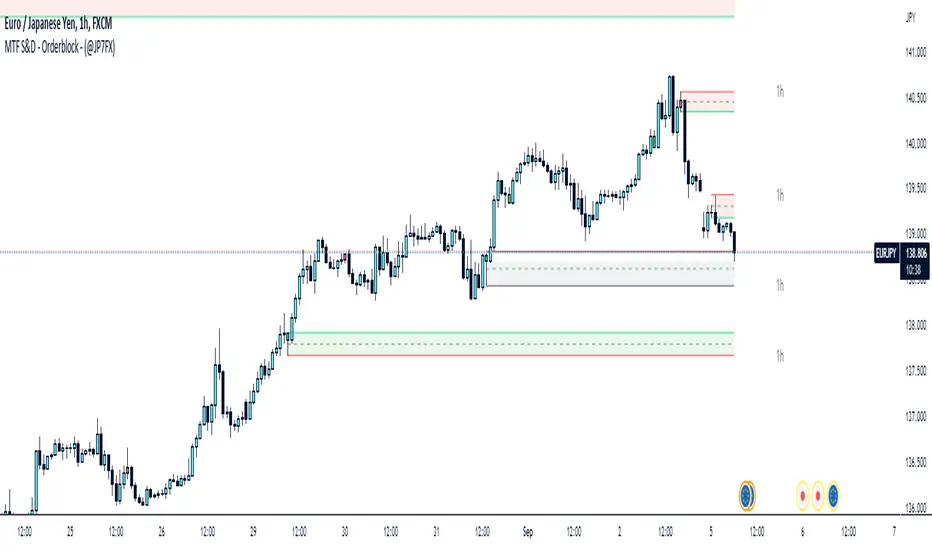
Supply & Demand / Orderblocks - Multi TimeFrame (@JP7FX)This should easily find the clear BUY to SELL / SELL to BUY candles with imbalance created.
There are options to change the Supply and Demand / OrderBlock CREATION based off the OPEN or WICK imbalance and also the option to DRAW the zones from the OPEN or the WICK.
Will also draw HTF zones with options to change the colour of zones when price has mitigated these areas, zones will be deleted once price has passed through.
Each Zone has the 50% line drawn and will delete when Price has reached - maybe useful for traders who look for 50% mitigation of areas.
When using HTF zones (max of 2) a Timeframe display will show for that zone.
There are many options to change colours and lines etc to suit the layout you prefer.
The zones that are created are not to trade from without additional analysis its simply to help draw strong zones.
Hope this provide some help and Trade Safe :)
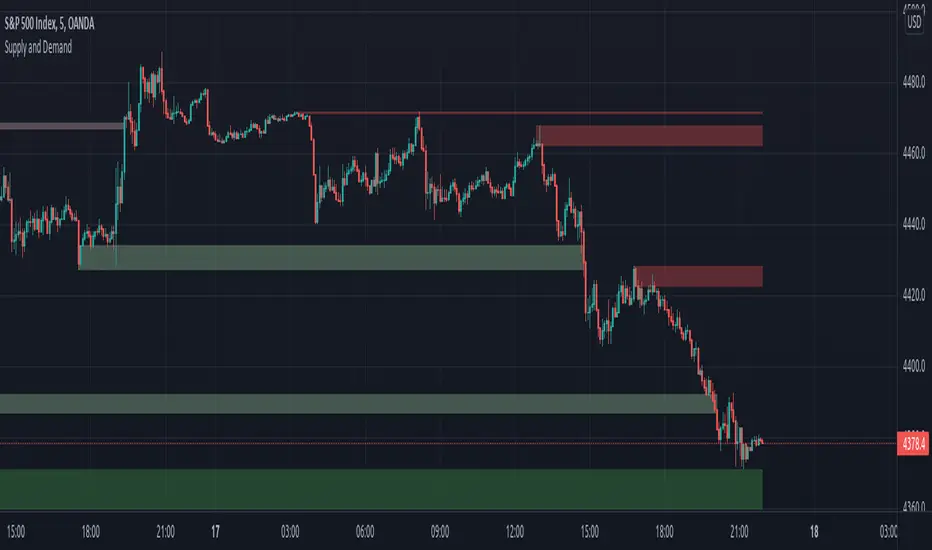
Offre et demande
MarketReader_StrategyMarketReader_Strategy is a very useful and advanced indicator:
- It draws buying (green) and selling (orange) zone .
-Once the buying or selling zone is tapped, the color is automatically changed to grey
-It shows liquidity pool ($$$) engineered by market behaviour
Buying or selling area are determined by an algorithm that combines volume profile, Elliott Wave principles and order flow delivery .
On the above example:
At “1” , you can see that the first buying zone is drawn since January 12
At “2” , the buying zone is tapped on January 18 with a strong bullish reaction.
At “3” and “3’” , you can see that liquidity pool has been created by market maker on both buying and selling side. It is typical of market behavior.
Market maker will take the downside liquidity by targeting the buying zone and then reverse (to the upside) targeting the upside liquidity pool that fuel the pump to the selling zone “4” . This selling zone is reached at “5” with a strong bearish reaction.
“6” represent active buying zone, waiting to be tapped.
To buy or take profit on these areas will depend on market behavior on the way down. Does the market engineer liquidity before? We use 2 complementary indicators helping us to take position on these areas but feel free to experiment with your own.
Usually, I wait price comes to selling or buying zone, then I go on lower timeframe (15 to 30 times lower) searching for divergences and convergences on Momemtum reader (also available on tradingview)
This indicator does not repaint and works on Forex, Crypto, Indices, Commodities and stock.

Demand & Supply Zones [eyes20xx]Demand & Supply Zones
This indicator helps to identify large moves driven by institutions.
What qualifies as a zone?
If the price moves (open to close) by more than a certain % in one candle or in a bullish / bearish run of candles, the zone is marked as a Demand or Supply zone .
0.8% is good for Crypto and Forex might be better with 0.4%. Play around with the % to match your requirements.
Active zones
A zone remains active until it is hit by the price. When it becomes inactive, the zone background becomes transparent.
Zone lines
Lines are displayed if the zone is active and within a certain % of the close. 3% is a good setting for Crypto.
A maximum of two lines are displayed for each zone type.

Volume-based Support & Resistance ZonesThe new and improved Support & Resistance Zones indicator is here. This indicator is based on high volume at fractal lows or fractal highs with the zones based on the size of the wick for that timeframe’s candle.
This helps traders visualize which price levels are of the most significance for either reversals or continuation of the trend when zones are broken and then re-tested.
Original script is thanks to synapticex and additional modifications is thanks to Lij_MC. Credit to both of them for most of the logic behind this script.
Since then I have made many changes to this script as noted below:
Changed default S/R lines from plots to lines, and gave option to user to change between solid line, dashed line, or dotted line for both S/R lines.
Added additional time frame and gave more TF options for TF1 other than current TF. Now you will have 4 time frames to plot S/R zones from.
Gave user option to easily change line thickness for all S/R lines.
Made it easier to change colors of S/R lines and zones by consolidating the options under settings (rather than under style).
Added extensions to active SR Zones to extend all the way right.
Added option to extend or not extend the previous S/R zones up to next S/R zone.
Added optional time frame labels to active S/R zones, with left and right options as well as option to adjust how far to the right label is set.
Fixed issue where the higher time frame S/R zone was not properly starting from the high/low of fractal. Now any higher time frame S/R will begin exactly at the High/Low points. Note that this may not work perfectly on stocks and if a fractal high/low is too many bars in the past, it will revert to a default max bars back to avoid script errors.
Added to script a function that will prevent S/R zones from lower time frames displaying while on a higher time frame. This helps clean up the chart quite a bit.
Created arrays for each time frame's boxes and lines so that the number of S/R zones can be controlled for each time frame and limit memory consumption.
New alert options added and customized alert messages.
- The way this indicator works is it looks for fractal highs or fractal lows with volume that pierces above the volume's Moving Average. This moving average value can be modified in the settings for each time frame.
- The fractal highs will be confirmed with 3 successive higher highs followed by 2 successive lower highs and vice versa for the fractal lows.
- The zone is created from the fractal high/low and the close of the candle for whatever time frame you selected. The bigger the zone, the more significant that zone is.
- You can disable any zone, change the zones to show lines only, and modify all the colors, transparencies, and thickness of lines for all the zones.
- To create alerts, you first want to enable the types of alerts you want for each time frame in the indicator's settings. Then after you apply changes, right click on one of the zones on the chart, and click "Add Alert on Vol S/R Zones". You do not need to add a title as the correct alert messages are already built-in.
- More changes will be coming in the future!
I hope you find this indicator useful, if so please give it a thumbs up!
If you have any suggestions or features you would like to see, just let me know in the comment section. Thanks and enjoy!

SSR - Stablecoin Supply Ratio - Bitcoin - CryptocurrencyThe Stablecoin Supply Ratio (SSR) is the ratio between Bitcoin supply and the supply of stablecoins, denominated in BTC.
When the SSR is low, the current stablecoin supply has more "buying power" to purchase BTC. It serves as a proxy for the supply/demand mechanics between BTC and USD.

Divina - Support and ResistanceGiven the positive feedback received on the first Dynamic Support/Resistance script, I've decided to rewrite it on Pine Script v5 and publish it with open source code.
The main Divina area (box) is derived from change in price and volume, while the other support and resistance levels are based on the golden ratio (Divina proportione) or Fibonacci numbers.
The box will start to paint if the previous closed bar satisfy a condition and it will be never be repainted in the future. Anyway the box and the levels will be extended until a new signal is detected.
The Divina Support and Resistance will help you to find good price zones on wich the market might take trading decision. It is not a strategy by per se, it should be used with other good trading techniques.

Auto Price Action - Multi Time Frame [Mehrok]Auto Price Action - Volume Price and Spread - Multi Time Frame
Volume Price and Spread script generates important support and resistance levels basis activity happening in price, volume and candle spread. The basic idea has been taken from concepts of VSA which underlies that weakness appears in uptrend and strength in downtrend. Script will try to find candles which have volume higher then average and candle spread.
Underlying logic:
Script generates significant high's as resistance and lows as support basis activity happened on volume , price and candle spread. Multi Time Frame gives ability to find strong support and resistance levels on higher time frames and display on lower time frame chart.
Usage:
As it records and maintain important high and lows happening on candles till the time new levels are generated therefore generated price levels act as significant support or resistance. Higher the activity in volume , price and spread stronger that price level would act as support or resistance in future.
Script work on all time frame where volume information is available. In absence of volume information script would only generate optional levels and that too if activated.

3rd WaveHello All,
In Elliott Wave Theory, 3rd wave is not the shortest one in the waves 1/3/5 and it's usually longest one. so if we can catch it then we may get good opportunities to trade. This script finds 3rd wave experimentally. it can be also the 3rd waves in the waves 1, 3, 5, A and C. the 3rd wave should have greater volume than other waves, the script can check its volume and compare with the volumes of the waves 1 and 2 optionally.
Pine Team released Pine version 5! This script was developed in v5 and it uses Library feature of Pine v5 for the zigzag functions. This script is also an example for the Pine developers who learn Pine v5 and Libraries.
Options:
Zigzag Period: is the length that is used to calculate highest/lowest and the zigzag waves
Min/Max Retracements: is the retracement rates to check the wave 2 according to wave 1. for example; if min/max values are 0.500-0.618 then wave 2 must be minimum 0.500 of wave 1 and maximum 0.618 of wave 1.
Check Volume Support: is an option to compare the volumes of1. 2. and . waves. if you enable this option then the script checks their volume and 3rd wave volume must be greater then 1 and 2
there are 4 options for the targets. you can enable/disable and change their levels. targets are calculated using length of wave 1.
Options to show breakout zone, zigzag, wave 1 and 2.
and some options for the colors.
The Library that is used in this script:
P.S. This is an experimental work and can be improved. So do not hesitate to drop your comments under the script ;)
Enjoy!

Supply and DemandOur Indicator “Supply and Demand” offers an insight into the structure of any given Instrument applied to. Understanding Supply and Demand is essential for using this Indicator. If you are familiar with the concept, then you will most likely find this indicator useful in your trading. If you are unfamiliar with the concept and are interested then continue reading a “Brief Concept of Supply and Demand” at the end of the description, where we will provide some informational Links.
This description will provide a High Level description of how our Indicator identifies and visualizes Supply and Demand, followed by how to use the Indicator in your trading. At the end we would like to introduce our team and experience.
High Level Description of “Supply and Demand”:
Our indicator searches for price zones where the current Instrument has experienced a significant liquidity imbalance in the recent relative past. Our indicator uses a Multi timeframe approach to identify these areas. These Zones will be referred to as “Active Zones” from now on.
When Price exceeds the outer boundary of the Active Zones, then this Supply or Demand Zone will be identified as “Expired”, and the zone is no longer in play. These Zones will be referred to as “Expired Zones” from now on.
Visualisation:
What do the Boxes mean:
Our Indicator visualises active Supply and Demand Zones. Supply zones are red and Demand Zones are green. Furthermore, our indicator shows a brief history of Expired Supply and Demand Zones. These Zones have the same color as the active Supply and Demand Zones, just with a higher color transparency so that you can distinguish between active and Expired Zones.
The boxes start at the time where the supply/demand has occurred historically, providing a simple method to review the Market reaction to the historic supply/demand event.
History:
Due to the high calculation effort, the history is limited to 20 Zones in total. All zones prior to that will not be displayed.
Important:
All Zones will not be repainted. That being said, once our indicator has started displaying a Zone, then it will be visible until it exceeds the 20 Zone history limit and “falls of” the chart.
How to use it:
Approaching an Active Supply/Demand Zone:
When price is approaching or entering an active Supply/Demand Zone, look for reversal patterns you are familiar with. It is important that you have a tested method behind your entry and exit strategy. Please note, that the indicator itself just presents price areas where there is a potential for a price reversal, and that these levels should not be traded blindly.
Expired Supply/Demand Zones:
Expired Supply and Demand Zones are mainly just to provide a small History of Supply and Demand Zones to you. There are more advanced concepts for also using Expired Supply and Demand Zones in your Trading, but this is not the focus of this Indicator.
Time frame:
This indicator is programmed to be used on all Timeframes.
Instruments:
This indicator aims to visualize areas of where Market price has the potential to reversal, hence this is a mean reverting Indicator.
Taking this statement to account, it is recommended to apply this Indicator to Instruments with a mean reverting character.
Examples of mean reverting markets could be for example …
...all FOREX instruments, as FOREX is considered a mean reverting Market.
...an instrument that is in a consolidation, or which you are expecting to enter a period of consolidation.
Indicator settings and configuration:
The Indicator has no functional parameters, to reduce User error, and only has visual parameters. The color of the Supply and Demand Zones can be tailored to your liking.
Brief concept of Supply and Demand:
Supply and Demand is a concept that has been around for a very long time. Following links are helpful to get a grasp of the concept:
en.wikipedia.org www.investopedia.com
www.investopedia.com
Our Team:
We are a team of 3 Traders with a combined experience of 40 years. We are using our experiences from the market to create Indicators to Visualize the most relevant Patterns to us in our trading today. Our goal is to reconstruct these patterns to match our understanding of the market and to simplify the process of creating reproducible trading Strategies.
Price ActionFirst, you have to know price action, RTM price action Handbook could help you
this indicator shows you base and momentum candles
base candles could be zones of trade that show you fighting of bulls and bears, and momentum candles could show the power of those zones.
Base candles are white in the chart, and you can place your order at the good zone.
Rally candles and drop candles are momentum candles, and bold rally and bold drop show that it is more powerful than its before candle.
Zigzag compression is one way that shows the compression in trend.
it looks like the Wedges pattern at classic technical that shows pending orders are closed, so the target zone could be powerful to reverse the trend.
Black background of candle means that candle doesn't reach its before candle and so it is poor candle, I named it domination.
It is better to do not trade at poor candles.
At the end, I find Price action the best way to trade, and it makes you free of other indicator, even volume indicator.
This indicator is good for those who use price action strategy to trade and those who want to learn the price action.
It could be so helpful and reliable way to find the zones, and place buy or sell order and the target, specially for scalping.

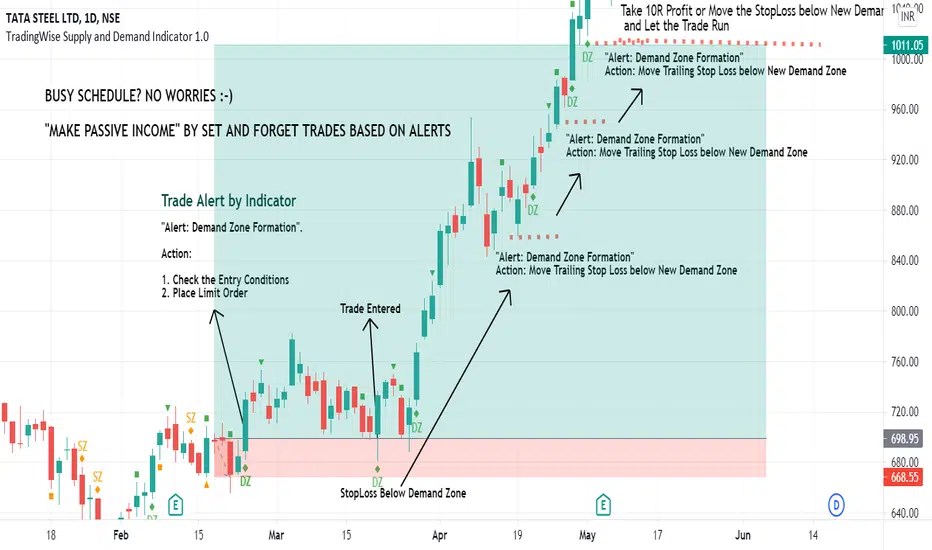
TradingWise Supply and Demand Indicator 1.0TradingWise Supply and Demand Indicator 1.0 is based on the Price Action candlestick patterns to identify the Supply and Demand zones in the charts (Areas of liquidity). It works on all Timeframes and Asset Classes. This Script helps the traders to identify the demand and supply zones with identifications on the candle stick patterns indicating the origin of the Strong move. Also it generates Alerts automatically once the supply or demand area is formed thus by reducing the hours spent on the charts and reducing the missed trade Opportunities as well. This Indicator is extremely helpful for those on Full time Jobs/ Busy Schedule.
Buy/Sell Alerts by Indicator:
Green Diamond + DZ Sign ---> Indicates the Demand Zone Formation. Place Buy Trade upon Entry Criteria Met
Orange Diamond + SZ Sign ---> Indicates the Supply Zone Formation. Place Sell Trade upon Entry Criteria Met
Volume Profile / Fixed RangeHello All,
This script calculates and shows Volume Profile for the fixed range . Recently we have box.new() feature in Pine Language and it's used in this script as an example. Thanks to Pine Team and Tradingview!..
Sell/Buy volumes are calculated approximately!.
Options:
"Number of Bars" : Number of the bars that volume profile will be calculated/shown
"Row Size" : Number of the Rows
"Value Area Volume % " : the percent for Value Area
and there are other options for coloring and POC line style
Enjoy!

Coin support [Supply/Demand]The idea here is to input the appropriate benchmark tickerid to the asset class you're trading and to paint zones according to the price activity of the selected tickerid. This works very well trying to paint meaningful zones against noisy stocks, currencies, commodities etc. Use a correlation coefficient to determine the best benchmark for your asset class.

Cup FinderHello All,
This script finds the Cups and you can use it while analysing the symbols. it creates circle and channel for the potential Cups and checks the number of bars included by the channel, if included bars is equal or greater than the value you set then it shows the cup.
The Options:
"Number for Bars to search" : Maximum length of a Cup
"Channel Width of the Cup" : Tate by the channel width of highest/lowest levels in last 300 bars, by default it's 5%
"Check for Breakout" : if there is Cup then it checks Close or High/Low is used a source for breaokuts, usuful while cheking historical bars
"Contained Bar Rate %" : after channel is created the script checks number of bars included by the channel of the Cup, you can set rate of included bars by this option
"S how Channels of Cups ": if you enable this option then you can see the channels around the Cups and set it as you wish
and there are some other options for labeling/removing old Cups and for coloring
Here you can see how channel looks like:
Cup with different colors:
P.S. This is an experimental work and sorry for no explanation in the script.
in the future if I have time I will try to write a script for Cup&Handle
This script is also an example to calculate and draw circles :)
Enjoy!

Nirvana Supply Demand V2.0This is an indicator of supply and demand ,It can provide the reference of supply and demand position for traders.
First of all, I need to explain the components of the indicators in detail.
💖==========================================💖
Components of supply and demand zone:
DBD:means Drop Base Drop
RBR:means Rally Base Rally
DBR:means Drop Base Rally
RBD:means Rally Base Drop
💖==========================================💖
Supply zone = DBD and RBD
Deamdn zone = RBR and DBR
💖==========================================💖
DBD = Sell
RBD = Sell
DBR = Buy
RBR = Buy
💖=====================================================================💖
Static K-line zone =Yellow
Dynamic Red K-line =Fall
Dynamic Green K-line = Bullish
Green + Yellow + Green Candle K = RBR = Demand = Buy
Green + Yellow + Red Candle K = RBD = Supply = Sell
Red + Yellow + Red Candle K = DBD = Supply = Sell
Red + Yellow + Green Candle K = DBR = Demand = Buy
Yellow + Red Candle K = Supply =Sell
Yellow + Green + Candle K = Demand Buy
Application part:
Demand
The green rectangular area that has not been touched is the demand area. It is suggested to buy on the upper edge of the green area and stop at the lower edge of the green area
The light green rectangular interval is the demand area that has been traded. They are the confirmed demand area and also belong to the bullish demand area.
Supply
The red rectangular section is the supply area, which belongs to the fresh supply area. It is recommended to sell in the supply area
The light red area is the supply area that has been sold, and also belongs to the confirmed supply area. It's bearish.
💖=====================================================================💖
Only after closing can we know whether it constitutes a supply and demand zone
The upward trend only trades in the demand area
The downward trend trades only in the supply area
💖=====================================================================💖
Transaction method:
Sold on the bottom edge of a red or reddish rectangle. Break through the rectangular stop loss.
Buy on the top edge of a green or light green rectangle and exit with a stop loss below the rectangle.
中文介绍:
这是一个供求关系的指标,可以为交易者提供供求状况的参考。
这个指标是一个升级过后的版本,在TV已经支持通过指标绘制矩形之后市场上出现了很多的指标,但我想我们的供需指标是市场上为数不多的供需指标,非常有实战意义。
黄色+红色K线组合为供给区平跌组合,属于看跌。通常这种形态是需要确认入场的,就是价格在进入这个区域之后止涨才可以卖出。
绿色+黄色+红色K线组合为供给区涨平跌,属于看跌。通常管中形态是出现在反转的拐点位置才有操作意义,或者是叠加的供给区位置才能提高卖出成功率。
红色+黄色+红色K线组合为供给区跌平跌,属于看跌区域,通常市场上的反转都是由涨平跌+跌平跌完成的,跌平跌在高位或中位的才有操作价格,低位的成功率略人低
黄色+绿色K线组合为需求区平涨,属于看涨。通常这种形态是需要确认入场的,就是价格在进入这个区域之后止跌才可以买入。
红色+黄色+绿色K线组合为跌平涨需求区,属于看涨,通常这种形态在低位拐点位置交易盈亏比才能达到最好。因为它位都是发生在反转的时候。
绿色+黄色+绿色K线组合为涨平涨需求区,属于看涨,通常和中形态是在出现跌平涨之后才会出现,由空头向多头转变也是需要完成跌平涨+涨平涨才能实现,当然V反的情况下除外。
注意事项:
太大的供需区请不要交易,因为止损可能会超过你的风险承受范围。
太小的供需区请不要交易,因为他里面的订单可能会非常少。
离开供需区的K线我们称为出线,出线就是大阳线或大阴线,属于实体非常饱满,供需区的胜率取决于出线的实体饱满程度,实体越饱满交易成功率越高,当然它不是绝对值。
指标若是有什么BUG或者是建议也请广大粉丝留言评论。

Distance to Demand Vectorshows the distance to its relevant demand vector.
demand vector is based on the demand for long/short, extracted from price range..
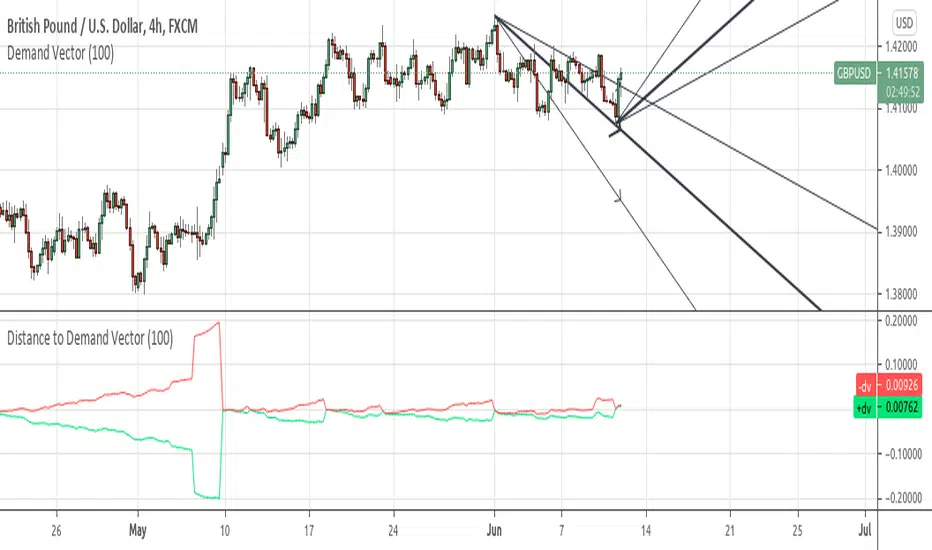
Demand VectorCreate lines based on the demand for long/short, extracted from price range.. this lines have nothing to do with volume and liquidity, its just a interpretation of price range.

Breakout FinderHelo All,
I got many requests for a Breakout script and here it's. This script searches the breakouts/breakdowns and draw square if there is one.
The options:
"Period" is used to find Pivot Points
"Max Breakout Length" is the maximum length to search breakouts
"Threshold Rate %" is channel width of the breakout area. calculated using highest/lowest of last 300 bars.
"Minimum Number of Tests" is the minimum number of tests that the Price tried to break the S/R level
and some options for coloring and linestyle
Lets see some examples:
in this example "Minimum Number of Tests" is 2 so the Price must have tested to break resistance area 2 times and then it breaks it as seen in the screenshot:
in following example Threshold rate is %10, so the channel width is very big:
as you can see in followinf screenshot you can choose different colors and line styles:
Alerts added ;)
Enjoy!

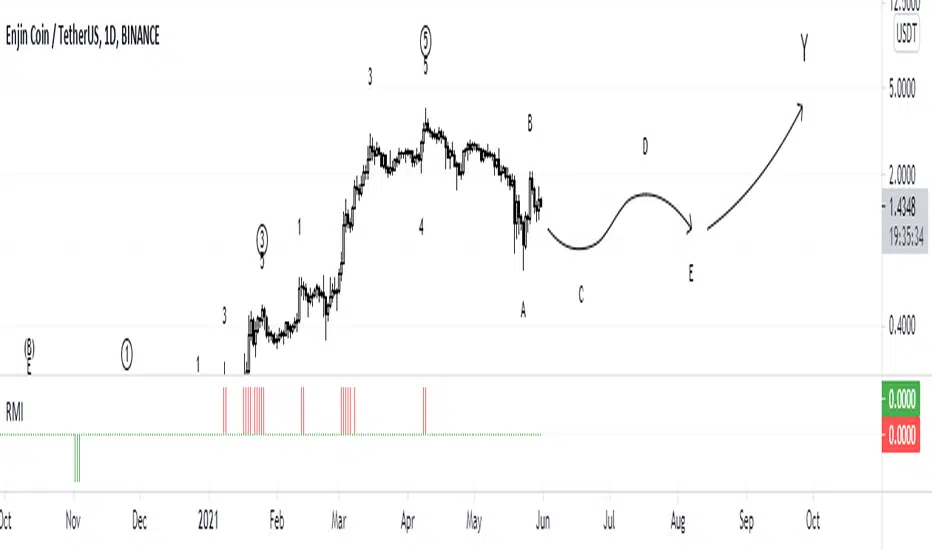
RMIRMI is a combination of RSI and MFI oscillators which considers money flow and strength of supply or demand together.
It estimates that the money of which side is being ran out.
So the power of trends can be predictable approximately.
Where the green columns appear, it means demand is very high and it can fall because buyers may withdraw and sell their assets.
And when red columns appear, it means supply is very high and sellers or new buyers may enter into new deals which may increase the price of a asset.
I would be glad if I hear your feedbacks.
Traders Hedge - Pro with AlertsDear Traders,
"You can't connect the dots looking forward; you can only connect them looking backwards. So you have to trust that the dots will somehow connect in your future." ~Steve Jobs
This quote from Steve Jobs, explains the very essence of this indicator.
Trading is Simple, Why make it complicated. ~ Ravi Chandran
The main motto building this Traders Hedge - Pro indicator is to equip retail traders with a multi purpose tool which in itself will act as a complete trading setup.
This indicator will help you in understanding the market structure and planning your possible entries & exits well in advance.
The indicator & setup is independent of time frames & will work for all trading instruments.
Traders Hedge - Pro Indicator with Alerts you can also set Alerts on your favourite scripts and time frames, to get notification when a Demand or a Supply Zone is created or any Price rejection is formed.
List of all the features is provided below.
1. Trade Type - A quick auto setup for Intraday or Swing trades
2. CPR - Identifies the market structure and helps to plan mean reversions trade setups
3. Weekly Support & Resistance - Automatically identifies and displays the higher time frame support & resistance levels
4. Price Action Triggers - Alert with a trigger symbol shown on the respective candle where a possible price reversal is expected
5. Targets - Plots the possible Major & Minor targets, which helps in planning our possible profit booking & stop loss zones
6. Developing Pivots - Plots the price mean reversion zones for the upcoming trading session
7. Supply & Demand Zones - Plots the demand and supply zones by changing the color of the candle
8. Dynamic Dz & Sz Price Tracking - It dynamically identifies and plots the support & resistance levels
9. Opening Range - Plots the identified opening range on the chart
10. PEMA - Helps in visualizing the trend and also acts as a dynamic support & resistance levels
To set Alerts follow the steps provided below.
1. Go to the symbol chart and select the time frame on which you want to set Alerts.
2. Select Alerts Tab and click on Create Alert, shortcut key Alt+A
3. In Condition Select the option “Price Rejection Alerts“ or “Zone Alerts“ for which you want the alerts to be shown
4. In Options, select Once Per Bar Close
5. Select expiry as per your preference or keep it open-ended
6. Select Alerts Actions as per your preference
7. Alert name is optional
8. Default message is “Price Rejection Alerts“ or “Zone Alert” and can be modified
9. Click on Create and in the warning window select Continue Anyway
How to get the indicator:
To know more about the indicator & to download please check the link in the signature below.
Once you have active alert, you will keep getting notification whenever a Price rejection or new Demand / Supply zone gets created in the identified symbol and time frame you have selected.
Please do feel free to use the indicator and give your valuable feed backs which will help me in optimizing it to a great extent.
I would love to thank each of the traders in this Trading View community in helping me improve on my trading skills.
Happy Trading!

LTB Zigzag CirclesHello All,
Today I am here with a new idea and script, " LTB Zigzag Circles ". The idea is to create Circles using last 2 zigzag waves and to catch the breakouts earlier than horizontal lines. if a circle is broken then the script shows entry for Long/Short positions. and if broken circle reappears again then the position is closed. You can change Zigzag period as you wish and see the different results.
Here you can see how the script calculates and draws the Circles:
Below you can see how the script draws part of the circle on each bar:
Optionally the script can show levels:
P.S. I haven't tested it as a strategy, Result and Performance may change by Zigzag period, you need to find best Zigzag period according to your strategy. By the way, my Zigzag Circles idea can be improved, if you have any recommendation let me know please ;)
Enjoy!

Mayfair Supply & Demand Zones 1.0Identifying Supply and Demand zones can be tricky.
Just using price levels can mislead you, so why not include volume ramps to detect zones?
This indicator does it for you. It spots areas where volume has rapidly increased, measures the speed of the increase, and assigns three different levels of importance.
The red areas are the strongest zones, followed by amber, then green, like a traffic light.
The red areas are persisted longer than the amber, which are persisted longer than the green. As the persistence fades, the colour of the zone fades as well.
It is possible to set the levels of all three volume thresholds to suit yourself, as well as the lookback period the script uses to detect volume increases.
In this chart, only very large volume increases are used:
As you can see, the bands are narrower, but we feel the defaults give the best results.

Support Resistance ChannelsHello All,
For Long time I was planning to make Support/Resistance Channels script, finally I had time and here it is.
How this script works?
- it finds and keeps Pivot Points
- when it found a new Pivot Point it clears older S/R channels then;
- for each pivot point it searches all pivot points in its own channel with dynamic width
- while creating the S/R channel it calculates its strength
- then sorts all S/R channels by strength
- it shows the strongest S/R channels, before doing this it checks old location in the list and adjust them for better visibility
- if any S/R channel was broken on last move then it gives alert and put shape below/above the candle
- The colors of the S/R channels are adjusted automatically
You can set/change following settings:
- Pivot Period
- Source : High/Low or Close/Open can be used
- Maximum Channel Width %: this is the maximum channel width rate, this is calculated using Highest/Lowest levels in last 300 bars
- Number of S/R to show : this is the number of Strongest S/R to show
- Loopback Period: While calculating S/R levels it checks Pivot Points in LoopBack Period
- Show S/R on last # Bars: To see S/R levels only on last N bars
- Start Date: the script starts calculating Pivot Point from this date, the reason I put this option is for visuality. Explained below
- You can set colors/transparency
- and You can enable/disable shapes for broken S/R levels
Examples:
You can change colors as you wish:
here " Show S/R on last # Bars " set 100:
Sometimes visuality may corrupt because of old S/R levels, to solve it you need to set "Start Date" in the options to start the script in visual part (last 292 bars)
here in first screenshot it doesn't look good (shrink), then on second screenshot I set the "Start Date" it looks better, if you change time frame don't forget to set it again :)
Enjoy!
