Support/Resistance Touching (Crossing) SignalWhen the price line touches or crosses the Support/Resistance Line, it gives you the signal.
S : Support line touch
R : Resistance Support line touch
The more frequently it crosses Support/Resistance, it is more likely that the price line will changes drastically.
Support

DYNAMIC SUP/RES 1.0Dynamic Support / Resistance Indicator. Good for scalping ranging price action and detecting breakouts.
White area represents current range. Red lines are Stop Loss levels based on range and Risk to Reward ratio of choice.
Free to use for Cryptosurge discord members: discord.gg
Trade safe and DYOR.

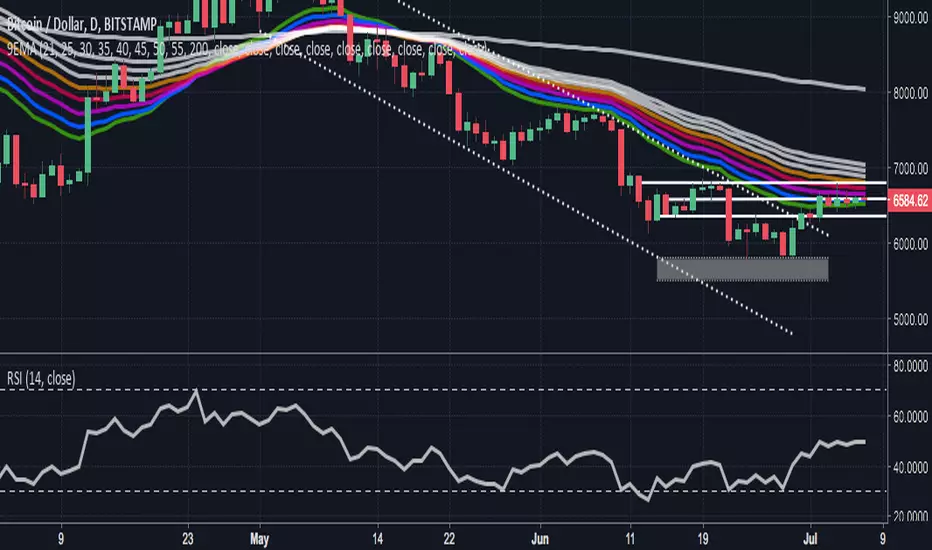
RSI & Volume Based S&R LinesRSI & Volume Based S&R Lines V1.0
Inspired by previous work available on TradingView I wanted to create my own Support & Resistance based indicator to help with confirming signals used with my swing trading tools (also available on TV).
There are two support and resistance lines, one RSI & historic price based and the other based on volume fractals. I've previously used these to help confirm entries previously and the fundamentals behind it are simple but effective.
Access
This indicator is completely free to those part of my discord community
Link: discord.gg

9EMA RibbonUsing 9EMAs a ribbon pattern is created, in order to identify support and resistance points in forming trends, and possible reversal periods.
Linear LevelsThis is a simple indicator that draws linear levels over your price chart.
Enter two price levels and it will draw 10 more levels above/below (depending on the order of Price 1 & Price 2)

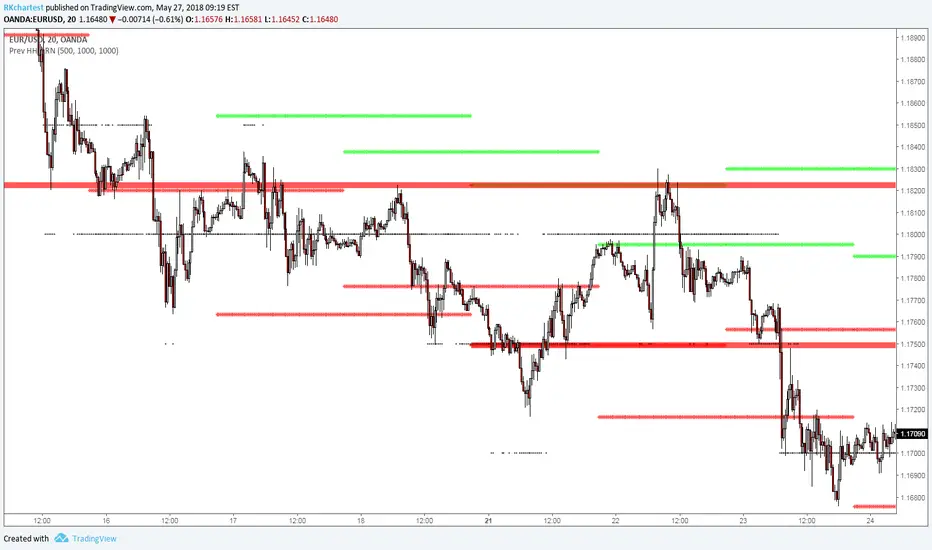
Prev HHLL Round NumbersDisplays previous highs and lows. Added Round numbers.
Modified Chris Moody script.
BottomFinder Adv. Charts SuiteIn development. Will contain over a dozen of the most popular indicators in one script. Save on your indicator space and keep extra slots open for other stuff!
SS EMA / SMA RibbonColor Change if above or below EMAs / Ribbon
StokedStocks EMA / SMA Ribbon 9 20 25 30 35 40 45 50 55 60 65 70 75 80 85 90 95 100 200
EMAs Color Change if above or below EMAs / Ribbon
Lime : Uptrending; Long Bias
Green : Dip Buy / ReEntry or downtrend reversal warning
Red : Downtrend. Short Bias
Maroon : Short Reentry (sell the peak) or uptrend reversal warning
1st strategy Long when Price crosses above all EMAs
2nd strategy if late is buy first or second pullback to 9 or 20 EMA which are the 1st and 2nd ribbon lines (in an uptrend)
3rd strategy is Short once price crosses UNDER all EMAs
Use Trailing stop % once long or short
Better when shorter time frames line up with Longer time Frames for less risk EXAMPLE Above all EMAs on 5min chart and on Daily Chart

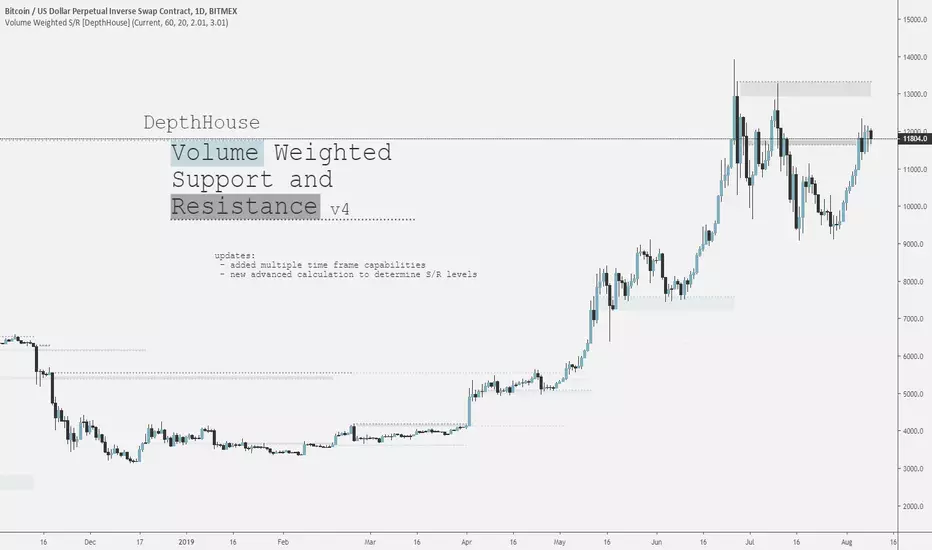
DepthHouse Volume Weighted Support and ResistanceDepthHouse Volume Weighted Support and Resistance or VWSP uses calculations based on volume to determine possible levels of support and resistance.
--Options--
Moving Average Type: The first version supports 4 different moving averages for which the calculation are based upon. SMA (default) EMA, TEMA, DEMA
more of these will be added based on popularity & requests
Factors: The Current version supports up to 3 different factors. This is what gives the VWSR the layering effect.
The defaults are 2,3,4. However please feel free to adjust these to match your trading style.
Fill Debugger: This does nothing other than alters the fill spacing. This is used to to get rid of continuous fills if they ever occur. Does not effect calculations at all.
Try this indicator for FREE! Just leave a comment, or feel free to send me a PM
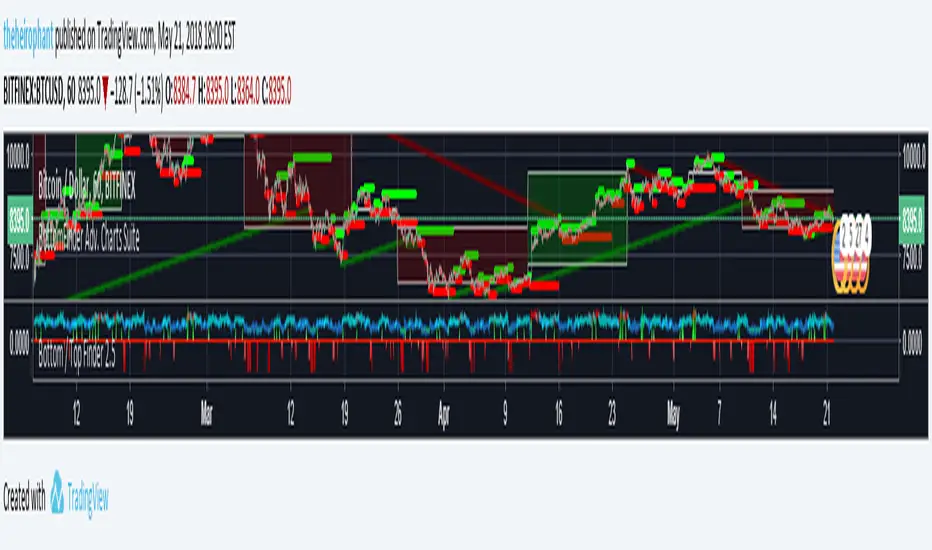
Support & Resistance FilterVisualize support and resistance levels with a high level of user control. Tired of meaningless, tightly clustered, support and resistance lines (shouldn't those just be considered bounces)? Just filter them out with the Bounce Filter. Want to visualize S&R in a crisp, clear new way? Use "Areas of S&R". Want to have a ridiculous amount of control over what counts for support and resistance in the first place? Use the Swing Filter (built-in). Perhaps most interesting... ...want to see support and resistance for (say) Bitfinex-BTC/USD on a Coinbase chart to see how they affect Coinbase candles? Then check out the advanced settings and have fun ;)
Support & Resistance levels are determined by historic pivots (swings). If a price breaks through the first resistance level, it may really take off. If it breaks through the second level, or through all five resistance levels, you might be on your way to the moon (Lambos not included). The inverse is true when the price breaks-down, through support levels.
5 Levels of Support and 5 levels of Resistance are available.
In a very bullish or bearish situation, searching back in time for the next highest Support or Resistance level can become quite demanding on TradingView's server. I've pushed it to the limit:
R2 & S2 look back 1,000 candles
R3 & S3 look back 2,250 candles
R4 & S4 look back 3,500 candles
R5 & S5 look back 4,999 candles
When TradingView's servers are getting a little bogged down, you may get an error about "a loop being longer than 100ms". That just comes with the territory of searching so many candles back. To resolve it, just click "Force Reload" in the settings.
I'd love to post the manual, the instructions for the settings, here in the description, but the publishing policy sets a limit as to how long these descriptions can be. So check the comments for a manual on how to use this indicator. And if you'd like to plug this kind of indicator into your scripts, just contact me for custom work.
~jdhadwin

CryptoShadows V1The first Diagonal Support and Resistance indicator. Best for bitcoin and cryptocurrencies

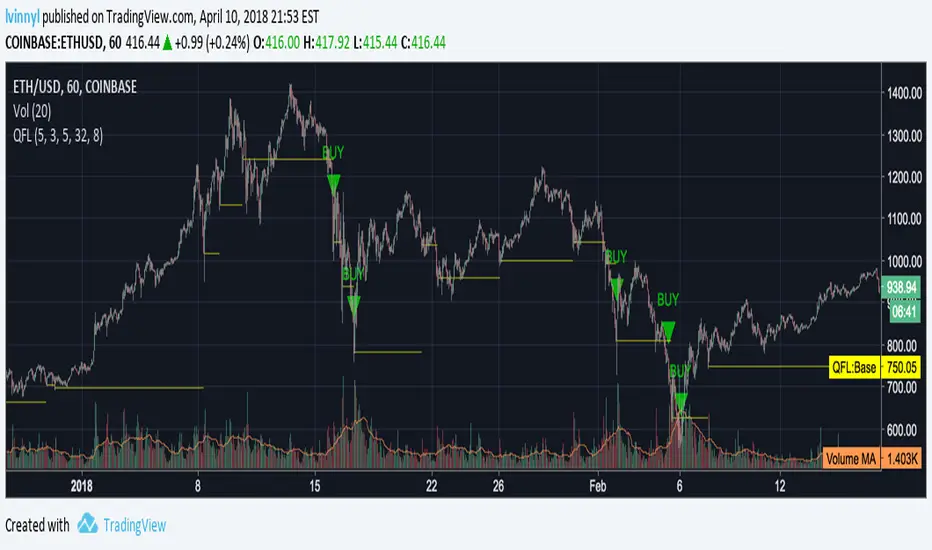
Quickfingers Luc's Base Breaking Indicator v1This script is an attempt to implement Quickfingers Luc's Base Breaking Strategy (steemit.com) where it will detect bases using pivot low detection, panic selling detection (price momentum), RSI and percent below base thresholds to trigger an alert condition.
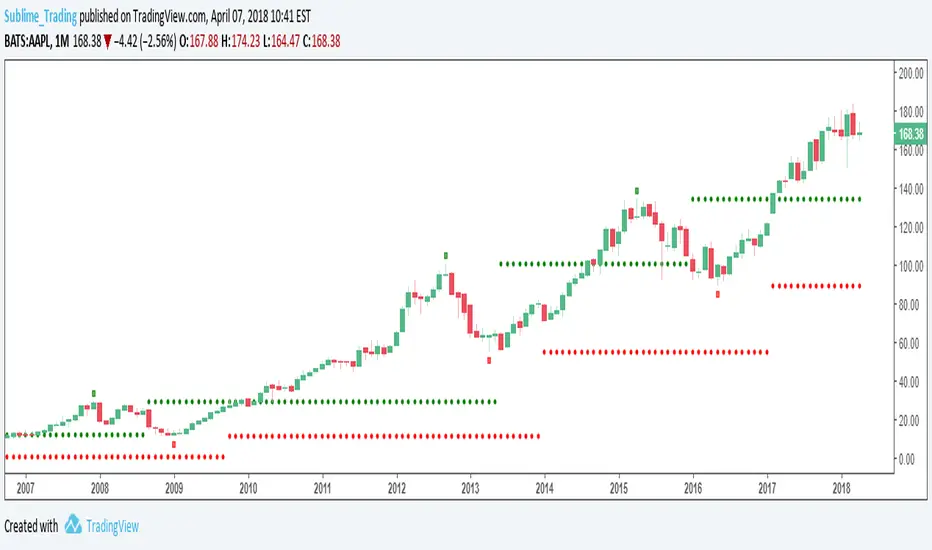
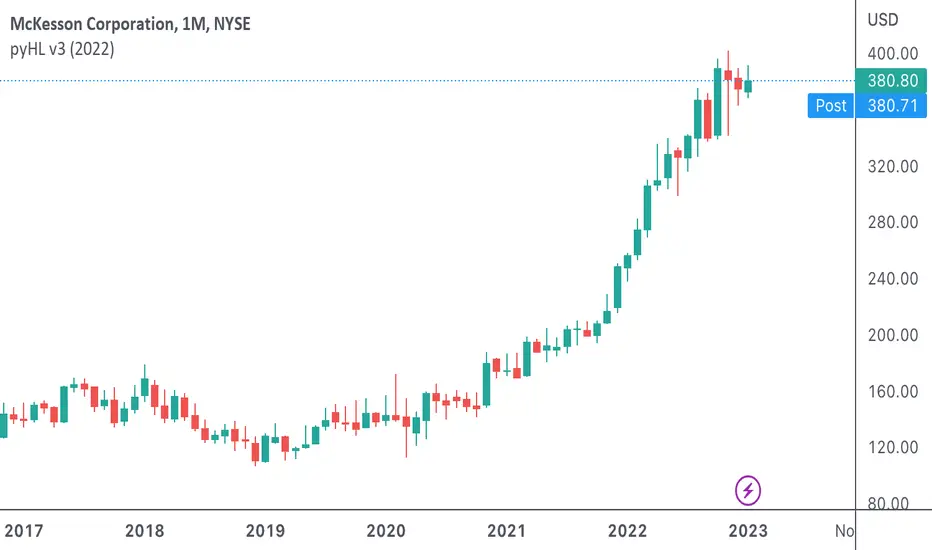
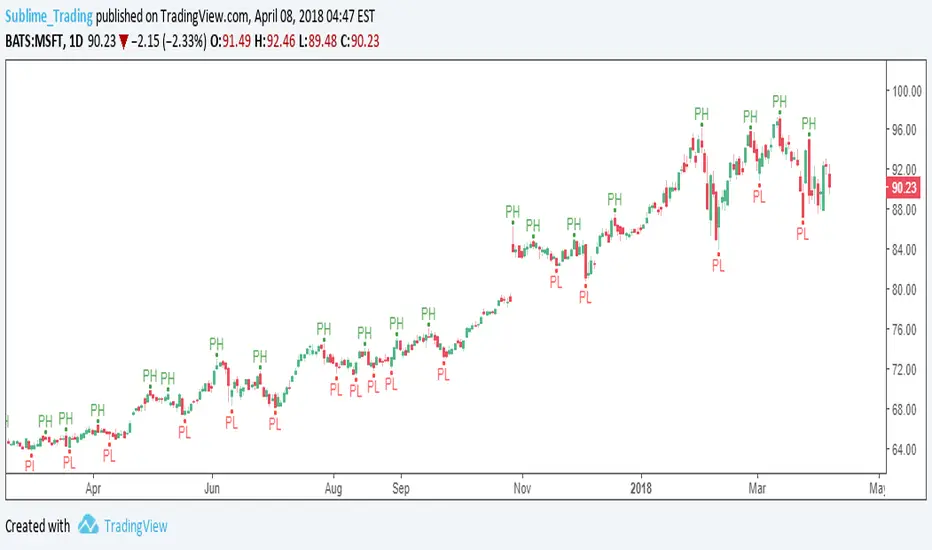
pyHLThis is a customised indicator highlighting key levels of support and resistance on the monthly time frame.
mPiv9 v2This is a customised indicator highlighting key levels of support and resistance on the monthly time frame.

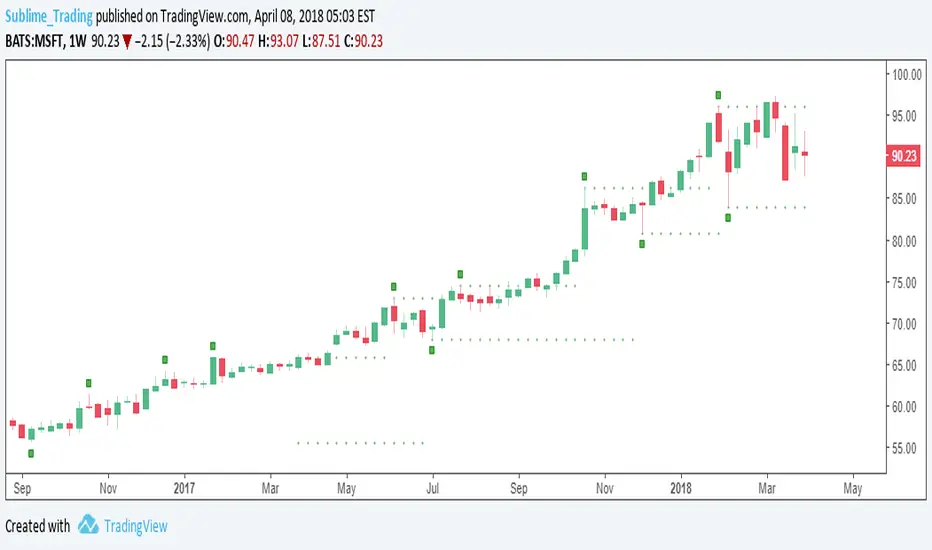
wPiv21This is a customised indicator highlighting key levels of support and resistance on the weekly time frame.

wPiv11This is a customised indicator highlighting key levels of support and resistance on the weekly time frame.
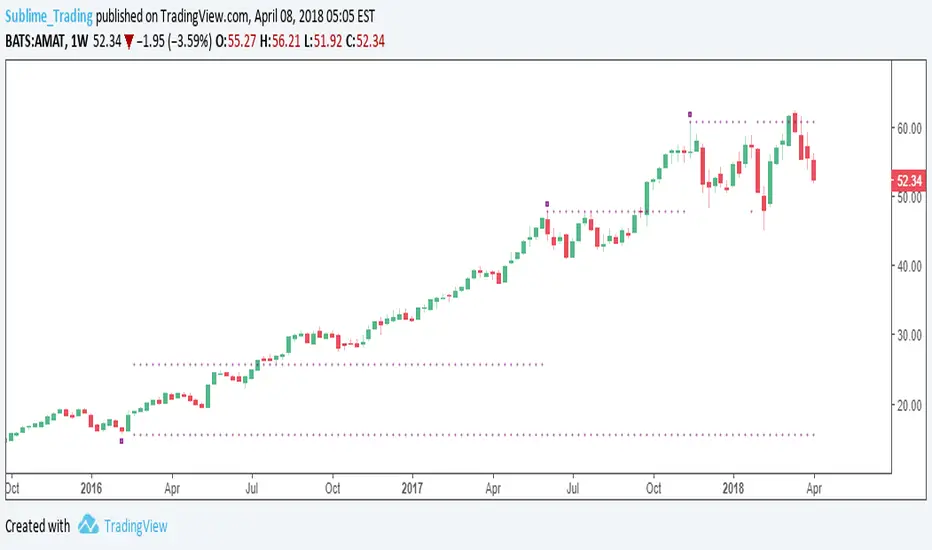
wPiv4This is a customised indicator highlighting key levels of support and resistance on the weekly time frame.
dwPiv21This is a customised indicator highlighting key levels of support and resistance on the daily time frame.
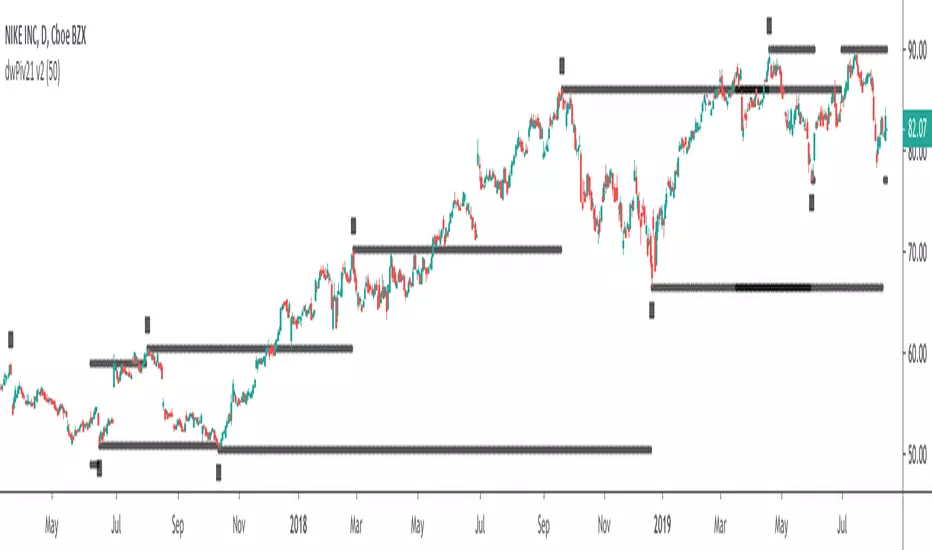
dwPiv11This is a customised indicator highlighting key levels of support and resistance on the daily time frame.
dwPiv4This is a customised indicator highlighting key levels of support and resistance on the daily time frame.

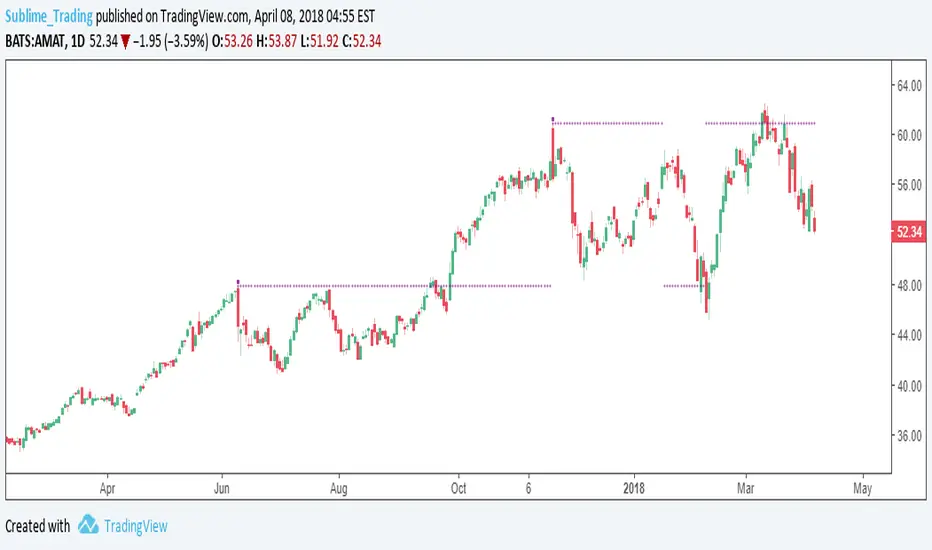
dPiv5This is a customised indicator highlighting key levels of support and resistance on the daily time frame.
mPiv9This is a customised indicator highlighting key levels of support and resistance on the monthly time frame.