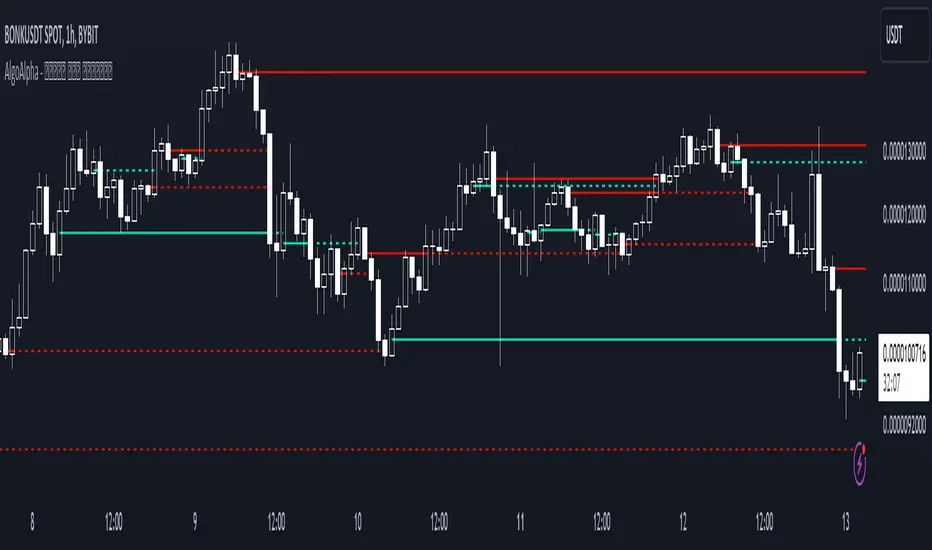
Order Blocks Indicator [TradingFinder] Lightning|CHOCH |OB | BOS🔵 Introduction
In "Price Action," an "Order Block" is essentially an area on the price chart where significant players such as institutional traders have executed their moves by placing noteworthy orders. These points often indicate areas where price either attempts to break through (resistance) or returns when it reaches there (support).
Therefore, when discussing the identification of order blocks, we typically refer to finding points where the price has stalled for a while and has accumulated strength before making a significant move in one direction.
Essentially, order blocks assist traders in understanding where large players with "smart money" have likely placed their bulk orders in the market. Traders use these order blocks as part of their overall analysis to identify probable levels where price may change direction.
This version of the order block indicator is designed for traders, adding many indicators to their charts. The minimal design helps minimize disruptions to user focus.
🔵 Identification of Order Blocks
To identify order blocks, first, a "Level Break" must occur. To identify a "Demand Zone," a "High Level Break" is required, and to identify a "Supply Zone," a "Low Level Break" is needed.
Demand Zone :
Supply Zone :
🔵 "Change of Character" or "Market Shift Structure"
"ChoCh" or "MSS" is the "Break Level" that is contrary to the previous trend. For example, if a "Bearish Level" is established in the market and consecutive "Low Levels" are being broken, the price turns upward, breaking a "High Level." This break is called "ChoCh" or "MSS."
🔵 "Break of Structure"
"Break of Structure," or "BoS" for short, is the "Break Level" in the direction of the current trend. For example, if a "Bullish Level" is established in the market, when the price breaks a "High Level," a "BoS" has occurred.
🔵 Features
🟣 Major Level
This feature helps you easily identify major levels. These levels form when the price breaks another major level.
🟣 Refine Order Block
The "Refinement" feature allows you to adjust the width of the order block based on your strategy. There are two modes, "Aggressive" and "Defensive," in Order Block Refine. The difference between "Aggressive" and "Defensive" lies in the width of the order block. For "Risk Averse" traders, the "Defensive" mode is suitable because it provides smaller stop losses and larger reward-to-risk ratios. For "Risk Taker" traders, the "Aggressive" mode is more suitable. These traders prefer to enter trades at higher prices and this mode, where the width of the order block is greater, is more suitable for this group of individuals.
🔵 How to Use
After adding the indicator to your chart, you will see a visual similar to the image below. Green order blocks are "Demand Zones" and red order blocks are "Supply Zones." The midpoint of the order blocks also indicates 50% of it.
Refine Order Block is defaulted to On and refines the order blocks. If you want the order blocks to remain original, you should set it to Off.
Refine is defaulted to "Defensive" mode. If you want it to be in "Aggressive" mode, you should change its mode through Refine Type.
Displaying "Major Levels" is turned off by default and to display them, you should set "Show High Level" and "Show Low Level" to "Yes." You can use these lines to identify liquidity or determine stop loss and take profit levels.
Supportandresistancezones

GG - LevelsThe GG Levels indicator is a tool designed for day trading U.S. equity futures. It highlights key levels intraday, overnight, intermediate-swing levels that are relevant for intraday futures trading.
Terminology
RTH (Regular Trading Hours): Represents the New York session from 09:30 to 17:00 EST.
ON Session (Overnight Session): Represents the trading activity from 17:00 to 09:29 EST.
IB (Initial Balance): The first hour of the New York session, from 09:30 to 10:30 EST.
Open: The opening price of the RTH session.
YH (Yesterday's High): The highest price during the RTH session of the previous day.
YL (Yesterday's Low): The lowest price during the RTH session of the previous day.
YC (Yesterday's Close): The daily bar close which for futures gets updated to settlement.
IBH (Initial Balance High): The highest price during the IB session.
IBL (Initial Balance Low): The lowest price during the IB session.
ONH (Overnight High): The highest price during the ON session.
ONL (Overnight Low): The lowest price during the ON session.
VWAP (Volume-Weighted Average Price): The volume-weighted average price that resets each day.
Why is RTH Important?
Tracking the RTH session is important because often times the overnight session can be filled with "lies". It is thought that because the overnight session is lower volume price can be pushed or "manipulated" to extremes that would not happen during higher volume times.
Why is the ON Session Important Then?
Just because the ON session can be thought as a "lie" doesn't mean it is relevant to know. For example, if price is stuck inside the ON range then you can think of the market as rotational or range-bound. If price is above the ON range then it can be thought of as bullish. If price is below the ON range then it can be thought as bearish.
What is IB?
IB or initial balance is the first hour of the New York Session. Typically the market sets the tone for the day in the first hour. This tone is similarly a map like the ON session. If we are above the IBH then it is bullish and likely a trend day to the upside. If we are below the IBL then it is bearish and likely a trend day to the downside. If we are in IB then we want to avoid conducting business in the middle of IBH and IBL to avoid getting chopped up in a range bound market.
These levels are not a holy grail
You should use this indicator as guide or map for context about the instrument you are trading. You need to combine your own technical analysis with this indicator. You want as much context confirming your trade thesis in order to enter a trade. Simply buying or selling because we are above or below a level is not recommended in any circumstance. If it were that easy I would not publish this indicator.
Adjustments
In the indicator settings you can adjust the RTH, ON, and IB session-time settings. All of the times entered must be in EST (Eastern Standard Time). You may want to do this to apply the levels to a foreign market.
Examples

Liquidity Sweeps [LuxAlgo]The Liquidity Sweeps indicator detects the presence of liquidity sweeps on the user's chart, while also providing potential areas of support/resistance or entry when Liquidity levels are taken.
In the event of a Liquidity Sweep a Sweep Area is created which may provide further areas of interest.
🔶 USAGE
A Liquidity Sweep occurs when the price breaks through a liquidity level (further referred to as LqL ), after which the price returns below/above the liquidity level , forming a wick.
The script provides 2 options when this can happen:
A wick passes a LqL after which the price quickly returns.
First the closing price breaks through a LqL . After a while, the price retests the LqL and forms a wick in the opposite direction.
The examples above show a bullish and bearish scenario of "a wick passing through an LqL where the price quickly comes back". This type of Liquidity Sweep is represented by a dotted line.
The following example shows a broken LqL , where the price retests the Liquidity zone and bounces back.
Instead of a dotted line, this type of Liquidity Sweep is represented by a dashed line.
When a Liquidity Sweep takes place, this is indicated by highlighting the "wick- LqL " distance. This distance is also the basis for the Sweep Area (see next sub-section). A small 3-bar long dotted line starts from the opposite wick as an extra aid to determine potential support/resistance/entry, ...
Colors can be set in the settings (here yellow and aqua blue instead of default colors for clarity).
🔹 Sweep Areas
The distance between the LqL and the maximum limit of the wick forms a Sweep Area , which can provide a potential support/resistance or entry zone.
These examples show both types of Liquidity Sweeps , followed by a box indicating the Sweep Area .
When the Sweep Area is mitigated or a certain amount of bars has passed (Settings - 'Max bars'), the boxes will no longer be updated.
In this case, the 'Trigger' label shows the bar where the high crossed a LqL , after which a red box starts between LqL and high.
The low of the 'Trigger' bar is the starting point of a short dotted line. Next to the 'Trigger bar' the high touches the Sweep Area before returning, providing a potential short entry. One bar further, another entry opportunity presents itself when the price breaks the small dotted line.
In the following bullish example, not only do we see opportunities when the LqL has been swept, but the following Sweep Area provides some potential entries.
The small green dotted lines also act as a guide where the price breaks above, then forms a small range, after which the price continues in an upward direction.
Here, the initial trigger on the left forms a Sweep Area that is quickly broken. However, the small green line provides a potential entry area later on. The price moves in a short channel before breaking above the LqL (green dashed line), providing more potential entries. Price retests this LqL , and goes below this level. The price remained around the previously formed channel, after which the price resumed its upward trend.
🔶 SETTINGS
🔹 Liquidity Sweeps
Swings: Period used for the swing detection, with higher values returning longer term Liquidity Levels .
Options:
- Only Wicks: Only detects a Liquidity Sweep when a wick sweeps a previous wick
- Only Outbreaks & Retest: Only detects a Liquidity Sweep when the price breaks a Liquidity Level , returns & retests the Liquidity Level , and forms a wick in the opposite direction.
- Wicks + Outbreaks & Retest: Both options can be detected.
🔹 Sweep Area
Extend: Enables/Disables extension of the Sweep Area boxes.
Max Bars: Limit the extension to a certain number of bars.
Color Sweep Area box.

Inversion Fair Value Gaps (IFVG) [LuxAlgo]The Inversion Fair Value Gaps (IFVG) indicator is based on the inversion FVG concept by ICT and provides support and resistance zones based on mitigated Fair Value Gaps (FVGs).
🔶 USAGE
Once mitigation of an FVG occurs, we detect the zone as an "Inverted FVG". This would now be looked upon for potential support or resistance.
Mitigation occurs when the price closes above or below the FVG area in the opposite direction of its bias.
Inverted Bullish FVGs Turn into Potential Zones of Resistance.
Inverted Bearish FVGs Turn into Potential Zones of Support.
After the FVG has been mitigated, returning an inversion FVG, a signal is displayed each time the price retests an IFVG zone and breaks below or above (depending on the direction of the FVG).
Keep in mind how IFVGs are calculated and displayed. Once price mitigates an IFVG, all associated graphical elements such as areas, lines, and signals will be deleted.
This indicator is not meant to be just a 'signal indicator'. Backtesting historical signals is incorrect as it does not consider the mitigation of IFVGs, which is a standard method for trading IFVGs & various concepts by ICT.
The signals displayed are meant for real-time analysis of current bars for discretionary analysis. Current confirmed retests of unmitigated IFVGs are still displayed to show which IFVGS have had significant reactions.
🔶 SETTINGS
Show Last: Specifies the number of most recent FVG Inversions to display in Bullish/Bearish pairs, starting at the current and looking back. Max 100 Pairs.
Signal Preference: Allows the user to choose to send signals based on the (Wicks) or (Close) Prices. This can be changed based on user preference.
ATR Multiplier: Filters FVGs based on ATR Width, The script will only detect Inversions that are greater than the ATR * ATR Width.
🔶 ALERTS
This script includes alert options for all signals.
🔹 Bearish Signal
A bearish signal occurs when the price returns to a bearish inversion zone and rejects to the downside.
🔹 Bullish Signal
A bullish signal occurs when the price returns to a bullish inversion zone and bounces out of the top.

ATR Based Support and Resistance Zones [UAlgo]🔶 ATR Based Support and Resistance Indicator 🔶
The ATR Based Support and Resistance Indicator is a technical tool designed for TradingView users to analyze and visualize support and resistance levels based on the Average True Range (ATR) indicator. ATR is a widely used volatility indicator that measures the average trading range of an asset over a specified period. This indicator utilizes ATR values to dynamically calculate and display support and resistance zones on the price chart.
🔶 Indicator Settings
ATR Length: This setting allows users to specify the length of the period over which the ATR indicator is calculated. A longer period results in a smoother ATR value, providing a broader view of market volatility.
ATR Multiplier: The ATR multiplier enables users to adjust the sensitivity of the support and resistance zones. Increasing the multiplier widens the zones, while decreasing it narrows them, allowing traders to customize the indicator according to their trading preferences and market conditions.
🔶 Key Features
Trend Identification: The indicator identifies potential support and resistance zones based on the relationship between the ATR values and the price action. When the current ATR value exceeds a certain threshold determined by the ATR multiplier, it indicates a significant price movement, potentially signaling a trend reversal or continuation.
Impulse Detection: The indicator detects impulses in price movement by comparing the current ATR value with the previous value. An impulse is identified when the current ATR value is greater than or equal to the previous value, indicating a sudden surge in market volatility.
Bearish Impulse Example :
Bullish Impulse Example:
Color-Coded Impulses: Impulse candles are color-coded for easy visualization of bullish (green) and bearish (red) impulses. This feature helps traders quickly identify potential trading opportunities and market trends.
Wick Percentage Calculation: The indicator calculates the percentage of the wick length relative to the true range of each candle. Users can specify a threshold percentage, and when the wick percentage exceeds this threshold, it indicates a potential support or resistance zone.
Support and Resistance Zones: The indicator plots support and resistance zones based on the calculated wick percentage. These zones are visualized as rectangular boxes on the price chart, highlighting areas where price reversals or significant price movements are likely to occur.
Customizable Styling: Users can customize the styling of support and resistance zones, including line style, width, border color, and background color. This flexibility allows traders to adapt the indicator's visual appearance to their personal preferences and trading strategies.
🔶 Usage
Traders can utilize the ATR Based Support and Resistance Indicator in various ways :
Trend Direction Analysis: By observing the color-coded impulse candles, traders can identify the prevailing trend direction (bullish or bearish) based on the frequency and magnitude of impulses.
Entry and Exit Signals: Traders can use the detected support and resistance zones as potential entry and exit points for their trades. When price approaches these zones, it may indicate a trading opportunity or signal the need to adjust stop-loss or take-profit levels.
Confirmation Tool: The indicator serves as a confirmation tool for identifying potential reversal or continuation signals in conjunction with other technical indicators or trading strategies.

Hedge Coin M - Statistical Support and ResistanceHedge Coin M - Statistical Support and Resistance
Introduction
"Hedge Coin M - Statistical Support and Resistance" is a sophisticated, statistically-driven indicator designed specifically for traders in the COIN-M market on Binance. It offers a nuanced approach to identifying key market levels, focusing on the dynamics of support and resistance through advanced volatility analysis.
Foundation and Credits:
This script is an advanced adaptation of TradingView's standard code for the Bollinger Bands indicator. It extends the foundational concept of Bollinger Bands by integrating additional volatility metrics.
Calculation Method
This indicator employs Volume Weighted Moving Averages (VWMA) to create two distinct sets of Bollinger Bands, named BB-a and BB-b.
BB-a is derived from the VWMA of high prices, targeting potential resistance levels.
BB-b is based on the VWMA of low prices, aimed at identifying critical support levels.
Users can independently adjust the standard deviation (SD) multipliers for the upper and lower bands of both BB-a and BB-b, accommodating different market conditions.
Enhanced Volatility Analysis
The indicator calculates additional standard deviation lines for the upper band of BB-a and the lower band of BB-b. These lines provide deeper insights into market volatility.
Plotted Graphs
The primary plots include the upper and lower bands of BB-a and BB-b, marked in distinct colors for clarity.
Additional SD lines are plotted to indicate potential extended levels of support and resistance, offering traders a broader view of possible market movements.
Purpose and Usage
"Hedge Coin M - Statistical Support and Resistance" is designed to provide traders with a consistent, statistical method for identifying significant price levels.
It aids in scaling entry into positions, helping traders to navigate the COIN-M market with more informed decision-making.
This tool is especially useful for traders who combine long-term holding with swing trading strategies, offering a balanced approach to market engagement.
Integration and Adaptation
Easily integrate this indicator into your TradingView chart for the COIN-M market.
Use the insights provided to complement your overall trading strategy, particularly in identifying and reacting to significant market movements.
Disclaimer
Important Note: This indicator is provided for informational purposes only. It does not constitute financial advice, investment advice, trading advice, or any other sort of advice. Trading decisions should be made based on your own analysis, prudence, and judgment. Please be aware of the risks involved in trading and consult a financial advisor if necessary.

Support and Resistance (MTF) | Flux Charts💎 GENERAL OVERVIEW
Introducing a groundbreaking support and resistance indicator designed to revolutionize your trading experience on TradingView! This innovative tool operates across three distinct timeframes, offering a comprehensive view of market dynamics to help you make informed trading decisions.
The indicator offers a large variety of features :
Select Up To 3 Timeframes
Select Strength Of Supports & Resistances
Select Between Zones & Lines
Show Breaks & Restests
Break & Retest Alerts
Avoid False Breaks
Inverse Color After Broken
Expand Lines & Zones
🚩UNIQUENESS
What sets this indicator apart is its ability to seamlessly integrate and analyze support and resistance levels across multiple timeframes simultaneously. By combining data from three different timeframes, this indicator provides a holistic perspective on market trends and key levels. The adaptive nature of this tool ensures a dynamic assessment of support and resistance zones, empowering traders to adapt to changing market conditions efficiently.
⚙️SETTINGS
1. General Configration
Support & Resistance Count -> Select between 1-3 support & resistance zones for each timeframe.
Pivot Range -> The pivot range is taken into calculations when finding high & low pivots in the chart. Increase if you need a more general look at the support & support zones, or decrease if you need a more detailed look.
Strength -> The strength of the support & resistance zones are determined by how many times the price touched the zone in the past. You can increase the strength up to 4.
Expand Lines & Zones -> If enabled, the support & resistance zones will be expanded to both left and right infinitely. If disabled, the support & resistance zones will be clamped between the time they are first seen, and the time they become broken.
2. Support & Resistance Zones
Enable Zones -> The support & resitsance lines will be converted to zones if enabled.
Zone Width -> The width of the zones. 1 -> %0.05, 2 -> %0.06, 3 -> %0.075.
3. Timeframes
Enable & Disable up to 3 different timeframes using the checkboxes. You can set the timeframes using the selectboxes.
4. Breaks & Retests
Show Breaks -> Points the break points with a blue label with the text "B" on it.
Show Retests -> Points the times when the support & resistance zones are being retested in the current chart.
Avoid False Breaks -> If enabled, the algorithm will try to avoid false break points by comparing the average volume of the point to a longer average volume.
Break Volume Threshold % -> If "Avoid False Breaks" option is enabled, the average volume of the break point should surpass the general average volume by this percent. Higher values mean it's less likely to be a break.
Inverse Color After Broken -> As broken support & resistance zones often become resistance & support zones respectively, if you enable this option the broken zones will inverse their color.
5. Alerts
To make the alerts work, you'll need to add an alert to the chart using the TradingView® alert feature.
Enable Retest Alerts -> You will receive alerts when restests happen on any of the support & resistance zones. "Show Retests" option needs to be enabled to get alerts of this category.
Enable Break Alerts -> You will receive alerts when breaks happen on any of the support & resistance zones.

Peak & Valley Levels [AlgoAlpha]The Peak & Valley Levels indicator is a sophisticated script designed to pinpoint key support and resistance levels in the market. By utilizing candle length and direction, it accurately identifies potential reversal points, offering traders valuable insights for their strategies.
Core Components:
Peak and Valley Detection: The script recognizes peaks and valleys in price action. Peaks (potential resistance levels) are identified when a candle is longer than the previous one, changes direction, and closes lower, especially on lower volume. Valleys (potential support levels) are detected under similar conditions but with the candle closing higher.
Color-Coded Visualization:
Red lines mark resistance levels, signifying peaks in the price action.
Green lines indicate support levels, representing valleys.
Dynamic Level Adjustment: The script adapts these levels based on ongoing market movements, enhancing their relevance and accuracy.
Rejection Functions:
Bullish Rejection: Determines if a candlestick pattern rejects a level as potential support.
Bearish Rejection: Identifies if a pattern rejects a level as possible resistance.
Usage and Strategy Integration:
Visual Aid for Support and Resistance: The indicator is invaluable for visualizing key market levels where price reversals may occur.
Entry and Exit Points: Traders can use the identified support and resistance levels to fine-tune entry and exit points in their trading strategies.
Trend Reversal Signals: The detection of peaks and valleys serves as an early indicator of potential trend reversals.
Application in Trading:
Versatile for Various Trading Styles: This indicator can be applied across different trading styles, including swing trading, scalping, or trend-following approaches.
Complementary Tool: For best results, it should be used alongside other technical analysis tools to confirm trading signals and strategies.
Customization and Adaptability: Traders are encouraged to experiment with different settings and timeframes to tailor the indicator to their specific trading needs and market conditions.
In summary, the Peak & Valley Levels by AlgoAlpha is a dynamic and adaptable tool that enhances a trader’s ability to identify crucial market levels. Its integration of candlestick analysis with dynamic level adjustment offers a robust method for spotting potential reversal points, making it a valuable addition to any trader's toolkit.
VIX based LevelsSupport and resistance levels for the day based on the volatility index.
Major - The Major support line where the day low, high or close can occur at that level
Minor - The second level of the Support/Resistance line , where we can expect some rejections or breakouts/breakdowns
Mild - The mid level between the Major and minor levels. The market may consolidate around that area.
The script will automatically get the previous day close value of the current scrip and the India vix.
India vix is calculated based on the annual percentage and hence the previous day close value of the scrip is divided by 19.1 ( square root of 365 )
The PDC values can be manually overridden for backtesting purposes.
Please note, there will be some slippages involved on the trend lines.

buy/sell signals with Support/Resistance (InvestYourAsset) 📣The present indicator is a MACD based buy/sell signals indicator with support and resistance, that can be used to identify potential buy and sell signals in a security's price.
📣It is based on the MACD (Moving Average Convergence Divergence) indicator, which is a momentum indicator that shows the relationship between two moving averages of a security's price.
📣 The indicator also plots support and resistance levels, which can be used to confirm buy and sell signals. The support and resistance can also be used as a stoploss for existing position.
👉 To use the indicator, simply add it to your trading chart. The indicator will plot three sections:
📈 Price and Signals: This section plots the security's price and the MACD buy and sell signals.
📈 MACD Oscillator: This section plots the MACD oscillator, which is a histogram that shows the difference between the two moving averages.
📈 Moving Averages: This section plots the two moving averages that the MACD oscillator is based on.
📈 Support and Resistance: This section plots support and resistance levels, which are calculated based on the security's recent price action.
👉 To identify buy and sell signals, you can look for the following:
📈 Buy signal: When shorter Moving Average crosses over longer Moving Average.
📈 Sell signal: When shorter moving average crosses under longer moving average.
📈 You can also look for divergences between the MACD oscillator and the security's price. A divergence occurs when the MACD oscillator is moving in one direction, but the security's price is moving in the opposite direction. Divergences can be a sign of a potential trend reversal.
👉 To confirm buy and sell signals, you can look for support and resistance levels take a look at below snapshot. If a buy signal occurs at a support level, it is a stronger signal than if it occurs at a random price level. Similarly, if a sell signal occurs at a resistance level, it is a stronger signal than if it occurs at a random price level.
⚡ Here is a example of how to use the indicator to identify buy signal:
☑ Add the indicator to your trading chart.
☑Look for a buy signal when short MA crosses over Long MA.
☑Look for the buy signal to occur at a support level.
☑Enter a long position at the next candle.
☑Place a stop loss order below the support level.
☑Take profit when the MACD line crosses below the signal line, or when the security reaches a resistance level.
⚡ Here is an example of how to use the indicator to identify a sell signal:
☑Add the indicator to your trading chart.
☑Look for a sell signal, when shorter moving average crosses under longer moving average.
☑Look for the sell signal to occur at a resistance level.
☑Enter a short position at the next candle.
☑Place a stop loss order above the resistance level.
☑Take profit when the MACD line crosses above the signal line, or when the security reaches a support level.
✅Things to consider while using the indicator:
📈Look for buy signals in an uptrend and sell signals in a downtrend. This will increase the likelihood of your trades being successful.
📈Place your stop losses below the previous swing low or support for buy signals and above the previous swing high or resistance for sell signals. This will help to limit your losses if the trade goes against you.
📈Consider taking profits at key resistance and support levels. This will help you to lock in your profits and avoid giving them back to the market.
Follow us for timely updates regarding indicators that we may publish in future and give it a like if you appreciate the indicator.

Breakout/Breakdown Indicator (30 Min Range) by InvestYourAsset👉The indicator provided here is a technical analysis indicator for TradingView users that identifies potential breakout and breakdown opportunities on the initial 30-minute range in every trading session.
👉The indicator high and low of the initial 30-minute period and plotting them as horizontal lines on the chart. The high is marked in green line and the low is marked in red line.
📈The indicator then generates buy and sell signals based on whether the current close price crosses above or below the previous 30-minute high and low, respectively.
📢The indicator also has two inputs:
👉 sessionStartHour : The hour at which the trading session begins. The default value is 9, However users can change the time according to their own trading style.
👉 sessionStartMinute : The minute at which the trading session begins. The default value is 0.
These inputs can be used to adjust the indicator to the specific trading session that you are interested in.
✅How to use the Indicator:
👉To use the 30 Minute Breakout/Breakdown Indicator, simply add it to your chart and configure the inputs to your liking. Once the indicator is added to the chart, it will plot the 30-minute high and low as horizontal lines, as well as generate buy and sell signals based on the current close price.
✅Here is a step-by-step guide:
📈Open TradingView and select the chart that you want to add the indicator to.
📈Click on the "Indicators" tab and search for "30 Minute Breakout/Breakdown Indicator by InvestYourAsset".
📈Click on the indicator to add it to your chart.
📈Configure the inputs to your liking. The default values are typically fine, but you can experiment with different values to see what works best for you.
📈Once you are satisfied with the settings, click on the "Apply" button.
📈The indicator will now be displayed on your chart. You will see two horizontal lines representing the previous 30-minute high and low, as well as triangles representing buy and sell signals.
✅How to interpret the signals:
📈Buy signal : A buy signal is generated when the current close price crosses above the previous 30-minute high. This suggests that the price is likely to continue moving higher in the short term.
📈Sell signal : A sell signal is generated when the current close price crosses below the previous 30-minute low. This suggests that the price is likely to continue moving lower in the short term.
👉Traders should remember that the present indicator is just one tool that can be used to identify potential trading opportunities. It is important to use other technical analysis tools and risk management techniques to confirm your trading signals before entering any trades.
✅Things to consider while using the indicator:
📈Look for buy signals in an uptrend and sell signals in a downtrend. This will increase the likelihood of your trades being successful.
📈Place your stop losses below the previous 30-minute low for buy signals and above the previous 30-minute high for sell signals. This will help to limit your losses if the trade goes against you.
📈Consider taking profits at key resistance and support levels. This will help you to lock in your profits and avoid giving them back to the market.
Follow us for timely updates regarding indicators that we may publish in future and give it a like if you appreciate the indicator.

S/R and Reversal BarsToday I'm proposing an idea to form S/R with a slightly different basic idea. This is a combination of CCI and candlestick study, and we will use this to mark possible reversal candles and possible S/R lines.
This is nothing complicated, I've used a basic CCI indicator with certain rules/system to mark S/R levels on the chart. (Have loaded traditional CCI indicator on bottom for comparison)
S/R levels are market as followed
Cross -
Lime = Support
Red = Resistance
Zero/Balance line - Yellow circles
The idea is to use this indicator to trade sideways market more successfully, in trending market this can be futile if you are not waiting for the break-out or breakdowns with confirmation.
Since this is based on CCI, it will give static result only when bar is closed, till then it will be susceptible for repaint. This is inherited nature from CCI readings on current bar. I could change this to only making reading on closed bar (historical bar), but that takes away from the uniqueness of this indicator in giving early indications.
This is a great tool for intraday scalping, but it does work on all timeframes, it's not bound by granularity.
This is for education purpose only.
Past success or seemingly positive results on published posts are not indication of future success.

Volume peak based zonesThis is a simple but effective indicator based on simple volume.
What does this indicator for you:
Zones are drawn on the basis of volume peaks. It is used for this purpose the closing price to the high or to the low depending on the direction of the candle.
How can this be used:
With volume peaks one assumes that a movement has reached your end for the time being or a new movement is initiated.
This cannot be verified by simple volume alone.
If a zone is displayed is now to pay attention to the following:
Narrow zone: indicate when creating mostly a continuation of the trend. Can later, however, be used as support or resistance.
Medium zones: The price is in an accumulation phase. Here is crucial, whether a candle with increased volume (preferably above the volume SMA) arises and the high or the low of the zone by closing price leaves. Accordingly, a short or long position can be taken. As SL, the high or low of the zone or the candle itself can be used.
Large zones: The high and low of the zone indicate a range in which the price will stay in the near future. The low or the high can be used as a once if the price does not leave the zone despite high volume at the close.
Otherwise, this can be interpreted as a breakout.
Principles of Volume:
Rising Volume at Rising Price = Intact Trend
Rising Volume at Falling Price = Intact Trend
Falling volume at rising price = correction movement
Falling volume at falling price = correction movement
Have Funn!!

TrendLine CrossThis indicator "TrendLine Cross", is designed to plot trend lines so you can spot potential trend reversal points on the charts. The main function is to draw several lines on the chart and identify the crossings between these lines, which can be significant indicators for trading. The lines are based on different periods which can be changed in the settings tabs.
Let's see the characteristics of the trend lines:
_Low Line Color(Green Line): This line connects the lowest point of low prices in the "low_time" period with the lowest point of low prices in the "high_time" period. Indicates a possible short-term support level on the chart.
_Liquidity Up Line Color (Golden Line): This line connects the lowest point of low prices in the "low_time" period with the highest point of low prices in the same period. It represents a liquidity zone and an important resistance in the chart.
_Lower Line Color (Blue Line): This horizontal line connects the lowest point of low prices in the "LowerLine_period" with the lowest point of low prices in the "high_time" period. Indicates a possible long-term support level.
_Upper Line Colorr: This line represents a connection between the highest points of the "high_time" period and the lowest point of the "LowerLine_period". Indicates a possible long-term resistance level.
_Up Line Color (Red Line): This line connects the highest point of high prices in the "high_time" period with the highest point of high prices in the "LowerLine_period". It represents a possible long-term resistance level.
_Liquidity Down Line Color(Golden Line): This line connects the highest point of high prices in the "high_time" period with the highest point of low prices in the "low_time" period. It represents a liquidity point and an important support zone.
The indicator becomes particularly interesting when the lines make crossings. These crossovers could suggest a potential trend change in the market. For example:
Change from Bearish to Bullish: If the "long-term" line (black) crosses the "short- or long-term" line (green or blue) from top to bottom, it could indicate a shift from a bearish to a bullish market , suggesting the opportunity for long positions.
_Changing from Bullish to Bearish: If the "long-term" line (blue) crosses the "short-term" line (red or black) from bottom to top, it could indicate a shift from a bullish to a bearish market, suggesting the opportunity for short positions.
Generally speaking, crossings between these lines can be key points of interest for traders, as they can signal significant changes in price direction.

Donchian MA Bands [LuxAlgo]The Donchian MA Bands script is a complete trend indicator derived from the popular Donchian channel indicator as well as various customizable moving averages to estimate trend direction and build support/resistance levels & zones.
🔶 USAGE
The indicator outputs various elements, the main ones being a lower dynamic zone (blue by default), an upper dynamic zone (in orange by default), and one support and resistance level/zones (red/green by default).
A prominent lower zone is indicative of an uptrend, while a prominent upper zone is indicative of a downtrend. These zones can be used as support/resistance as well.
Support/resistance zones and levels can be used using a breakout methodology or to determine price bounced if a level was tested multiple times.
The indicator contains various modes affecting the output of the indicator, described below.
🔹 Clouds
Clouds return one upper/lower dynamic zone and look/act similarly to a trailing stop. Price over the lower zone is indicative of an uptrend, and price under the upper zone is indicative of a downtrend.
🔹 Upper Band
The upper band mode returns a dynamic zone closer to prices during an uptrend, and farther away during a downtrend.
This band can act as a support during uptrends.
🔹 Lower Band
The lower band mode returns a dynamic zone closer to prices during an uptrend, and farther away during a downtrend.
This band can act as a resistance during downtrends.
🔹 Bands
Bands return both upper and lower zones, the zones are more apparent depending on the price trend direction, with uptrends being indicated by a more visible lower zone, and downtrends being indicated by a more visible upper zone.
Breakout dots are highlighted when price breakout the indicator displayed extremities, and can be indicative of a confirmed trend reversal.
These breakouts can be more effective for trend following during trending markets. Ranging markets might return breakouts highlighting the top/bottom.
🔶 DETAILS
The core of this script is the highest / lowest mean average (MA) value for a given number of bars back ( Donchian lines).
This is repeated a few times with the obtained values.
When Bands are chosen ( Style ) this will be repeated 1 more time.
The type of mean average can be customized ( Type MA ), as well as the number of bars back ( Length ).
Depending on the choice of bands ( Style ) the script will focus on certain area's of interest.
When the option Clouds , Upper band or Lower band is chosen, an extra feature, support/resistance (S/R), will be shown.
These color-filled areas are visible when there is a difference between the 2nd and 3rd highest/lowest values.
The lines/areas can be used for stop loss, entry, exit,...
You can set the type of MA and Length separately ( Settings -> S/R ).
If you don't need this feature, simply set Type ( Settings -> S/R ) -> NONE
The shape sometimes resembles triangles, indicating a potential direction
Default the average of the highest and lowest values is plotted (Style -> Mid Donchian)
This can act as potential support/resistance or visualization of the trend, the mean average is not plotted but can be (Style -> MA)
🔹 Note
When the option Bands is chosen, an indication is plotted when the closing price breaks above the highest band or breaks below the lower band. This isn't necessarily a buy/sell signal, it is merely a signal that these lines are broken.
Users should decide on their own how they use the bands/lines/areas as entry, exit, trailing stop, stop loss, profit taking,...
🔶 SETTINGS
🔹 Bands
Style: Clouds (default), Upper band, Lower band, Bands
Type MA: choose between SMA, EMA, RMA, HullMA, WMA, VWMA (default), DEMA, TEMA, NONE (off)
Length: Length of moving average and Donchian calculations (default 20)
Colour Bands
🔹 S/R (Support/Resistance, visible with Clouds, Upper band or Lower band)
Type MA: choose between SMA, EMA, RMA, HullMA, WMA, VWMA (default), DEMA, TEMA, NONE (off)
Length: Length of moving average and Donchian calculations (default 20)
Colour S/R

Range Detector [LuxAlgo]The Range Detector indicator aims to detect and highlight intervals where prices are ranging. The extremities of the ranges are highlighted in real-time, with breakouts being indicated by the color changes of the extremities.
🔶 USAGE
Ranging prices are defined by a period of stationarity, that is where prices move within a specific range.
Detecting ranging markets is a common task performed manually by traders. Price breaking one of the extremities of a range can be indicative of a new trend, with an uptrend if price breaks the upper range extremity, and a downtrend if price breaks the lower range extremity.
Ranges are highlighted as zones and are set retrospectively, that is the starting point of a range is offset in the past. The exact moment a range is detected is highlighted by a gray background color. The average between the maximum/minimum of a zone is also highlighted as a dotted line and is also set retrospectively.
The range extremities are set in real-time, blue extremities indicate the range extremities were not broken, green extremities indicate that price broke the upper range extremity, while red extremities indicate price broke the lower range extremity.
Extremities are extended until a new range is detected, allowing past ranges extremities can be used as future support/resistances.
🔶 DETAILS
The detection algorithm used to detect ranges tests if all the prices within a user-set window are all within two extremities. These extremities are determined by the mean of the detection window plus/minus an ATR value.
When a new range is detected, the script checks if this new range overlaps with a previously detected range, if this is the case, both ranges are merged into one; updating the extremities of the previous range.
This can be observed with the real-time extremities changing within a highlighted zone.
🔶 SETTINGS
Minimum Range Length: Minimum amount of bars needed to detect a range.
Range Width: Multiplicative factor for the ATR used to detect new ranges. Lower values detect ranges with a lower width. Using higher values might return false positives.
ATR Length: ATR length used to determine the range width.

Histogram-based price zonesThis indicator provides a new approach to creating price zones that can be used as support and resistance. The approach does not use pivot points or Fibonacci levels. Instead, it uses the frequency of occurence of local maxima and minima to determine zones of interest where price often changed direction.
The algorithm is as follows:
- Gather price data from the last Lookback trading periods
- Calculate rolling minima and rolling maxima along the price points with window size Window size
- Build a histogram from the rolling extrema which are binned into different zones. The number of bins and therefore the width of a zone can be adjusted with the parameter Zone width factor
- Select only the top fullest bins. The number of bins selected for plotting can be controlled with Zone multiplier
The result are a number of boxes that appear on the chart which mark levels of interest to watch for. You can combine multiple instances of this indicator on different settings to find zones that are very relevant.
Shown as an example is the Nasdaq 100 futures ( NQ1! ) on the D timeframe with levels built from the last 100 periods with default settings. The boxes are the only output of the indicator, no signals are created.

Monthly Range Support & Resistance [QuantVue]The Monthly Range Support & Resistance Levels is an advanced analytical tool designed to assess monthly price movements and provide potential support and resistance levels.
This tool examines the average monthly price fluctuations over the past 7 months (default), and creates support and resistance levels based on the opening price.
The indicator also considers a standard deviation multiplier.
This enables traders and investors to identify potential price zones.
The support and resistance levels are dynamically updated every month.
Users can also choose to view previous daily levels as well.
Customizable settings for this tool include:
-Averaging Period: Adjust the number of months to calculate the average monthly range.
-Standard Deviation Multiplier: Modify the standard deviation multiplier to fine-tune the sensitivity of the support and resistance levels. A higher multiplier will result in wider levels, accommodating higher price fluctuations.
-Toggle Support & Resistance Prices: Easily switch on or off the display of support and resistance price levels.
-Show Monthly Open Line: Display the monthly opening price as a reference point on the chart.
-Show Previous Levels: Choose whether to display past daily support and resistance levels.
Note: this indicator works on a 1 hour timeframe or higher
Give this indicator a BOOST and COMMENT your thoughts!
We hope you enjoy.
Cheers!

Fibonacci Ranges (Real-Time) [LuxAlgo]The "Fibonacci Ranges" indicator combines Fibonacci ratio-derived ranges (channels), together with a Fibonacci pattern of the latest swing high/low.
🔶 USAGE
The indicator draws real-time ranges based on Fibonacci ratios as well as retracements. Breakouts from a Fibonacci Channel are also indicated by labels, indicating a potential reversal.
Each range extremity/area can also be used as support/resistance.
🔶 CONCEPTS
Fibonacci Channels
Latest Fibonacci
Both, Latest Fibonacci and Fibonacci Channels , display different Fibonacci levels (labels not included in the code):
However, the 2 react in a totally different way.
🔹 Fibonacci Channels
2 conditions must be fulfilled until a Fibonacci Channel is displayed:
New swing high/low
close has to be between chosen limits/levels ( Break level )
As visual guidance, chosen Break levels are accentuated by 2 small gray blocks:
Once the channel is displayed, it will remain visible until x consecutive bars break out of the chosen Break level at closing time.
• x consecutive bars is set by Break count .
The amount of breaks is counted in the code. When the price, without breaking the user-set limit, closes back between the 2 levels, the count is reset to 0.
By enabling Channels and Shadows you can see previous channels (" Shadows ", which is always delayed with 1 bar)
Previous channels can be helpful in finding potential support/resistance areas, especially from large channel blocks
The more narrow Break levels are set the less chance the price closes between these 2 levels, and the quicker close breaks out.
In other words, narrow levels give fewer & smaller channels, broader levels give more & larger channels.
Note:
• swing settings: L & R
• Break count (x consecutive bars that close outside chosen levels to invalidate the Fibonacci Channel )
will also be of influence in displaying the channels.
• Show breaks enable you to visualize signals when there is a break:
• Alerts can also be set ( Break Down / Break Up )
🔹 Latest Fibonacci
This displays the Fibonacci levels between the latest swing high and swing low, independently from the Fibonacci Channel .
The Lastest Fibonacci can be helpful in detecting the current trend against the larger Fibonacci Channel .
🔶 SETTINGS
🔹 Swing Settings
L: set left of pivothigh / pivotlow
R: set right of pivothigh / pivotlow
🔹 Fibonacci Channels
Channel : Channel / Channels + Shadows / None
Break level
-0.382 - 1.382
0.000 - 1.000
0.236 - 0.764
0.382 - 0.618
Break count
🔹 Fibonacci
Toggle
Colours: [ -0.382 - 0 ], [ 0.236 - 0.382 ], [ 0.5 ], [ 0.618 - 0.764 ], [ 1 - 1.382 ]

Daily TrendDescription:
The "Daily Trend" script is a powerful technical analysis tool designed for TradingView. This indicator helps traders identify key support and resistance levels based on daily price data. It offers a visual representation of these levels, along with other technical indicators like Exponential Moving Averages (EMA), Supertrend, and Parabolic SAR.
Features:
Past Candle Price Levels: This script calculates and displays past daily candle price levels, including R1, R2, R3, R4, S1, S2, S3, and S4. These levels are vital for identifying potential reversals and breakout points.
Exponential Moving Average (EMA): The script includes an EMA indicator with a customizable period to help traders spot the trend direction and potential crossovers.
Supertrend Indicator: The Supertrend indicator is used to identify trend changes. It plots the Supertrend line and highlights the trend direction with color-coded regions.
Parabolic SAR: The Parabolic SAR indicator is integrated into the script to assist traders in identifying potential entry and exit points in the market.
Customizable Alerts: Traders can customize the indicator by choosing which past candle price levels and other features to display on the chart.
How to Use:
Apply the "Daily Trend" script to your TradingView chart.
Customize the indicator by enabling or disabling specific features, such as past candle price levels and EMA.
Pay attention to the color-coded regions for Supertrend and Parabolic SAR to determine the current trend direction.
Look for potential reversal or bounce signals based on the indicator's signals and the price action.
Consider using this script in conjunction with your trading strategy for enhanced technical analysis.
Risk Warning: Trading involves significant risk, and past performance is not indicative of future results. Always practice proper risk management and consider the broader context of the market before making trading decisions.

Trade Tool VDWMA + OI RSI BasedThis indicator works only for symbols where open interest data is available.
The idea was to create a combination of Volume Delta, Open Interest, RSI, Moving Average and Support / Resistance as a unified tool.
I created a Weighted Moving Average based on the Volume Delta (VDWMA). The idea behind this was to reflect the moving average on the difference between buy and sell volume.
There are two VDWMA to determine a trend. Fast and Slow. The principle is the same as with conventional moving averages. For visualization, the candles are colored based on the following logic:
up trend = Fast VDWMA is above the Slow VDWMA and the price is above the Fast VWDWMA.
down Trend = Fast VDWMA is below the Slow VDWMA and the Short is below the Fast VDWMA
Further, support and resistance zones were defined based on the close and high prices as well as close and low prices.
A simple logic looks for divergences between RSI and price to generate first signals for possible price reversals.
Another RSI was created based on the open interest.
In combination with the conventional RSI, oversold and overbought zones were defined based on the following logic, which are marked by vertical zones on the chart.
Oversold zone = RSI is below 30 and OI RSI is above 70 or below 30 and OI opening is not greater than OI closing price
Overbought zone = RSI is above 70 and OI RSI is above 70 or below 30 and OI opening is not smaller than OI closing price
Based on this, buy and sell signals were defined.
First, the support or resistance zone must remain the same for two candles, which signals that the zone has not been breached. In addition, a divergence must occur in the RSI and the price must bounce.
newsell = resistance == resistance and high >= resistance and close < resistance and bearishDiv
newbull = support == support and low <= support and close > support and bullishDiv
The OI signaling was deliberately not included as well as the trend function. The tool should be suitable for scalping as well as for swinging. Thus, depending on the tradestyle itself to decide which points you want to trade.
Have fun with it
Liquidity Sentiment Profile (Auto-Anchored) [LuxAlgo]
The Liquidity Sentiment Profile (Auto-Anchored) is an advanced charting tool that measures by combining PRICE and VOLUME data over specified anchored periods and highlights the distribution of the liquidity and the market sentiment at specific price levels. This version is a variation of the previously published Liquidity Sentiment Profile , wherewith this version allows users to select a variety of different anchoring periods, such as 'Auto', 'Fixed Range', 'Swing High', 'Swing Low', 'Session', 'Day', 'Week', 'Month', 'Quarter', and 'Year'
Liquidity refers to the availability of orders at specific price levels in the market, allowing transactions to occur smoothly.
🔶 USAGE
A Liquidity Sentiment Profile (Auto-Anchored) is a combination of liquidity and a sentiment profile, where the right side of the profile highlights the distribution of the traded activity at different price levels, and the left side of the profile highlights the market sentiment at those price levels
The liquidity profile is categorized by assigning different colors based on the significance of the traded activity of the specific price levels, allowing traders to reveal significant price levels, such as support and resistance levels, supply and demand zones, liquidity gaps, consolidation zones, etc
The Liquidity Sentiment Profiles aim to present Value Areas based on the significance of price levels, thus allowing users to identify value areas that can be formed more than once within the range of a single profile
Level of Significance Line - displays the changes in the price levels with the highest traded activity (developing POC)
Buyside & Sellside Liquidity Zones - displays Liquidity Levels, also known as Supply and Demand Zones
🔶 SETTINGS
The script takes into account user-defined parameters and plots the profiles, where detailed usage for each user-defined input parameter in indicator settings is provided with the related input's tooltip.
🔹 Liquidity Sentiment Profile
Anchor Period: The indicator resolution is set by the input of the Anchor Period.
Fixed Period: Applicable if the Anchor Period is set to 'Fixed Range' then the period of the profile is defined with this option
Swing Detection Length: Applicable if the Anchor Period is set to 'Swing High' or 'Swing Low' then the length required to detect the Swing Levels is defined with this option which is then used to determine the period of the profile
🔹 Liquidity Profile
Liquidity Profile: Toggles the visibility of the Liquidity Profiles
High Traded Nodes: Threshold and Color option for High Traded Nodes
Average Traded Nodes: Color option for Average Traded Nodes
Low Traded Nodes: Threshold and Color option for Low Traded Nodes
🔹 Sentiment Profile
Sentiment Profile: Toggles the visibility of the Sentiment Profiles
Bullish Nodes: Color option for Bullish Nodes
Bearish Nodes: Color option for Bearish Nodes
🔹 Buyside & Sellside Liquidity Zones
Buyside & Sellside Liquidity Zones: Toggles the visibility of the Liquidity Levels
Buyside Liquidity Nodes: Color option for Buyside Liquidity Nodes
Sellside Liquidity Nodes: Color option for Sellside Liquidity Nodes
🔹 Other Settings
Level of Significance: Toggles the visibility of the Level of Significance Line
Price Levels, Color: Toggles the visibility of the Profile Price Levels
Number of Rows: Specify how many rows each profile histogram will have. Caution, having it set to high values will quickly hit Pine Script™ drawing objects limit and fewer historical profiles will be displayed
Profile Width %: Alters the width of the rows in the histogram, relative to the profile length
Profile Range Background Fill: Toggles the visibility of the Profiles Range
🔶 RELATED SCRIPTS
Liquidity-Sentiment-Profile
Buyside-Sellside-Liquidity
ICT-Concepts

Support and Resistance Signals MTF [LuxAlgo]The Support and Resistance Signals MTF indicator aims to identify undoubtedly one of the key concepts of technical analysis Support and Resistance Levels and more importantly, the script aims to capture and highlight major price action movements, such as Breakouts , Tests of the Zones , Retests of the Zones , and Rejections .
The script supports Multi-TimeFrame (MTF) functionality allowing users to analyze and observe the Support and Resistance Levels/Zones and their associated Signals from a higher timeframe perspective.
This script is an extended version of our previously published Support-and-Resistance-Levels-with-Breaks script from 2020.
Identification of key support and resistance levels/zones is an essential ingredient to successful technical analysis.
🔶 USAGE
Support and resistance are key concepts that help traders understand, analyze and act on chart patterns in the financial markets. Support describes a price level where a downtrend pauses due to demand for an asset increasing, while resistance refers to a level where an uptrend reverses as a sell-off happens.
The creation of support and resistance levels comes as a result of an initial imbalance of supply/demand, which forms what we know as a swing high or swing low. This script starts its processing using the swing highs/lows. Swing Highs/Lows are levels that many of the market participants use as a historical reference to place their trading orders (buy, sell, stop loss), as a result, those price levels potentially become and serve as key support and resistance levels.
One of the important features of the script is the signals it provides. The script follows the major price movements and highlights them on the chart.
🔹 Breakouts (non-repaint)
A breakout is a price moving outside a defined support or resistance level, the significance of the breakout can be measured by examining the volume. This script is not filtering them based on volume but provides volume information for the bar where the breakout takes place.
🔹 Retests
Retest is a case where the price action breaches a zone and then revisits the level breached.
🔹 Tests
Test is a case where the price action touches the support or resistance zones.
🔹 Rejections
Rejections are pin bar patterns with high trading volume.
Finally, Multi TimeFrame (MTF) functionality allows users to analyze and observe the Support and Resistance Levels/Zones and their associated Signals from a higher timeframe perspective.
🔶 SETTINGS
The script takes into account user-defined parameters to detect and highlight the zones, levels, and signals.
🔹 Support & Resistance Settings
Detection Timeframe: Set the indicator resolution, the users may examine higher timeframe detection on their chart timeframe.
Detection Length: Swing levels detection length
Check Previous Historical S&R Level: enables the script to check the previous historical levels.
🔹 Signals
Breakouts: Toggles the visibility of the Breakouts, enables customization of the color and the size of the visuals
Tests: Toggles the visibility of the Tests, enables customization of the color and the size of the visuals
Retests: Toggles the visibility of the Retests, enables customization of the color and the size of the visuals
Rejections: Toggles the visibility of the Rejections, enables customization of the color and the size of the visuals
🔹 Others
Sentiment Profile: Toggles the visibility of the Sentiment Profiles
Bullish Nodes: Color option for Bullish Nodes
Bearish Nodes: Color option for Bearish Nodes
🔶 RELATED SCRIPTS
Support-and-Resistance-Levels-with-Breaks
Buyside-Sellside-Liquidity
Liquidity-Levels-Voids
