Price/Time CyclesThis is a script for laying out cycles of price & time that are square (though you can adjust the ratios)
There is an "Auto-cycle" option also
You may have to adjust the ratios of both time & price in different ways to get the right settings but you can experiment
Limit the amount of price lines you are displaying otherwise you may get some errors in the information plotted
(the script says max 10 but really there is no true maximum set & you will get missing information as it begins to plot too many lines... I'll try to define this in the future)
Remember you can put down multiple cycles & change the styling.
FOR LINE STYLE- please use this syntax:
Solid Line = sol
Dotted Line = dot
Dashed Line = dsh
(I'll try to setup options for that in the future)
You can lay cycles into the past using the horizontal offset tool but there is a limit of setting the info back beyond 5000 bars, also, generally this process is a bit funny
The script can only put vertical lines up to 500 bars into the future. So, although cycles of 500 bars or more can be used, the future bar will not be plotted until it is within 500 bars of the current bar. In other words, doing very long-term analysis or trying to lay higher timeframe bar counts onto smaller timeframes might not work & may be a buggy process
HEURE

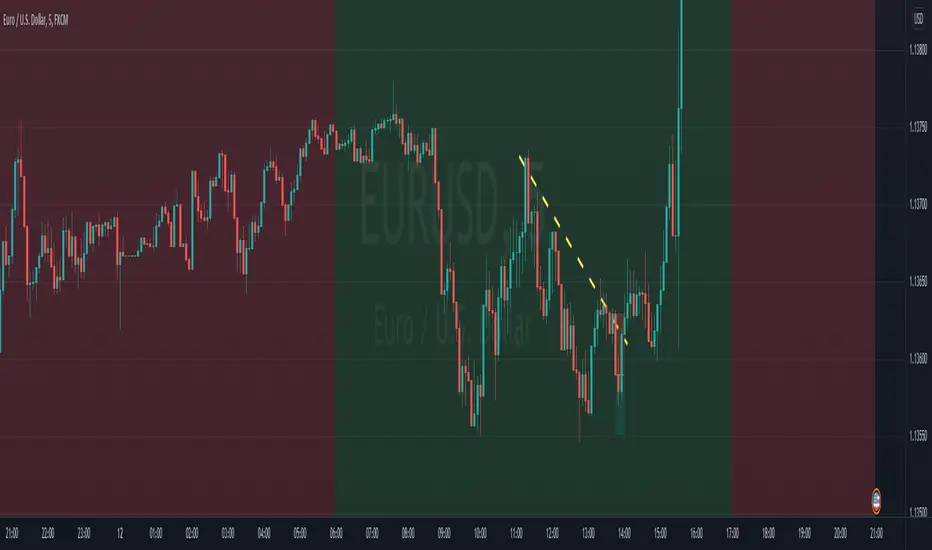
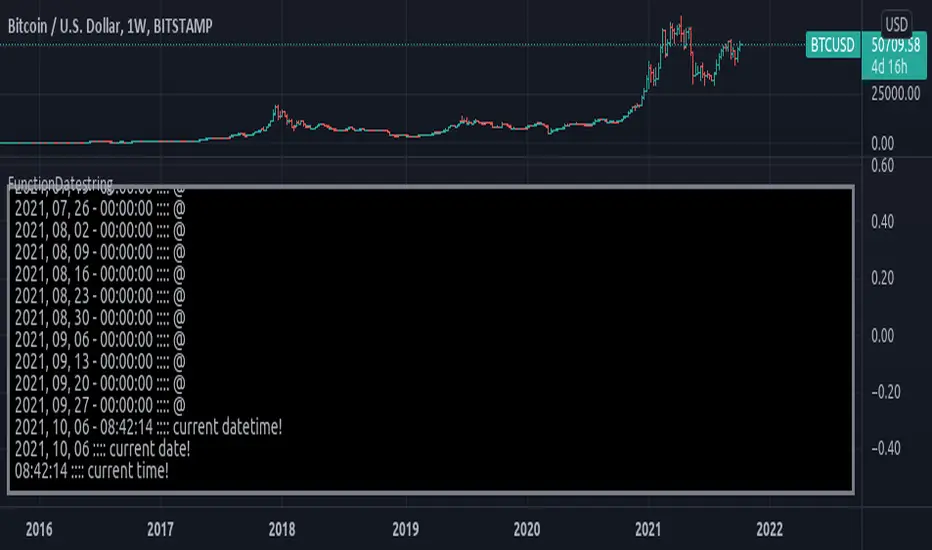
[DisDev] Market Maker | Technical Time AnalysisThis indicator has three main components: Days of Week Separators , User-Customized Reminder Notes , and Projected Lines . Each component is explained and demonstrated how it could be used as a trading tool.
The basis of this indicator is to analyze past price movements and then project them as a reminder for traders that previously, at that particular time, there was a price increase/decrease.
1) Vertical lines and labels separate days of the week.
a. The vertical lines allow you to quickly see what day of the week the price movement occurred. For example, if a notable price move happens on Monday, you can use the “Reminder Notes” input to enter a note directly on the chart, as explained below.
b. You can select different colors and styles for the lines or background.
2) Vertical lines can be customized to be displayed in the past and future.
a. This allows you to select a specific time when price has increased/decreased, see how often this has occurred, then notate it as a reminder in the future.
3) User-customized reminder notes for future projected lines.
a. This allows you to input notes to be displayed with the future projected lines.
b. Example: You notice that at 06:45, there had previously been significant price action. Your notes can be updated directly on the chart to remind you of them just before 06:45 on the following days.
Below is the indicator in full use.
You can adjust each line's style, width, color, and reminder notes.

Time Session Filter - Visual Only - @Davi117 Simple visual adjustable time filter to highlight certain times of the day.
For instance if you only trade between 06:00 and 10:00 etc.
Includes Time Zone Selector using GMT
E.g if you live in London then you time zone will be just GMT, else if you live in Paris it would be GMT+1.
Ensure Trading View's time zone selection in the bottom right to the left of the Auto Scale toggle, is also set also set to your time zone, else it will be misaligned.
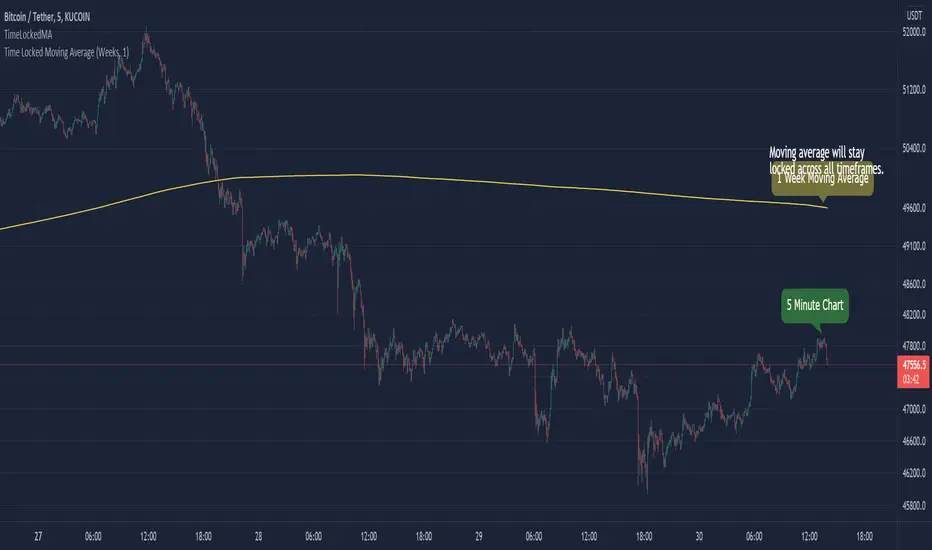
TimeLockedMALibrary "TimeLockedMA"
Library & function(s) which generates a moving average that stays locked to users desired time preference.
TODO - Add functionality for more moving average types. IE: smooth, weighted etc...
Example:
time_locked_ma(close, length=1, timeframe='days', type='ema')
Will generate a 1 day exponential moving average that will stay consistent across all chart intervals.
Error Handling
On small time frames with large moving averages (IE: 1min chart with a 50 week moving average), you'll get a study error that says "(function "sma") references too many candles in history" .
To fix this, make sure you have timeframe="" as an indicator() header. Next, in the indicator settings, increase the timeframe from to a higher interval until the error goes away.
By default, it's set to "Chart". Bringing the interval up to 1hr will usually solve the issue.
Furthermore, adding timeframe_gaps=false to your indicator() header will give you an approximation of real-time values.
Misc Info
For time_lock_ma() setting type='na' will return the relative length value that adjusts dynamically to user's chart time interval.
This is good for plugging into other functions where a lookback or length is required. (IE: Bollinger Bands)
time_locked_ma(source, length, timeframe, type) Creates a moving average that is locked to a desired timeframe
Parameters:
source : float, Moving average source
length : int, Moving average length
timeframe : string, Desired timeframe. Use: "minutes", "hours", "days", "weeks", "months", "chart"
type : string, string Moving average type. Use "SMA" (default) or "EMA". Value of "NA" will return relative lookback length.
Returns: moving average that is locked to desired timeframe.
timeframe_convert(t, a, b) Converts timeframe to desired timeframe. From a --> b
Parameters:
t : int, Time interval
a : string, Time period
b : string, Time period to convert to
Returns: Converted timeframe value
chart_time(timeframe_period, timeframe_multiplier) Separates timeframe.period function and returns chart interval and period
Parameters:
timeframe_period : string, timeframe.period
timeframe_multiplier : int, timeframe.multiplier
Enjoy :)
[5F] Multi clocks📋 Description :
This script displays three customizable clocks.
You can use it on chart too.
Works only in real time, not for replay.
🛠 Options :
Activate or not each clock
Time zone
Color and size in % of text and background
The script can be placed on the chart and in this case it is possible to change the position of each clock
Thanks to all Pinecoders who share their work with the community, in particular (non exhaustive list) :
LonesomeTheBlue, RafaelZioni, dgtrd, allanster, JayRogers , ChuckBanger, cheatcountry, NeoButane, ChrisMoody, QuantTherapy, J-Streak, makit0, john_everist, JustUncleL, everget, Duyck, KivancOzbilgic, LucF, HammondB3, blackcat1402, alexgrover, Mohamed3nan, DonovanWall, RicardoSantos, LazyBear, PRO_Indicators, theheirophant, midtownsk8rguy, e2e4mfck, SeaSide420, xel_arjona, RagingRocketBull, yatrader2, racer8, xdecow, Daveatt, QuantNomad, ceyhun, BigBitsIO, tista, aamonkey, rthomson, bgeraghty, pAulseperformance, rumpypumpydumpy
Another example :

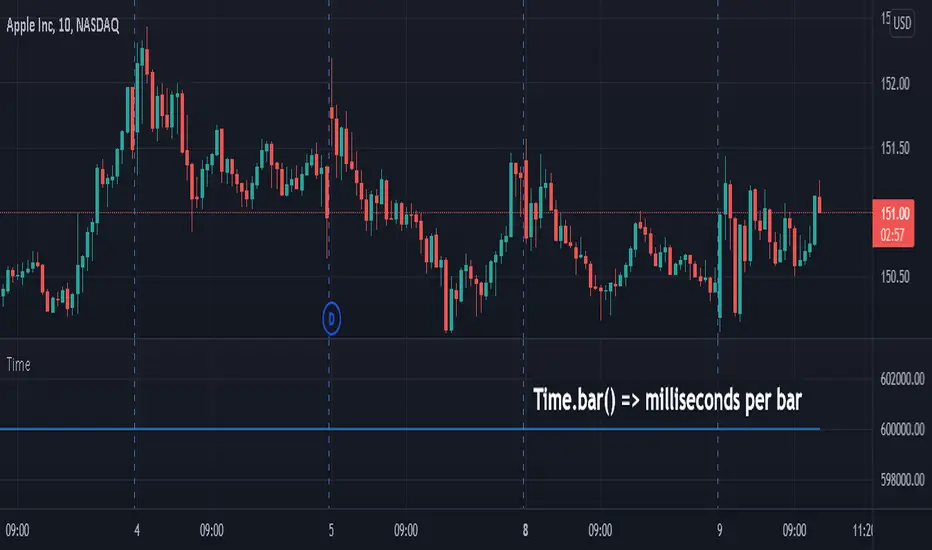
Bar Percent CompleteThis is an example script for checking how far the current bar has progressed towards it's completed state. This works for any time frame, eliminating extra logic calls and conversions for each timeframe.period. It is not intended to be a standalone indicator, but rather as a resource for additional logic triggers on the real time bar of a pine script.
The main caveat is that pine script calculations occur on a per-tick basis. This means that the completion percentage can exceed the percentage threshold before any logic is executed. This happens when the next tick occurs after the threshold. The relevance then will depend on the activity of the underlying asset. Longer time frames on low activity assets will likely be more relevant than their shorter time frame counterparts.

ConverterTFLibrary "ConverterTF"
I have found a bug Regarding the timeframe display, on the chart I have found that the display is numeric, for example 4Hr timeframe instead of '4H', but it turns out to be '240', which I want it to be displayed in abbreviated form. And in all other timeframes it's the same. So this library was created to solve those problems. It converts a timeframe from a numeric string type to an integer type by selecting a timeframe manually and displaying it on the chart.
CTF()
str = "240"
X.GetTF( str )
Example
str = input.timeframe(title='Time frame', defval='240')
TimeF = CTF(str)
L=label.new(bar_index, high, 'Before>> Timeframe '+str+' After>> Timeframe '+TimeF,style=label.style_label_down,size=size.large)
label.delete(L )
Custom timeframes can handle this issue as well.
An example from the use. You will find it on the bottom right hand side.
Hopefully it will be helpful to the Tradingview community. :)

How To Calculate Symbol's UTC NumberVarious methods to calculate a symbol's timezone offset as a numerical value in hours and decimal minutes. This value may be useful to script authors in certain situations where timezone information needs to be available in a numerical format while using intraday charts. Special thanks to @LucF and TradingView Support for their efficiency advisements!
NOTICE: This is an example script and not meant to be used as an actual strategy. By using this script or any portion thereof, you acknowledge that you have read and understood that this is for research purposes only and I am not responsible for any financial losses you may incur by using this script!

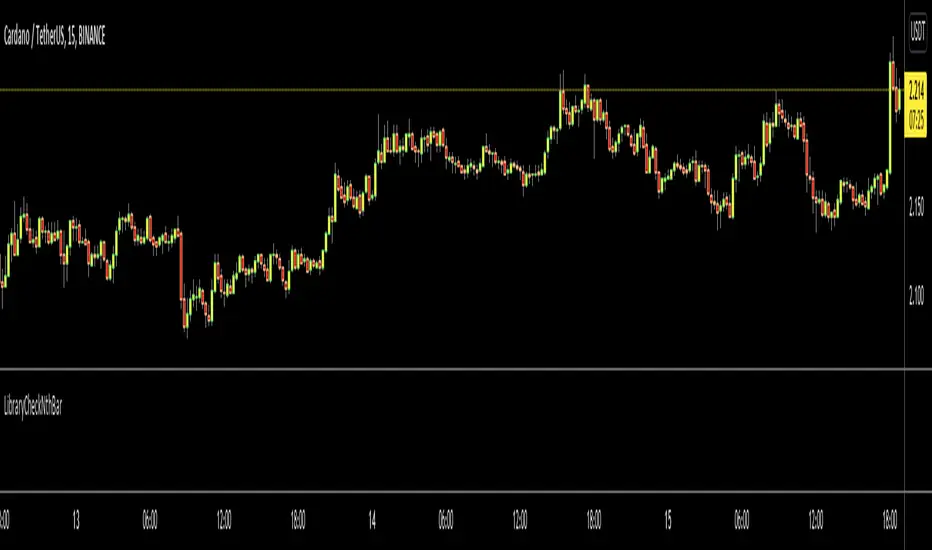
LibraryCheckNthBarLibrary "LibraryCheckNthBar"
TODO: add library description here
canwestart(UTC, prd) this function can be used if current bar is in last Nth bar
Parameters:
UTC : is UTC of the chart
prd : is the length of last Nth bar
Returns: true if the current bar is in N bar
FunctionDaysInMonthLibrary "FunctionDaysInMonth"
Method to find the number of days in a given month of year.
days_in_month(year, month) Method to find the number of days in a given month of year.
Parameters:
year : int, year of month, so we know if year is a leap year or not.
month : int, month number.
Returns: int

FunctionDatestringLibrary "FunctionDatestring"
Methods to stringify date/time, altho there is already builtin support for it.
datetime(unixtime) a stringified date stamp at specified unix time.
Parameters:
unixtime : int unix timestamp.
Returns: string
date_(unixtime) a stringified date stamp at specified unix time.
Parameters:
unixtime : int unix timestamp.
Returns: string
time_(unixtime) a stringified date stamp at specified unix time.
Parameters:
unixtime : int unix timestamp.
Returns: string
Special Time PeriodWith this indicator, you can choose candles in the period you want on your chart.
How ?
• If your chart is 5 minutes, the duration should be greater than 5 on this indicator.
If you do not do it this way, there will be gaps in the price, it will not give the right result.
• If you want to see it in minutes, you must enter a direct numerical value. For example, to see 2 hours, you must enter the number 120. Because 2 hours is 120 minutes.
Like the warning above, if you want to plot a 2-hour chart with this indicator, a maximum of 1 hour should be selected on your main chart.
• Resolution, eg. '60' - 60 minutes, 'D' - daily, 'W' - weekly, 'M' - monthly, '5D' - 5 days, '12M' - one year, '3M' - one quarter
• For example, if you want to see the 2-day chart, you should have a maximum of 1 day chart open on your home screen and write "2D" to the indicator value.
• You will get much better results if the period on your main chart and the period on this indicator are multiples of each other.
• In the image below, the period on the main chart is 30 minutes, but the period on the indicator is 90
• Click on the facing brackets at the top right of the legend and your chart will enlarge.

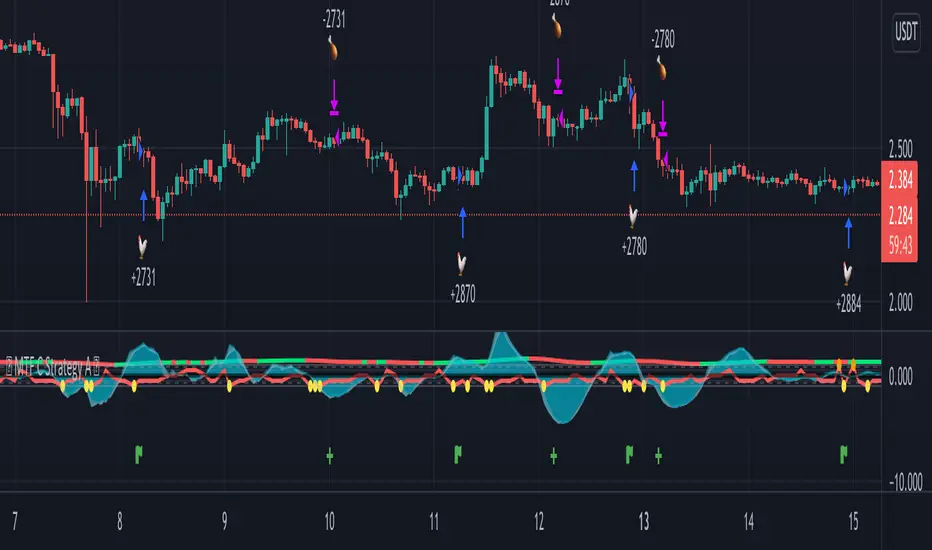
MTF C Strategy A
The Pearson coefficient is a type of correlation coefficient that represents the relationship between two variables that are measured on the same interval or ratio scale. It's a measure of the strength of the association between two continuous variables.
This script allows you to choose one or more sources as a curve, if several sources are chosen, their average is taken into account in an EMA or SMA of your choice. It is possible to have the average of all the curves and to add one or more other curves for an influence on the calculated average.
Then, on the basis of this curve a correlation is calculated from 8 time ranges which give 4 curves, it is on this basis that the conditions of entries in the trade and / or exits are based with the possibility of adding an RSI condition.
For some entries, it is possible to try the symmetrically opposite condition, ie the one that is used in shorts.
To make entry short work, you must activate an exit short option.
However, exit conditions are more flexible than entry conditions because they allow the inverse entry condition used and / or to use statistical indices such as CCI / RSI / ROC / BB as exit condition independently or combined way.
It should be noted that if a condition among those chosen is executed substantially first, it will predominate over the others (same for long / short entries).
In addition, it is possible to choose a stop loss as an exit condition, however, it is not possible to combine the other exit conditions with the stoploss at the same time. Credits to adolgov for the base of the stoploss script part.
You can combine several curves, just as it is possible to combine several types of trade entries / exits.
The strategy uses 100% of equity, it has not been configured in such a way that there is an order pyramid and the closings are done on a total equity basis.
You can configure a daily session interval, a limit of the number of daily trades, a limit of drawdown.
You can add comments for each execution of an opening / closing order respectively to the direction (long or short).
Each step of the configuration has a tip, a button that must be hovered over in order to have the information relating to the configuration.
Time of Day and Day of Week Buying and Selling StrategyThis strategy allows you to back test longing or shorting or do nothing during time increments of 30 minutes for various days of the week. For example if you want to see if every Saturday if Bitcoin dropped in value from 1600-7000 UTC, this script will allow you to test that.
Make sure you are in the 30 minute time frame while viewing the performance and trade history.

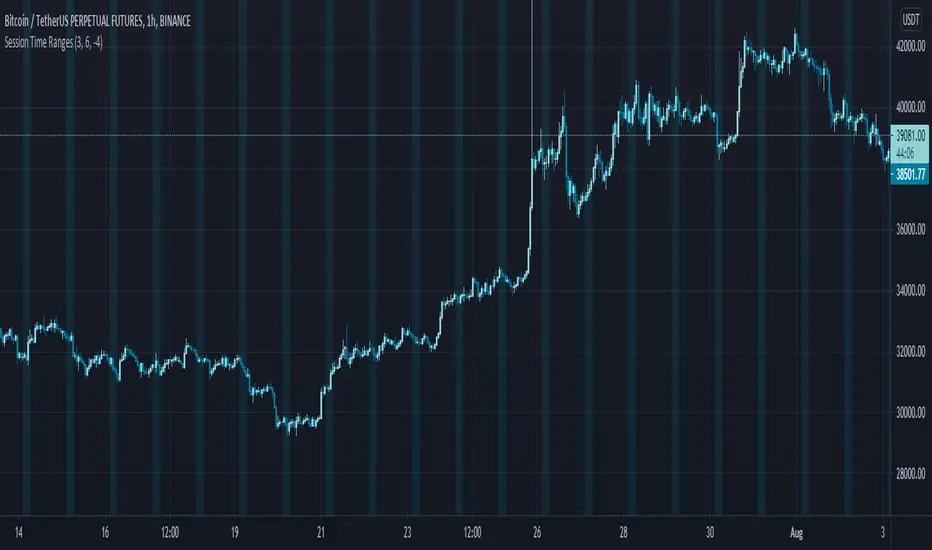
Session Time RangesHave you ever wondered if you are trading at the right time of the day or feel like all the good trades happen when you are sleeping? Well now you can check your theory :)
This Script allows you to highlight a time range on your chart over a 24hour time period. For example 3AM to 6AM
The script has two time variables, set your start time and end time based on a 24 hour clock and set the time zone offset variable to match your charts time zone. For example New York -4 (for utc just enter 0 for no offset )
This is a quick script I put together so hopefully it is error free enjoy :)
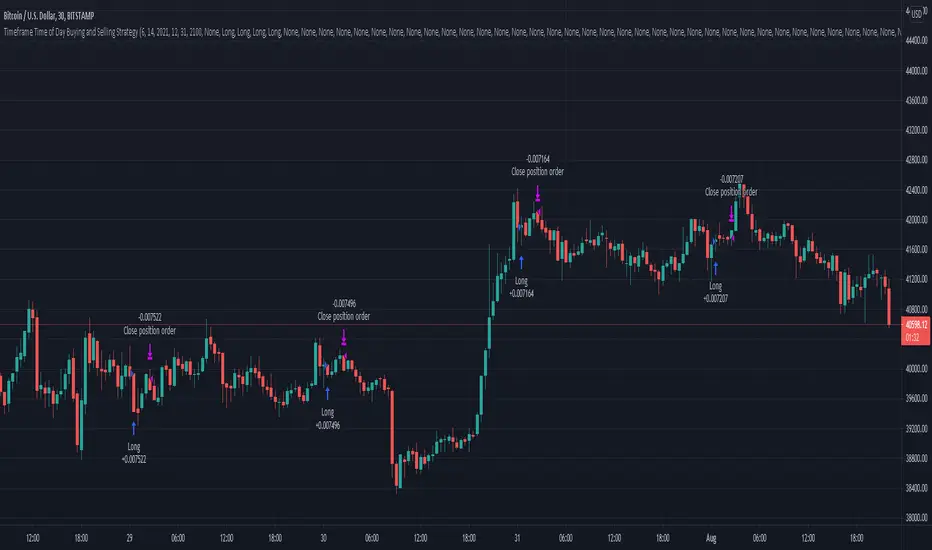
Timeframe Time of Day Buying and Selling StrategyThis strategy allows you to back test longing or shorting or do nothing during time increments of 30 minutes. The price trends in one direction every 30 minutes and this strategy allows you to test various 30 minute time frames across a range of dates to capitalize on this.
Make sure you are in the 30 minute time frame while viewing the performance and trade history.
ICT KillzonesThis Script plots the ICT Killzones in the Chart using a new Panel.
It's based on the Major Forex Sessions and this is usually where Key Swing Points occur.
It has a lookback of 20 days for Performance reasons.
CUSTOMISATION
- Time can be modified
- Lines width can be modified
- Lines colours can be modified
DEFAULT
By default the Killzones will be based on NY Time using the following order
- London Open: 02:00 to 05:00
- New York Open: 07:00 to 10:00
- London Close: 10:00 to 12:00

Natural Stochastic Indicator [CC]The Natural Stochastic Indicator was created by Jim Sloman and this is another indicator from his Ocean series which I will eventually publish all of them. Big thanks to @altcoinz and @tmac87 for giving me all of the source code in order to publish Jim's life work. This is another momentum indicator but unlike a traditional stochastic indicator, this one doesn't use overbought and oversold levels. Instead it becomes a sell signal when the indicator starts getting lower and vice versa. This takes the classic approach to a stochastic and combines it with the time factor from Jim's Ocean Theory to create this new indicator. I have included strong buy and sell signals as darker colors and normal buy and sell signals as lighter colors. Buy when the line turns green and sell when it turns red.
Let me know if there are any other indicators you would like to see me publish!

No Trading Zone (NZT)The script highlights Frankfurt's opening range up until New York's close. It is described as No Trading Zone in Gabrielle Fabris's The Price in Time book.
Projections of the Frankfurt range are potential supports and resistances and they are used in trade management & for taking profits in his system.
Full rules are not mine to share. You have to read the book to understand his system and run your own backtest on each pair to find out what management method you will be most comfortable with.

Auto Fib Time Zones and Trend-Based Fib Time by DGTFibonacci time zones, based on the Fibonacci number sequence, are vertical lines that represent potential areas where a swing high, low, or reversal could occur.
Trend-Based Fib Time shows probable price corrections in an existing trend. A useful tool to use in addition to Elliot Wave counting, Fib Time helps to identify how far the wave is likely to travel
Please note, Time zones aren't concerned with price, only time
Disclaimer :
Trading success is all about following your trading strategy and the indicators should fit within your trading strategy, and not to be traded upon solely
The script is for informational and educational purposes only. Use of the script does not constitute professional and/or financial advice. You alone have the sole responsibility of evaluating the script output and risks associated with the use of the script. In exchange for using the script, you agree not to hold dgtrd TradingView user liable for any possible claim for damages arising from any decision you make based on use of the script

Block Time AverageBitcoins network adjusts to maintain an average block time of 10 Minutes per block.
This chart uses the Hashrate and Difficulty to provide the average block time
< 10 Mins = Hashrate is increasing (Green)
> 10 Mins = Hashrate is decreasing (Red)

Planetary Aspects & Transits█ OVERVIEW
Planetary Aspects and Transits are commonly used by Astrology Traders and Gann Traders for various reasons. This script is designed to highlight these planetary aspects and transitions on your chart. You can select your favorite planet -including the sun and the moon- and also select the aspect that you would like to view and this script will highlight it on the chart. The aspects that are included to choose from are ( 0, 30, 45, 60, 72, 90, 120, 135, 144, 150, and 180 degrees ). You can also select the mode of these aspects and transits ( Heliocentric vs Geocentric ).
This script offers two running options :
1. Planet vs aspect : using this option you will be able to select a planet and an aspect and we will find/highlight all the transitions vs all the planets in that aspect.
2. Planet vs Planet : using this option you will be able to select two planet and a single aspect to view on the chart.
█ Future Plans and upgrades to this script may include :
1. Enhanced algorithm for a faster loading/processing script.
2. More future dates plotting.
And more! Feel free to contact me with any feature that you would like to see in this script
█ How to use :
1. Open the settings.
2. Choose the planet/planets, and the aspect.
3. Enable the option.
Give the script a few seconds and you should be set.
This script is coded as an addon to the Gann ToolBox package/scripts.
