MTF Ichimoku CloudIchimoku Cloud , Multiple Time Frames, based on the script : MTF Selection Framework functions (PineCoders)
Possible display:
- four differents Ichimoku
- Tenkan, Kijun, Chikou and Kumo (monochrome or not)
- labels : offset from line, color if you change style and with/without abbreviation
Time Frames :
- 1m
- 3m
- 5m
- 15m
- 30m
- 45m
- 1h
- 2h
- 3h
- 4h
- Daily
- Weekly
- Monthly
Timeframe

Multi Timeframe Moving Averages This indicator allows you to view a moving average ( EMA or SMA ) of your choosing on other time frames than what you are currently on. You just need to edit the script and plot MAs that you want to see.
This is based on awesome work of @millerrh at but now instead of read inputs, I just plot what I desire with correct labels.
The reason I used that was that I wanted to see daily MAs in 15min, 5min and 1min charts.
To use the script add to your chart and edit it, you can add or remove any MA you want at end of file and then add it to your chart again.
The code off course is open source.

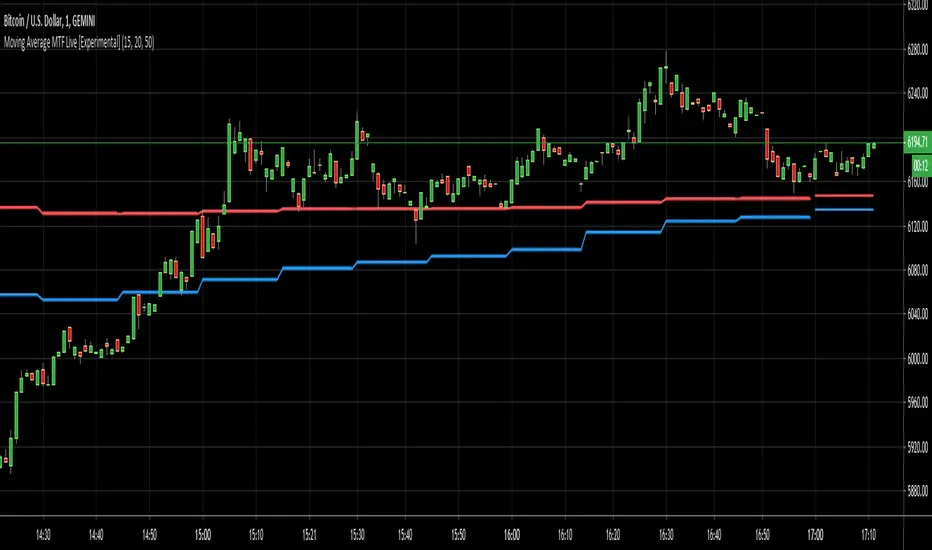
Moving Average MTF Live [Experimental]Hello Everyone,
While using "Security" function for Higher Time Frames (htf) you must accept "Repainting" issue or better you must use previous day data such "security(syminfo.tickerid, 'D', close, lookahead=barmerge.lookahead_on)" that's best normally (or barmerge.lookahead_off). But the problem is (as you can see) it uses previous day data, and this causes latency.
So how to draw LIVE and NON-REPAINTING HTF moving averages?
Until the last candle of higher time frame all is fine and no repaint issue. when it came to last candle of HTF and if we use real data, (because of we can not know the future) while price is changing it starts drawing on each candle of current period without correcting old ones (this is repaint issue). it needs to calculate number of curent time frame candles for higher time frame and must change all points in that period as you can see in the video below.
We have "50 lines" limitation in current Pine version. we hope to have unlimited lines in next versions.
This work is completely experimetal.
btw Thanks to all Pine Platform Developers, They are doing very good job !
Better to watch following video to see how they look like:
P.S. There is no check for Higher time frame, so you should set time frame for HTF accordingly in the options.
Enjoy!
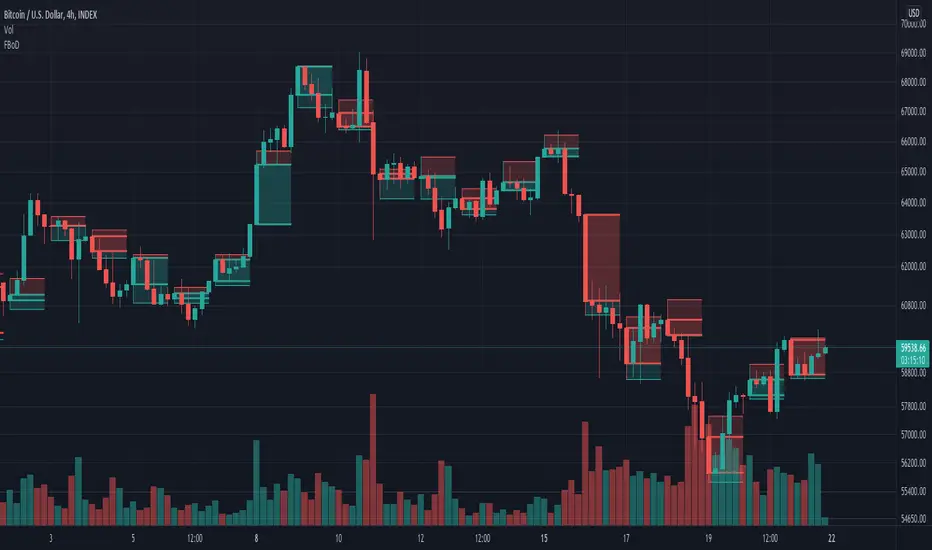
[fikira] Volume + MTF MAVolume normally has 1 Moving Average (standard orange coloured)
This script gives 1 extra Moving Average (default blue coloured)
BOTH MA can be shown with Multi Time Frames,
based on the most excellent work of "PineCoders"
(MTF Selection Framework functions)!
This can provide more insights, also the crossovers can be interesting!
So, default there are 2 MA's of the present Time Frame + extra 2 TF's of these MA's
(default 2 and 4 times of the present TF)
All can be enabled/disabled,
Only 1 MA:
With labels and values:
Here 2 MA but + only 1 extra TF:

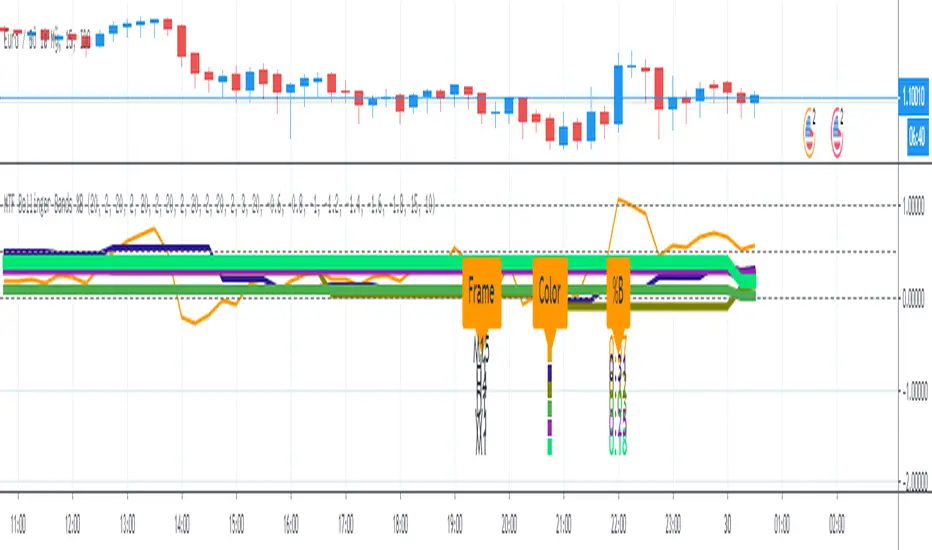
[fikira] Bollinger Bands + Higher Time FramesHere is my take on BB and MTF, based on the most excellent work of
"PineCoders" (MTF Selection Framework functions)!
The big advantage is that on 1 image you can easily see where
price is compared to 5 or less BB Bands (each of different Time Frames).
This gives a lot of Support and Resistance area's!
Includes:
- 1 Bollinger Bands (can be enabled/disabled - "Bollinger Bands"
- 4 Bollinger Bands (each can be enabled/disabled - "HTF Selection 1-4")
Each BB has its colour (can be changed)
- Labels (Timeframe and price) can be enabled/disabled
- Labels position and size can be changed
...

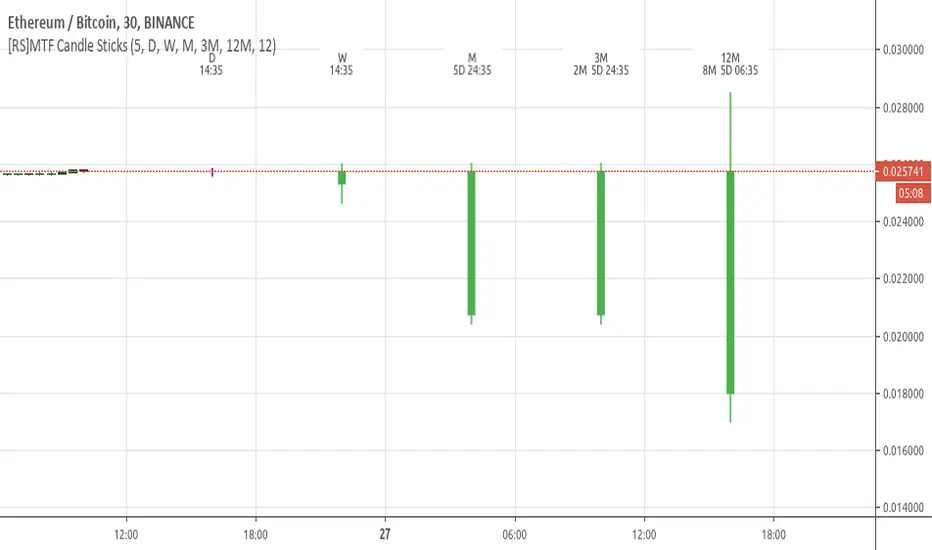
How to Overlay First LTF Bar of DayExample how to overlay the first lower timeframe bar of the day across the entire day. Set chart to a timeframe that is lower than 1 Day period. Also included option for coloring wick pressure of that bar.
NOTICE: This is an example script and not meant to be used as an actual strategy. By using this script or any portion thereof, you acknowledge that you have read and understood that this is for research purposes only and I am not responsible for any financial losses you may incur by using this script!
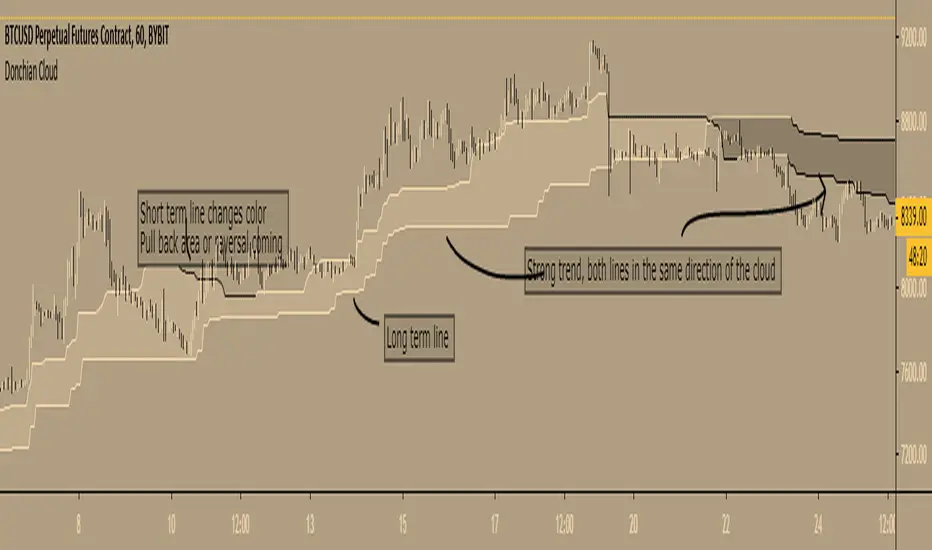
Donchian Cloud - evoA cloud based on the highest high and lowest low of a given period (Donchian), same lines used in Ichimoku Cloud (Conversion line or Base line).
Short term line is based on current time frame, long term line is based on your given multiple of current time frame.
The color of the lines is based on up or down movement.
I stole a piece of code from PineCoders for the multiple time frame:
I have not used this in my trades (yet) so I don't know how good it is, just posting because it looks nice :)
Feel free to share your settings if you can find good ones.
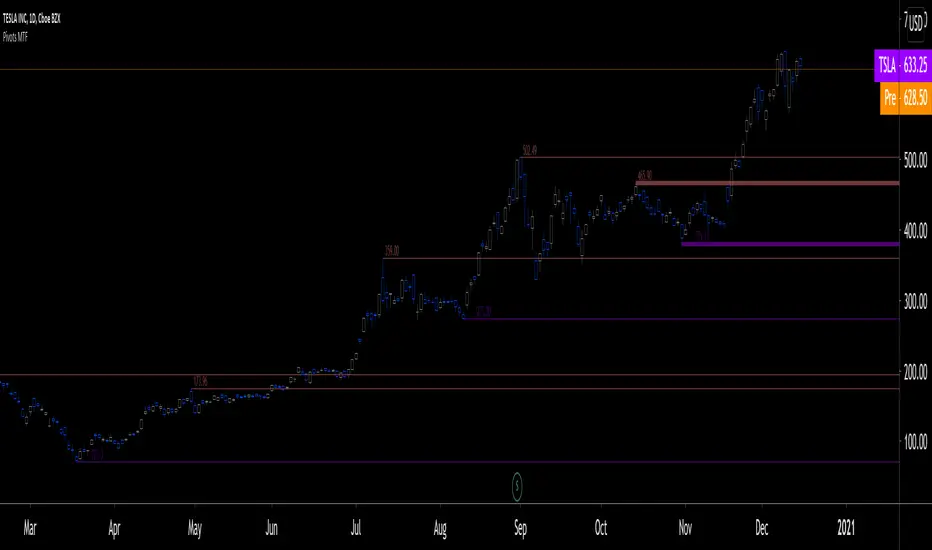
Pivots MTF [LucF]Pivots detected at higher timeframes are more significant because more market activity—or work—is required to produce them. This indicator displays pivots calculated on the higher timeframe of your choice.
Features
► Timeframe selection
— The higher timeframe (HTF) can be selected in 3 different ways:
• By steps (15 min., 60 min., 4H, 1D, 3D, 1W, 1M, 1Y). This setting is the default.
• As a multiple of the current chart's resolution, which can be fractional, so 3.5 will work.
• Fixed.
— The HTF used can be displayed near the last bar (default).
— Note that using the HTF is not mandatory. If it is disabled, the indicator will calculate on the chart's resolution.
— Non-repainting or repainting mode can be selected. This has no impact on the display of historical bars, but when no repainting is selected, pivot detection in the realtime bar will be delayed by one chart bar (not one bar at the HTF).
► Pivots
— Three color schemes are provided: green/red, aqua/pink and coral/violet (the default).
— Both the thickness and brightness of lines can be controlled separately for the hi and lo pivots.
— The visibility of the last hi/lo pivots can be enhanced.
— Prices can be displayed on pivot lines and the text's size and color can be adjusted.
— The number of bars required for the left/right pivot legs can be controlled (the default is 4).
— The source can be selected individually for hi and lo pivots (the default is hlc3 and low .
— The mean of the hi/lo pivot values of the last few thousand chart bars can be displayed. Pivots having lasted longer during the mean's period will weigh more in the calculation. The mean can be displayed in running mode and/or only showing its last level as a long horizontal line. I don't find it very useful; maybe others will.
► Markers and Alerts
— Markers can be configured on breaches of either the last hi/lo pivot levels, or the hi/lo mean. Crossovers and crossunders are controlled separately.
— Alerts can be configured using any of the marker combinations. As is usual for my indicators, only one alert is used. It will trigger on the markers that are active when you create your alert. Once your markers are set up the way you want, create your alert from the chart/timeframe you want the alert to run on, and be sure to use the “Once Per Bar Close” triggering condition. Use an alert message that will remind you of the combination of markers used when creating the alert. If you use multiple markers to trigger one alert, then having the indicator show those markers will be important to help you figure out which marker triggered the alert when it fired.
A quick look at the pattern of these markers will hopefully convince you that using them as entry/exit signals would be perilous, as they are prone to whipsaw. I have included them because some traders may use the markers as reminders.
Using Pivots
These pivots can be used in a few different ways:
— When using the high / low sources they will show extreme levels, breaches of which should be more significant.
— Another way to use them is with hlc3 (the average of the high , low and close ) for hi pivots and low for the lo pivots. This accounts for my personal mythology to the effect that drops typically reach previous lows more easily than rallies make newer highs.
— Using low for hi pivots and high for lo pivots (so backward) can be a useful way to set stops or to detect weakness in movements.
You will usually be better served by pivots if you consider them as denoting regions rather than precise levels. The flexibility in the display options of this indicator will help you adapt it to the way you use your pivots. To indicate areas rather than levels, for example, try using a brightness of 1 with a line thickness of 30. The cloud effect generated this way will show areas better than fine lines.
Realize that these pivot lines are positioned in the past, and so they are drawn after the fact because a given number of bars need to elapse before calculations determine a pivot has occurred. You will thus never see a pivot top, for example, identified on the realtime bar. To detect a pivot, it takes a number of bars corresponding to the dilation of the higher timeframe in the current one, multiplied by the number of bars you use for your pivots' right leg. Also note that the Pine native function used to detect pivots in this indicator considers a summit to be a top when the number of bars in each leg are lower or equal to that top. Bars in legs do not need to be progressively lower on each side of the pivot for a pivot to be detected.
If you program in Pine
— See the Pinecoders MTF Selection Framework for an explanation of the functions used in this script to provide the selection mechanism for the higher timeframe.
— This code uses the Pine Script Coding Conventions .
Thanks
— To the Pine coders asking questions in the Pine Script chat on TV ; your questions got me to write this indicator.
MTF Bollinger Bands %BMulti Time Frame (MTF) Bollinger Bands %B option:
1. On/ Off Bollinger Bands %B - M15 (15-Minute)
2. On/Off Bollinger Bands %B - H1 (1-Hour)
3. On/Off Bollinger Bands %B - H4 (4 Hour)
4. On/Off Bollinger Bands %B - D1 (Daily)
5. On/Off Bollinger Bands %B - W1 (Weekly)
6. On/Off Bollinger Bands %B - M1 (Monthly)
7. On/Off Panel Info: Color note & %B value
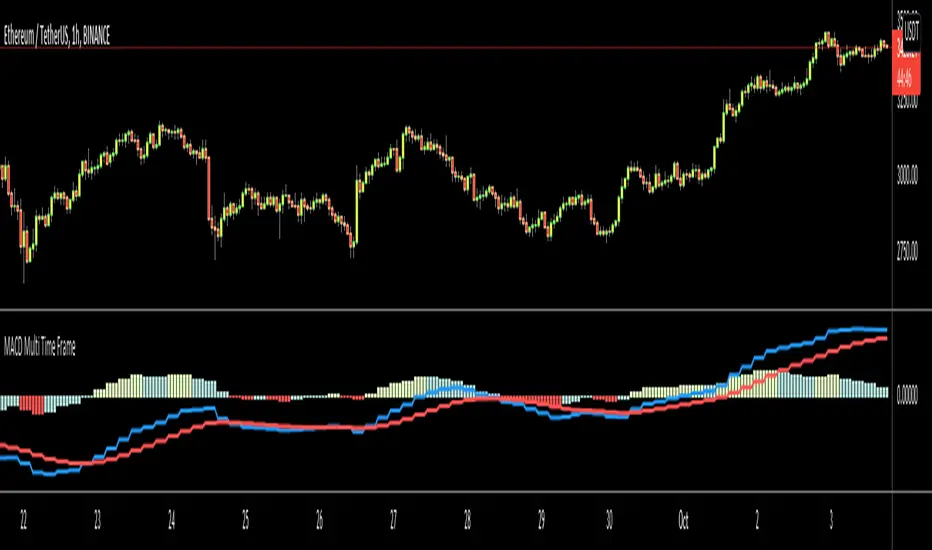
MACD Multi Time FrameThis is non-repainting multi time frame MACD script. You can choose HTF manually or HTF is calculated automatically if HTF Mode is "Auto" that is default.
MultiTimeFrame Fractals D W M [xdecow]This indicator shows fractals in different timeframes. With the possibility of coloring the bars with any combination of current, daily, weekly and monthly timeframes.
The return points are calculated as follows:
high > last 3 highs and close above highest low
low < last 3 lows and closes below lowest high
The direction of higher timeframes fractals tend to be more durable and reliable. This indicator helps to find the fractal alignment of different timeframes, so that you can look for trade opportunities in the same direction as the higher timeframes and improve your chances.

MTF Smoothed Moving Averages x4A set of smoothed moving averages that stay at a fixed timeframe, regardless of the timeframe of the chart but don't have nasty jaggedy lines. Instead, they are smooooooooooooth...

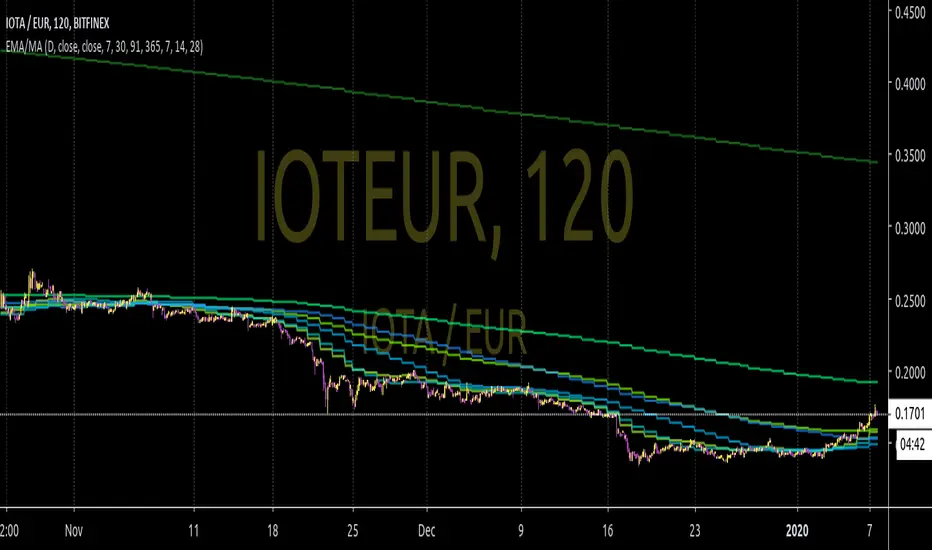
Multi EMA/MA with fixed timeframe by TopsyKrettThis script shows several EMAs and MAs, fully editable
The moving averages dont change when changing candlelength
Unedited it gives:
- 4 EMA (weekly, monthly, quarterly, anual)
- 3 MA (7day, 14day, 28day)
based on daily close
In the script are two additional EMAs and MAs mutet, easy to activate with pine editor
ANN BTC MTF Golden Cross Period MACDHi, this is the MACD version of the ANN BTC Multi Timeframe Script.
The MACD Periods were approximated to the Golden Cross values.
MACD Lengths :
Signal Length = 25
Fast Length = 50
Slow Length = 200
Regards.

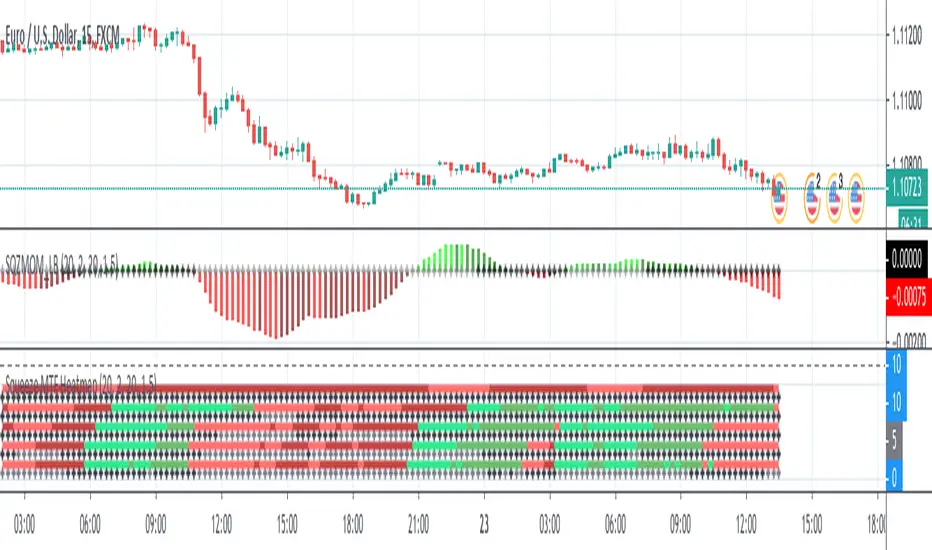
Squeeze MTF HeatmapHere is a multi-timeframe heat map using one of the most apreciated indicators in Tradingview: Squeeze Momentum Indicator by LazyBear.
Study shall be added to 15min chart.
It indicates squeeze and momentum at: 15 min, 30 min, 60 min, 240 min and 1 Day.
Thanks to © azimuthdynamics for inspiration and portion of code
Thanks to Lazy Bear for coding Squeeze Momentum Indicator
Multi Timeframe Moving AveragesThis indicator allows you to view a moving average (EMA or SMA) of your choosing on other time frames than what you are currently on.
The reason I wanted to develop this was for use as a filter. Let's say you wanted to make sure the daily time frame was trading above a certain moving average so you could be sure you were playing with the trend. But you wanted to make your entries and exits on a smaller time frame. This Multi-Timeframe Moving Average indicator can then be used to keep an eye on that daily moving average while looking at the shorter term time frames on the same chart.

Stochastic RSI 3in1 & Volatility peaks + ADX by AGUDescription:
3 Lines are Stochastic RSI's, strongest move is when all crosses and moves to one direction (from top or bottom).
Orange is original Stochastic of the timeline. (Live movement of price).
Green is original Stoch x 6. (Short term movement).
Red is original Stoch x27 (Long term price movement).
Transparent columns are ADX signal.
Higher the mountain, stronger the signal. When the mountain tops, trend usually change.
And finally the volatility peaks. Green peak HIGHEST volatility , RED peak LOWEST volatility .
I use it on 1 min BTC chart. But it works on all.
TIPS >> 3HCQ41cRpxcq2MJdRUSYoq9N1RnEy98xD2

Baseline - evoPlots the high and low of your chosen moving average.
Options are:
SMA = Simple Moving Average
EMA = Exponential Moving Average
WMA = Weighted Moving Average
HMA = Hull Moving Average
VWMA = Volume Weighted Moving Average
RMA = Exponetial Weighted Moving Average
ALMA = Arnaud Legoux Moving Average
Unbox "Use Current Timeframe" to use chosen timeframe below
I mainly use this to get in and out of the market for futures trading, to reduce fake outs of having just one moving average line.
Let me know if you like it..
Inspired from LazyBear's EMAenvelope :)
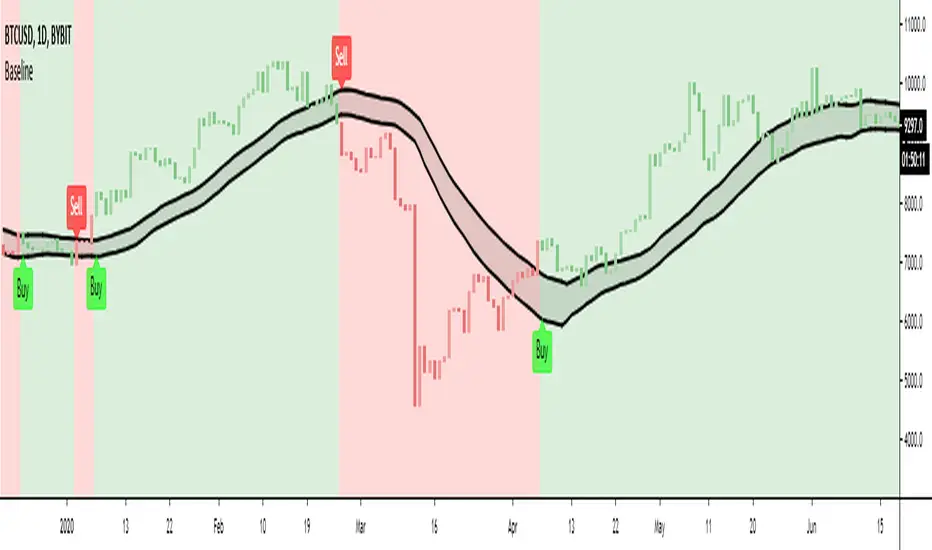

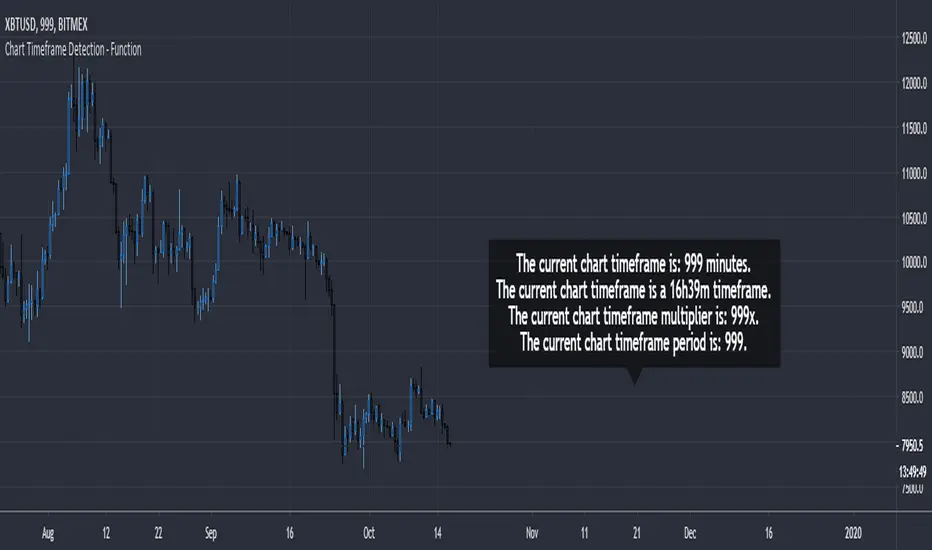
Chart Timeframe Detection - FunctionChart Timeframe Detection - Function
A small and effective function to detect the current chart timeframe in minutes.
It can be used to further detect a specific chart timeframe (a daily timeframe or even a 16h39m timeframe).
The result is returned as integer.
Binary Options Arrows (example)An example of Binary Option Arrows (BOA) for candlestick patterns bearish and bullish harami.
With results as coloured background and an option to choose your expiration (one candle by default).
It's just an example for those who has their own strategy and wants to make nice arrows in their chart.
All you need to do is rewrite piece of script in lines 9:13 - feel free to ask me for any help.
Disclaimer: It's just an example how to script arrows for binary option trading, Poshtrader is not responsible for any loss of money by using this particular strategy.
Happy Trading

Multi TF - RSIRSI with 5 timeframes, you can change the TF it in the configs.
This one has 1h, 2h, 4h, Daily and Weekly.
