Adaptive ML Trailing Stop [BOSWaves]Adaptive ML Trailing Stop – Regime-Aware Risk Control with KAMA Adaptation and Pattern-Based Intelligence
Overview
Adaptive ML Trailing Stop is a regime-sensitive trailing stop and risk control system that adjusts stop placement dynamically as market behavior shifts, using efficiency-based smoothing and pattern-informed biasing.
Instead of operating with fixed ATR offsets or rigid trailing rules, stop distance, responsiveness, and directional treatment are continuously recalculated using market efficiency, volatility conditions, and historical pattern resemblance.
This creates a live trailing structure that responds immediately to regime change - contracting during orderly directional movement, relaxing during rotational conditions, and applying probabilistic refinement when pattern confidence is present.
Price is therefore assessed relative to adaptive, condition-aware trailing boundaries rather than static stop levels.
Conceptual Framework
Adaptive ML Trailing Stop is founded on the idea that effective risk control depends on regime context rather than price location alone.
Conventional trailing mechanisms apply constant volatility multipliers, which often results in trend suppression or delayed exits. This framework replaces static logic with adaptive behavior shaped by efficiency state and observed historical outcomes.
Three core principles guide the design:
Stop distance should adjust in proportion to market efficiency.
Smoothing behavior must respond to regime changes.
Trailing logic benefits from probabilistic context instead of fixed rules.
This shifts trailing stops from rigid exit tools into adaptive, regime-responsive risk boundaries.
Theoretical Foundation
The indicator combines adaptive averaging techniques, volatility-based distance modeling, and similarity-weighted pattern analysis.
Kaufman’s Adaptive Moving Average (KAMA) is used to quantify directional efficiency, allowing smoothing intensity and stop behavior to scale with trend quality. Average True Range (ATR) defines the volatility reference, while a K-Nearest Neighbors (KNN) process evaluates historical price patterns to introduce directional weighting when appropriate.
Three internal systems operate in tandem:
KAMA Efficiency Engine : Evaluates directional efficiency to distinguish structured trends from range conditions and modulate smoothing and stop behavior.
Adaptive ATR Stop Engine : Expands or contracts ATR-derived stop distance based on efficiency, tightening during strong trends and widening in low-efficiency environments.
KNN Pattern Influence Layer : Applies distance-weighted historical pattern outcomes to subtly influence stop placement on both sides.
This design allows stop behavior to evolve with market context rather than reacting mechanically to price changes.
How It Works
Adaptive ML Trailing Stop evaluates price through a sequence of adaptive processes:
Efficiency-Based Regime Identification : KAMA efficiency determines whether conditions favor trend continuation or rotational movement, influencing stop sensitivity.
Volatility-Responsive Scaling : ATR-based stop distance adjusts automatically as efficiency rises or falls.
Pattern-Weighted Adjustment : KNN compares recent price sequences to historical analogs, applying confidence-based bias to stop positioning.
Adaptive Stop Smoothing : Long and short stop levels are smoothed using KAMA logic to maintain structural stability while remaining responsive.
Directional Trailing Enforcement : Stops advance only in the direction of the prevailing regime, preserving invalidation structure.
Gradient Distance Visualization : Gradient fills reflect the relative distance between price and the active stop.
Controlled Interaction Markers : Diamond markers highlight meaningful stop interactions, filtered through cooldown logic to reduce clustering.
Together, these elements form a continuously adapting trailing stop system rather than a fixed exit mechanism.
Interpretation
Adaptive ML Trailing Stop should be interpreted as a dynamic risk envelope:
Long Stop (Green) : Acts as the downside invalidation level during bullish regimes, tightening as efficiency improves.
Short Stop (Red) : Serves as the upside invalidation level during bearish regimes, adjusting width based on efficiency and volatility.
Trend State Changes : Regime flips occur only after confirmed stop breaches, filtering temporary price spikes.
Gradient Depth : Deeper gradient penetration indicates increased extension from the stop rather than imminent reversal.
Pattern Influence : KNN weighting affects stop behavior only when historical agreement is strong and remains neutral otherwise.
Distance, efficiency, and context outweigh isolated price interactions.
Signal Logic & Visual Cues
Adaptive ML Trailing Stop presents two primary visual signals:
Trend Transition Circles : Display when price crosses the opposing trailing stop, confirming a regime change rather than anticipating one.
Stop Interaction Diamonds : Indicate controlled contact with the active stop, subject to cooldown filtering to avoid excessive signals.
Alert generation is limited to confirmed trend transitions to maintain clarity.
Strategy Integration
Adaptive ML Trailing Stop fits within trend-following and risk-managed trading approaches:
Dynamic Risk Framing : Use adaptive stops as evolving invalidation levels instead of fixed exits.
Directional Alignment : Base execution on confirmed regime state rather than speculative reversals.
Efficiency-Based Tolerance : Allow greater price fluctuation during inefficient movement while enforcing tighter control during clean trends.
Pattern-Guided Refinement : Let KNN influence adjust sensitivity without overriding core structure.
Multi-Timeframe Context : Apply higher-timeframe efficiency states to inform lower-timeframe stop responsiveness.
Technical Implementation Details
Core Engine : KAMA-based efficiency measurement with adaptive smoothing
Volatility Model : ATR-derived stop distance scaled by regime
Machine Learning Layer : Distance-weighted KNN with confidence modulation
Visualization : Directional trailing stops with layered gradient fills
Signal Logic : Regime-based transitions and controlled interaction markers
Performance Profile : Optimized for real-time chart execution
Optimal Application Parameters
Timeframe Guidance:
1 - 5 min : Tight adaptive trailing for short-term momentum control
15 - 60 min : Structured intraday trend supervision
4H - Daily : Higher-timeframe regime monitoring
Suggested Baseline Configuration:
KAMA Length : 20
Fast/Slow Periods : 15 / 50
ATR Period : 21
Base ATR Multiplier : 2.5
Adaptive Strength : 1.0
KNN Neighbors : 7
KNN Influence : 0.2
These suggested parameters should be used as a baseline; their effectiveness depends on the asset volatility, liquidity, and preferred entry frequency, so fine-tuning is expected for optimal performance.
Parameter Calibration Notes
Use the following adjustments to refine behavior without altering the core logic:
Excessive chop or overreaction : Increase KAMA Length, Slow Period, and ATR Period to reinforce regime filtering.
Stops feel overly permissive : Reduce the Base ATR Multiplier to tighten invalidation boundaries.
Frequent false regime shifts : Increase KNN Neighbors to demand stronger historical agreement.
Delayed adaptation : Decrease KAMA Length and Fast Period to improve responsiveness during regime change.
Adjustments should be incremental and evaluated over multiple market cycles rather than isolated sessions.
Performance Characteristics
High Effectiveness:
Markets exhibiting sustained directional efficiency
Instruments with recurring structural behavior
Trend-oriented, risk-managed strategies
Reduced Effectiveness:
Highly erratic or event-driven price action
Illiquid markets with unreliable volatility readings
Integration Guidelines
Confluence : Combine with BOSWaves structure or trend indicators
Discipline : Follow adaptive stop behavior rather than forcing exits
Risk Framing : Treat stops as adaptive boundaries, not forecasts
Regime Awareness : Always interpret stop behavior within efficiency context
Disclaimer
Adaptive ML Trailing Stop is a professional-grade adaptive risk and regime management tool. It does not forecast price movement and does not guarantee profitability. Results depend on market conditions, parameter selection, and disciplined execution. BOSWaves recommends deploying this indicator within a broader analytical framework that incorporates structure, volatility, and contextual risk management.
Analyse de la tendance

SD-Range Oscillator | QuantEdgeBSD-Range Oscillator | QuantEdgeB
🔍 Overview
SD-Range Oscillator | QuantEdgeB (SDRO) is a normalized momentum oscillator that compresses a low-lag trend core into a 0–100 style range using standard-deviation (SD) bands. It builds a smooth baseline from a fast triple-smoothed average, wraps it with ±2×SD volatility bounds, then normalizes the core value inside that envelope. Clear Long/Short regimes trigger when the normalized value crosses user-defined thresholds, with optional labels, regime-colored candles, and intuitive filled zones.
✨ Key Features
1.⚡ Low-Lag Core (Triple-Smooth Engine)
- Uses a fast, low-lag triple-smoothed average as the oscillator’s primary signal input.
- Helps keep momentum readings responsive while filtering noise.
2. 📏 SD Volatility Envelope (±2×SD)
- Builds a volatility channel around a smoothed baseline using standard deviation.
- Automatically adapts to changing market turbulence.
3. 🧮 Normalized Range Output
- Converts the core signal into a normalized value by mapping it between the upper/lower SD bounds.
- Makes readings consistent across assets and timeframes.
4. 🎯 Threshold-Based Regimes
- Long when the normalized value exceeds the Long threshold.
- Short when it falls below the Short threshold.
- Includes an additional safety filter to reduce “forced” longs when price is already extended near the upper envelope.
5. 🎨 Visual Clarity & Zones
- Regime-colored oscillator line and candles.
- Filled SD bands around the baseline for quick volatility context.
- Optional highlight fills between the oscillator and thresholds to show active long/short phases.
- Extra OB/OS background zones for quick overextension awareness.
6. 🔔 Signals & Alerts
- Optional “Long/Short” labels on confirmed regime flips.
- Alert conditions fire on long/short regime crossovers.
💼 Use Cases
• Momentum Confirmation: Validate breakouts by requiring SDRO to hold above the Long threshold.
• Mean-Reversion Awareness: Watch for extreme normalized readings near upper/lower bounds.
• Regime Filtering: Use SDRO state (Long/Short/Neutral) to filter trades from other systems.
• Cross-Market Comparison: Normalization makes it easier to compare momentum across different tickers.
🎯 For Who
• Trend traders who want a clean momentum filter with adaptive volatility context.
• System builders needing a simple regime variable (1 / -1 / neutral) to gate entries.
• Discretionary traders who like visual confirmation (fills, candle coloring, threshold zones).
• Multi-asset traders who benefit from normalized, comparable oscillator readings.
⚙️ Default Settings
• TEMA Period: 7
• Base Length (SMMA): 25
• Long Threshold: 55
• Short Threshold: 45
• SD Multiplier: 2× (fixed in code)
• Color Mode: Alpha
• Color Transparency: 60
• Labels: Off by default
📌 Conclusion
SD-Range Oscillator | QuantEdgeB blends a low-lag triple-smoothed core with an adaptive SD envelope to produce a normalized, easy-to-read momentum signal. With clear threshold regimes, volatility-aware context, and strong visuals (fills + candle coloring), SDRO helps separate meaningful momentum shifts from noise across any asset or timeframe.
🔹 Disclaimer: Past performance is not indicative of future results. Always backtest and align settings with your risk tolerance and objectives before live trading.
🔹 Strategic Advice: Always backtest, optimize, and align parameters with your trading objectives and risk tolerance before live trading.

ICT ORB Killzones by MaxN (15 / 30m)Trading session London, Asia, New York
orb 15/30 min selectable breakout zones with buy/sell signals

ICT ORB Killzones by MaxN (15 / 30m)Trading session open/close with first 15/30 min orbs
will just have to adjust time zones to your current time line
GMT +0
I use
Asia 23.00 - 06.00
London 07.00 - 16.00
New York 12.00 - 22.00

TwinSmooth ATR Bands | QuantEdgeBTwinSmooth ATR Bands | QuantEdgeB
🔍 Overview
TwinSmooth ATR Bands | QuantEdgeB is a dual-smoothing, ATR-adaptive trend filter that blends two complementary smoothing engines into a single baseline, then builds dynamic ATR bands around it to detect decisive breakouts. When price closes above the upper band it triggers a Long regime; when it closes below the lower band it flips to Short—otherwise it stays neutral. The script enhances clarity with regime-colored candles, an active-band fill, and an optional on-chart backtest table.
✨ Key Features
1. 🧠 Twin-Smooth Baseline (Dual Engine Blend)
- Computes two separate smoothed baselines (a slower “smooth” leg + a faster “responsive” leg).
- Blends them into a single midpoint baseline for balanced stability + speed.
- Applies an extra EMA smoothing pass to produce a clean trend_base.
2. 📏 ATR Volatility Bands
- Builds upper/lower bands using ATR × multiplier around the trend_base.
- Bands expand in volatile conditions and contract when markets quiet down—auto-adapting without manual tweaks.
3. ⚡ Clear Breakout Regime Logic
- Long when close > upperBand.
- Short when close < lowerBand.
- Neutral otherwise (no forced signals inside the band zone).
4. 🎨 Visual Clarity
- Plots only the active band (lower band in long regime, upper band in short regime).
- Fills between active band and price for instant regime context.
- Colors candles to match the current state (bullish / bearish / neutral).
- Multiple color palettes + transparency control.
💼 Use Cases
• Trend Confirmation Filter: Use the regime as a higher-confidence trend gate for entries from other indicators.
• Breakout/Breakdown Trigger: Trade closes outside ATR bands to catch momentum expansions.
• Volatility-Aware Stops/Targets: Bands naturally reflect volatility, making them useful as adaptive reference levels.
• Multi-Timeframe Alignment: Confirm higher-timeframe regime before executing on lower timeframes.
🎯 For Who
• Trend Traders who want clean regime shifts without constant whipsaw.
• Breakout Traders who prefer confirmation via ATR expansion rather than raw MA crossovers.
• System Builders needing a simple, robust “state engine” (Long / Short / Neutral) to plug into larger strategies.
• Analysts who want quick on-chart validation with a backtest table.
⚙️ Default Settings
• SMMA Length (Base Smooth Leg): 24
• TEMA Length (Base Responsive Leg): 8
• EMA Extra Smoothing: 14
• ATR Length: 14
• ATR Multiplier: 1.1
• Color Mode: Alpha
• Color Transparency: 30
• Backtest Table: On (toggleable)
• Backtest Start Date: 09 Oct 2017
• Labels: Off by default
📌 Conclusion
TwinSmooth ATR Bands | QuantEdgeB merges a dual-speed smoothing core into a single trend baseline, then wraps it with ATR-based bands to deliver clean, volatility-adjusted breakout signals. With regime coloring, active-band plotting, and optional backtest stats, it’s a compact, readable tool for spotting momentum shifts and trend continuation across any market and timeframe.
🔹 Disclaimer: Past performance is not indicative of future results. Always backtest and align settings with your risk tolerance and objectives before live trading.
🔹 Strategic Advice: Always backtest, optimize, and align parameters with your trading objectives and risk tolerance before live trading.

Market Acceptance Zones [Interakktive]Market Acceptance Zones (MAZ) identifies statistical price acceptance — areas where the market reaches agreement and price rotates rather than trends.
Unlike traditional support/resistance tools, MAZ does not assume where price "should" react. Instead, it highlights regions where multiple internal conditions confirm balance: directional efficiency drops, effort approximately equals result, volatility contracts, and participation remains stable.
This is a market-state diagnostic tool, not a signal generator.
█ WHAT THE ZONES REPRESENT
MAZ (ATF) — Chart Timeframe Acceptance
A MAZ marks an area where price displayed rotational behaviour and the auction temporarily agreed on value. These zones often act as compression regions, fair-price areas, or boundaries of consolidation where impulsive follow-through is less likely.
Use ATF MAZs to:
- Identify rotational environments
- Avoid chasing price inside balance
- Frame consolidation prior to expansion
MAZ • HTF / MAZ • 2/3 — Multi-Timeframe Acceptance (AMTF)
When Multi-Timeframe mode is enabled, MAZ evaluates acceptance on:
- The chart timeframe
- Two higher structural timeframes
If the minimum consensus threshold is met (default: 2 of 3), the zone is classified as AMTF. These zones represent stronger agreement and typically decay more slowly than single-timeframe acceptance.
AMTF zones are structurally stronger and are useful for:
- Higher-quality rotation areas
- Pullback framing within trends
- Context alignment across timeframes
H • MAZ — Historic Acceptance Zones
Historic MAZs represent older acceptance that has transitioned out of active relevance. These zones are hidden by default and can be enabled to provide long-term memory context.
█ AUTO MULTI-TIMEFRAME LOGIC
When MTF Mode is set to Auto, MAZ uses a deterministic structural mapping based on the current chart timeframe:
- 5m → 15m + 1H
- 15m → 1H + 4H
- 1H → 4H + 1D
- 4H → 1D + 1W
- 1D → 1W + 1M
This ensures consistent higher-timeframe context without manual configuration. Advanced users may switch to Manual mode to define custom timeframes.
█ ZONE LIFECYCLE
MAZ zones are dynamic and maintain an internal lifecycle:
- Active — Acceptance remains relevant
- Aging — Acceptance quality is degrading
- Historic — Retained only for memory context
Zones track price interaction and re-acceptance, which can stabilise or strengthen them. Weak or stale zones are automatically removed to keep the chart clean.
█ HOW TRADERS USE MAZ
MAZ is designed to provide structure, not entries.
Common applications include:
- Avoiding chop when price is inside acceptance
- Framing expansion after clean breaks from MAZ
- Identifying higher-quality rotational pullbacks (AMTF zones)
- Defining objective invalidation using zone boundaries
█ SETTINGS OVERVIEW
Market Acceptance Zones — Core
- Acceptance Lookback
- ATR Length
- Zone Frequency (Conservative / Balanced / Aggressive)
Market Acceptance Zones — Zones
- Maximum Zones
- Fade & Stale Bars
- Historic Zone Visibility (default OFF)
Market Acceptance Zones — Timeframes
- MTF Mode (Off / Auto / Manual)
- Manual Higher Timeframes
- Minimum Consensus Requirement
Market Acceptance Zones — Visuals
- Neon / Muted Theme
- Zone Labels & Consensus Detail
- Optional Midline Display
█ DISCLAIMER
This indicator is a market context and diagnostic tool only.
It does not generate trade signals, entries, or exits.
Past acceptance behaviour does not guarantee future price action.
Always combine with independent analysis and proper risk management.

Dragon Flow Arrows (LITE)🚀 DRAGON FLOW ARROWS | Smart Trend Engine + Clean Reversal Arrows
A lightweight but highly-optimized trend system designed for clean charts, powerful visual signals, and no-noise directional flow. Built for traders who want simplicity, clarity, and professional-level momentum-filtered signals without over-complication.
🔥 Dragon Channel (Clean 3-Line Ribbon)
A smooth adaptive channel formed from ATR + EMA, giving you structural trend zones without clutter.
✅ Dragon Flow Gradient
A horizontal, color-shifted flow:
🟢 Bull flow → green glow
🔴 Bear flow → red glow
Automatic blend based on trend direction
Smooth visual transitions (no vertical stripes)
✅ Momentum-Filtered Arrows
BUY/SELL arrows only print when:
Price breaks outside the Dragon Channel
Momentum confirms (RSI + MACD filters)
Trend flips → one clean arrow per direction
✅ Smart Header Panel
At the top of your chart:
📌 Trend: Uptrend / Downtrend / Neutral
⚡ Impulse Strength: Weak / Normal / Strong
📊 How to Use
Entry:
- BUY Setup
Price moving above baseline
Dragon Flow turns bullish (cyan side)
Arrow appears below channel
- SELL Setup
Price breaks below baseline
Dragon Flow turns bearish (magenta side)
Arrow pops above channel
Exit / Filter:
Opposite arrow
Flow color shift
Trend panel flips
Works on Forex, Crypto, Stocks, Indices — all timeframes (just adjust the channel length).
Happy trading!

DDDDD : EMA Pack (Matched Colors + MTF)📌 DDDDD : EMA Pack (Matched Colors + MTF)
🔹 Concept
DDDDD : EMA Pack is a clean and minimal Exponential Moving Average (EMA) overlay designed for trend structure analysis and multi-timeframe context.
This indicator focuses on visual clarity, consistent color mapping, and optional MTF EMA projection, allowing traders to read market structure without clutter or signal noise.
It is not an entry or signal generator, but a trend and regime visualization tool.
🔹 Logic
The script plots a fixed set of EMAs commonly used to define short-term momentum, intermediate trend, and long-term bias:
EMA 5
EMA 10
EMA 25
EMA 50
EMA 75
EMA 200
Each EMA is calculated using the standard exponential moving average formula.
If a higher timeframe is selected, the EMA is calculated on that timeframe and projected onto the current chart using request.security().
🔹 Methodology
Users may select:
Source price (default: close)
EMA timeframe
Empty = current chart timeframe
Any higher timeframe = true MTF EMA projection
All EMA colors are manually matched and fixed to maintain visual consistency across markets and timeframes.
Line thickness is kept uniform to avoid visual hierarchy bias.
This design ensures the indicator remains purely structural, without repainting logic, smoothing tricks, or adaptive parameters.
🔹 How to Use
Use EMA alignment and spacing to assess:
Trend direction
Trend strength
Compression vs expansion
Higher-timeframe EMA projection can be used as:
Dynamic support/resistance
Trend filter
Regime context for lower-timeframe execution
This indicator works best when combined with:
Price action
Market structure
Separate entry/exit logic of your own system
⚠️ This indicator does not provide buy/sell signals and should not be used alone for trade execution.
🔹 Notes
No repainting beyond standard MTF behavior
No performance or profitability claims
Designed for discretionary and systematic traders
Suitable for stocks, crypto, forex, and indices

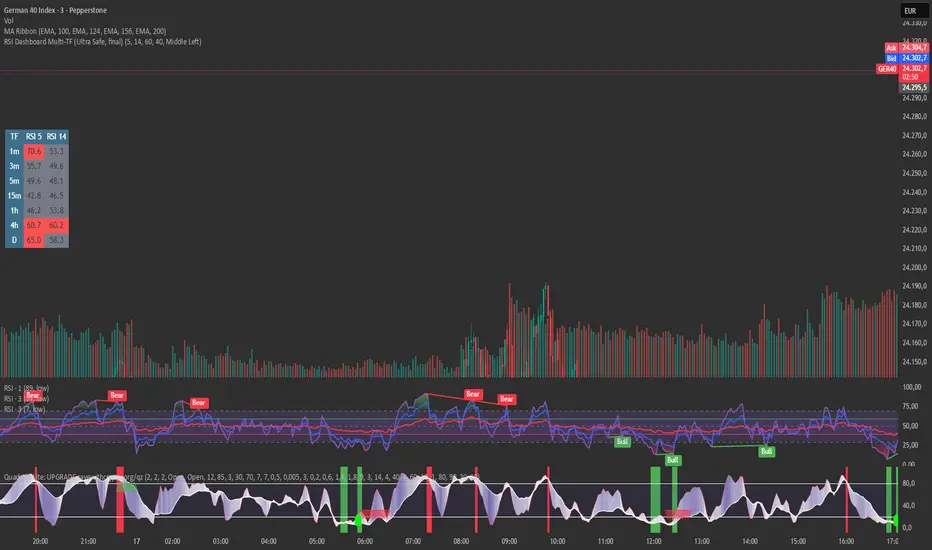
RSI Dashboard Multi-TF This script displays RSI values from multiple timeframes in a compact dashboard directly on the chart.
It is designed for traders who want to quickly identify whether the market is overbought, oversold, or neutral across different timeframes, without constantly switching chart intervals.
The dashboard shows the RSI simultaneously for the following timeframes:
- 1 minute
- 3 minutes
- 5 minutes
- 15 minutes
- 1 hour
- 4 hours
- Daily
Typical use cases:
- Scalping & intraday trading
- Multi-timeframe analysis at a glance
- Entry confirmation (e.g. pullbacks, breakouts)
- Avoiding trades against overbought or oversold market conditions
- Complementing EMA, VWAP, or price action strategies
⚙️ Notes
This dashboard is an analysis tool, not an automated trading system.
No repainting (uses request.security).
Suitable for indices, forex, crypto, and commodities.
This RSI dashboard provides a fast, clear, and visually clean market overview across multiple timeframes, making it an ideal tool for active traders who want to make efficient and well-structured trading decisions.
SMC Post-Analysis Lab [PhenLabs]📊 SMC Post-Analysis Lab
Version: PineScript™ v6
📌 Description
The SMC Post-Analysis Lab is a dedicated hindsight analysis tool built for traders who want to understand what really happened during any historical trading period. Unlike forward-looking indicators, this tool lets you scroll back through time and instantly receive algorithmic classification of market states using Smart Money Concepts methodology.
Whether you’re reviewing a losing trade, studying a successful session, or building your pattern recognition skills, this indicator provides immediate context. The expansion-aware algorithm processes price action within your selected window and outputs clear, actionable classifications ranging from Parabolic Expansion to Consolidation Inducements.
Stop relying on subjective post-trade analysis. Let the algorithm objectively tell you whether institutional players were accumulating, distributing, or running inducements during your trades.
🚀 Points of Innovation
First indicator specifically designed for SMC-based post-trade review rather than live signal generation
Dual-mode analysis system allowing both dynamic scrollback and precise date selection
Expansion-aware classification algorithm that weighs range position against net displacement
Real-time efficiency metrics calculating directional quality of price movement
Integrated visual FVG detection within the analysis window only
Interactive table with clickable date range adjustment via chart interface
🔧 Core Components
Pivot Detection Engine: Uses configurable pivot length to identify significant swing highs and lows for structure break detection
Window Calculator: Determines active analysis zone based on either bar offset or timestamp boundaries
Data Aggregator: Tracks window open, high, low, close and counts bullish/bearish structure break events
State Classification Algorithm: Applies hierarchical logic to determine market state from six possible classifications
Visual Renderer: Draws structure breaks, FVG boxes, and window highlighting within the active zone
🔥 Key Features
Sliding Window Mode: Use the Scroll Back slider to dynamically move your analysis zone backwards through history bar-by-bar
Date Range Mode: Select specific start and end timestamps for precise session or trade review
Six Market State Classifications: Parabolic Expansion (Bull/Bear), Bullish/Bearish Order Flow, Accumulation/Distribution Reversal, and Consolidation/Inducement
Range Position Percentile: See exactly where price closed relative to the window’s high-low range as a percentage
Bull/Bear Event Counter: Quantified count of structure breaks in each direction during the analysis period
Efficiency Calculation: Net move divided by total range reveals trending quality versus chop
🎨 Visualization
Blue Window Highlight: Active analysis zone is clearly marked with blue background shading on the chart
Structure Break Lines: Dashed lines appear at each bullish or bearish structure break within the window
FVG Boxes: Fair Value Gaps automatically render as semi-transparent boxes in bullish or bearish colors
Dashboard Table: Top-right positioned table displays State, Analysis description, and Metrics in real-time
Color-Coded States: Each classification uses distinct coloring for immediate visual recognition
Interactive Tip Row: Optional help text guides users on clicking the table to adjust date range
📖 Usage Guidelines
General Configuration
Analysis Mode: Default is Sliding Window. Choose Date Range for specific timestamp analysis.
Sliding Window Settings
Scroll Back (Bars): Default 0. Increase to move window backwards into history.
Window Width (Bars): Default 100. Range 20-50 for scalping, 100+ for swing analysis.
Date Range Settings
Start Date: Select the beginning timestamp for your analysis period.
End Date: Select the ending timestamp for your analysis period.
Visual Settings
Show Help Tip: Default true. Toggle to hide instructional row in dashboard.
Bullish Color: Default teal. Customize for bullish elements.
Bearish Color: Default red. Customize for bearish elements.
SMC Parameters
Pivot Length: Default 5. Lower values (3-5) catch minor breaks. Higher values (10+) focus on major swings.
✅ Best Use Cases
Post-trade review to understand why entries succeeded or failed
Session analysis to identify institutional activity patterns
Trade journaling with objective algorithmic classifications
Pattern recognition training through historical scrollback
Identifying whether stop hunts were inducements or legitimate breaks
Comparing your real-time read versus what the algorithm detected
⚠️ Limitations
Designed for historical analysis only, not live trade signals
Classification accuracy depends on appropriate pivot length for the timeframe
FVG detection uses simple gap logic without mitigation tracking
State classification is based on window data only, not broader context
Requires manual scrolling or date input to review different periods
💡 What Makes This Unique
Purpose-Built for Review: Unlike most indicators focused on live signals, this is designed specifically for post-trade analysis
Expansion-Aware Logic: Algorithm weighs both position in range AND directional efficiency for accurate state detection
Interactive Date Control: Click the dashboard table to reveal draggable anchors for window adjustment directly on chart
🔬 How It Works
1. Window Definition:
User selects either Sliding Window or Date Range mode
System calculates which bars fall within the active analysis zone
Active zone receives blue background highlighting
2. Data Collection:
Algorithm captures window open, running high, running low, and current close
Structure breaks are detected when price crosses above last pivot high or below last pivot low
Bullish and bearish events are counted separately
3. State Classification:
Range Position calculates where close sits as percentage of high-low range
Efficiency calculates net move divided by total range
Hierarchical logic applies priority rules from Parabolic states down to Consolidation
4. Output Rendering:
Dashboard table updates with State title, Analysis description, and Metrics
Visual elements render within window only to keep chart clean
Colors reflect bullish, bearish, or neutral classification
💡 Note:
This indicator is intended for educational and review purposes. Use it to develop your understanding of Smart Money Concepts by analyzing what institutional order flow looked like during historical periods. Combine insights with your own analysis methodology for best results.

Advanced Multi-Level S/R ZonesAdvanced Multi-Level S/R Zones: The Comprehensive Guide
1. Introduction: The Evolution of Support & Resistance:
Support and Resistance (S/R) is the backbone of technical analysis. However, traditional methods of drawing these levels are often plagued by subjectivity. Two traders looking at the same chart will often draw two different lines. Furthermore, standard indicators often treat every price point equally, ignoring the critical context of Volume and Time.
The Advanced Multi-Level S/R Zones script represents a paradigm shift. It moves away from subjective line drawing and toward Quantitative Zoning. By utilizing statistical measures of variability (Standard Deviation, MAD, IQR) combined with Volume-Weighting and Time-Decay algorithms, this tool identifies where price is mathematically most likely to react. It treats S/R not as thin lines, but as dynamic zones of probability.
2. Core Logic and Mathematical Foundation:
To understand how to use this tool optimally, one must understand the "engine" under the hood. The script operates on four distinct pillars of logic:
A. Session-Based Data Collection:
The script does not look at every single tick. Instead, it aggregates data into "Sessions" (daily bars by default logic). It extracts the High, Low, and Total Volume for every session within the user-defined lookback period. This filters out intraday noise and focuses on the macro structure of the market.
B. Adaptive Statistical Variability:
Most Bollinger Band-style indicators use Standard Deviation (StdDev) to measure width. However, StdDev is heavily influenced by outliers (extreme wicks). This script offers a sophisticated Adaptive Method-Skewness Detection: The script calculates the skewness of the price distribution. Adaptive Selection: If the data is highly skewed (lots of outliers, typical in Crypto), it switches to MAD (Median Absolute Deviation). MAD is robust and ignores outliers. If the data is moderately skewed, it uses IQR (Interquartile Range). If the data is normal (Gaussian), it uses StdDev.
Benefit: This ensures the zone widths are accurate regardless of whether you are trading a stable Forex pair or a volatile Altcoin.
C. The Weighting Engine (Volume + Time)
Not all price history is equal. This script assigns a "Weight Score" to every session based on two factors:
Volume Weighting: Sessions with massive volume (institutional activity) are given higher importance. A high formed on low volume is less significant than a high formed on peak volume.
Time Decay: Recent price action is more relevant than price action from 50 bars ago. The script applies a decay factor (default 0.85). This means a session from yesterday has 100% impact, while a session from 10 days ago has significantly less influence on the zone calculation.
D. Clustering Algorithm
Once the data is weighted, the script runs a clustering algorithm. It looks for price levels where multiple session Highs (for Resistance) or Lows (for Support) congregate.
It requires a minimum number of points to form a zone (User Input: minPoints).
It merges nearby levels based on the Cluster Separation Factor.
This results in "Primary," "Secondary," and "Tertiary" zones based on the strength and quantity of data points in that cluster.
3. Detailed Features and Inputs Breakdown:
Group 1: Main Settings
Lookback Sessions (Default: 10): Defines how far back the script looks for pivots. A higher number (e.g., 50) creates long-term structural zones. A lower number (e.g., 5) creates short-term scalping zones.
Variability Method (Adaptive): As described above, leave this on "Adaptive" for the best results across different assets.
Zone Width Multiplier (Default: 0.75): Controls the vertical thickness of the zones. Increase this to 1.0 or 1.5 for highly volatile assets to ensure you catch the wicks.
Minimum Points per Zone: The strictness filter. If set to 3, a price level must be hit 3 times within the lookback to generate a zone. Higher numbers = fewer, but stronger zones.
Group 2: Weighting
Volume-Weighted Zones: Crucial for identifying "Smart Money" levels. Keep this TRUE.
Time Decay: Ensures the zones update dynamically. If price moves away from a level for a long time, the zone will fade in significance.
ATR-Normalized Zone Width: This is a dynamic volatility filter. If TRUE, the zone width expands and contracts based on the Average True Range. This is vital for maintaining accuracy during market breakouts or crashes.
Group 3: Zone Strength & Scoring
The script calculates a "Score" (0-100%) for every zone based on:
-Point Count: More hits = higher score.
-Touches: How many times price wicked into the zone recently.
-Intact Status: Has the zone been broken?
-Weight: Volume/Time weight of the constituent points.
-Track Zone Touches: Looks back n bars to see how often price respected this level.
-Touch Threshold: The sensitivity for counting a "touch."
Group 4: Visuals & Display
Extend Bars: How far to the right the boxes are drawn.
Show Labels: Displays the Score, Tier (Primary/Secondary), and Status (Retesting).
Detect Pivot Zones (Overlap): This is a killer feature. It detects where a Support Zone overlaps with a Resistance Zone.
Significance: These are "Flip Zones" (Old Resistance becomes New Support). They are colored differently (Orange by default) and represent high-probability entry areas.
Group 5: Signals & Alerts
Entry Signals: Plots Buy/Sell labels when price rejects a zone.
Detect Break & Retest: specifically looks for the "Break -> Pullback -> Bounce" pattern, labeled as "RETEST BUY/SELL".
Proximity Alert: Triggers when price gets within x% of a zone.
4. Understanding the Visuals (Interpreting the Chart)
When you load the script, you will see several visual elements. Here is how to read them:
The Boxes (Zones)
Red Shades: Resistance Zones.
Dark Red (Solid Border): Primary Resistance. The strongest wall.
Lighter Red (Dashed Border): Secondary/Tertiary. Weaker, but still relevant.
Green Shades: Support Zones.
Dark Green (Solid Border): Primary Support. The strongest floor.
Orange Boxes: Pivot Zones. These are areas where price has historically reacted as both support and resistance. These are the "Line in the Sand" for trend direction.
The Labels & Emojis
The script assigns emojis to zone strength:
🔥 (Fire): Score > 80%. A massive level. Expect a strong reaction.
⭐ (Star): Score > 60%. A solid structural level.
✓ (Check): Score > 40%. A standard level.
"⟳ RETESTING": Appears when a zone was broken, and price is currently pulling back to test it from the other side.
The Dashboard (Top Right)
A statistics table provides a "Head-Up Display" for the asset:
High/Low σ (Sigma): The variability of the highs and lows. If High σ is much larger than Low σ, it implies the tops are erratic (wicks) while bottoms are clean (flat).
Method: Shows which statistical method the Adaptive engine selected (e.g., "MAD (auto)").
ATR: Current volatility value used for normalization.
5. Strategies for Optimum Output
To get the most out of this script, you should not just blindly follow the lines. Use these specific strategies:
Strategy A: The "Zone Fade" (Range Trading)
This works best in sideways markets.
Identify a Primary Support (Green) and Primary Resistance (Red).
Wait for price to enter the zone.
Look for the "SUPPORT BOUNCE" or "RESISTANCE REJECTION" signal label.
Entry: Enter against the zone (Buy at support, Sell at resistance).
Stop Loss: Place just outside the zone width. Because the zones are calculated using volatility stats, a break of the zone usually means the trade is invalid.
Strategy B: The "Pivot Flip" (Trend Following)
This is the highest probability setup in trending markets.
Look for an Orange Pivot Zone.
Wait for price to break through a Resistance Zone cleanly.
Wait for the price to return to that zone (which may now turn Orange or act as Support).
Look for the "RETEST BUY" label.
Logic: Old resistance becoming new support is a classic sign of trend continuation. The script automates the detection of this exact geometric phenomenon.
Strategy C: The Volatility Squeeze
Look at the Dashboard. Compare High σ and Low σ.
If the values are dropping rapidly or becoming very small, the zones will contract (become narrow).
Narrow zones indicate a "Squeeze" or compression in price.
Prepare for a violent breakout. Do not fade (trade against) narrow zones; look to trade the breakout.
6. Optimization & Customization Guide
Different markets require different settings. Here is how to tune the script:
For Crypto & Volatile Stocks (Tesla, Nvidia)
Method: Set to Adaptive (Mandatory, as these assets have "Fat Tails").
Multiplier: Increase to 1.0 - 1.25. Crypto wicks are deep; you need wider zones to avoid getting stopped out prematurely.
Lookback: 20-30 sessions. Crypto has a long memory; short lookbacks generate too much noise.
For Forex (EURUSD, GBPJPY)
Method: You can force StdDev or IQR. Forex is more mean-reverting and Gaussian.
Multiplier: Decrease to 0.5 - 0.75. Forex levels are often very precise to the pip.
Volume Weighting: You may turn this OFF for Forex if your broker's volume data is unreliable (since Forex has no centralized volume), though tick volume often works fine.
For Scalping (1m - 15m Timeframes)
Lookback: Decrease to 5-10. You only care about the immediate session history.
Decay Factor: Decrease to 0.5. You want the script to forget about yesterday's price action very quickly.
Touch Lookback: Decrease to 20 bars.
For Swing Trading (4H - Daily Timeframes)
Lookback: Increase to 50.
Decay Factor: Increase to 0.95. Structural levels from weeks ago are still highly relevant.
Min Points: Increase to 3 or 4. Only show levels that have been tested multiple times.
7. Advantages Over Standard Tools:
Feature Standard S/R Indicator, Advanced Multi-Level S/R Calculation, Uses simple Pivots or Fractals, Uses Statistical Distributions (MAD/IQR). Zone Width Arbitrary or Fixed Adaptive based on Volatility & ATR.
Context Ignores Volume Volume Weighted (Smart Money tracking).
Time Relevance Old levels = New levels Time Decay (Recency bias applied).
Overlaps Usually ignores overlaps Detects Pivot Zones (Res/Sup Flip).
Scoring None 0-100% Strength Score per zone.
8. Conclusion:
The Advanced Multi-Level S/R Zones script is not just a drawing tool; it is a statistical analysis engine. By accounting for the skewness of data, the volume behind the moves, and the decay of time, it provides a strictly objective roadmap of the market structure.
For the optimum output, combine the Pivot Zone identification with the Retest Signals. This aligns you with the underlying flow of order blocks and prevents trading against the statistical probabilities of the market.

Impulsive Trend Detector [dtAlgo]This advanced Pine Script indicator identifies and tracks impulsive price movements based on Break of Structure (BOS) and Change of Character (CHoCH) concepts from Smart Money trading methodology.
The indicator automatically detects pivot highs and lows, then monitors when price breaks these key levels to signal potential impulsive moves. BOS indicates continuation in the current trend direction, while CHoCH signals potential trend reversals. Each detected move is measured from the break point to the next opposing pivot, providing accurate percentage calculations that match TradingView's measuring tool.
Impulsive moves are categorized into four levels based on magnitude (Level 1: 5-10%, Level 2: 10-15%, Level 3: 15-20%, Level 4: 20%+), with color-coded visual labels and connecting lines displayed directly on the chart.
Comprehensive Session Analysis:
Track moves across 11 distinct trading sessions in Eastern Time: Pre-London/NY, London/NY overlap, NY (with Power Hour and End subdivisions), Sydney, Asia, Sake Time, Asia/London overlap, London, Weekend, and No Session periods.
Three Dynamic Tables provide:
Real-time statistics (bullish/bearish, BOS/CHoCH, levels)
Session breakdown with move counts and average percentages
Event log showing last 10 moves with date, day, session, direction, type, level, percentage, duration, and bar count
Perfect for Smart Money traders seeking data-driven insights into market structure behavior across global trading sessions.

CCI Standard DeviationCCI Standard Deviation – Asymmetric Volatility-Adjusted Trend Filter (CCI SD)
The Commodity Channel Index (CCI), created by Donald Lambert in 1980, measures how far the typical price deviates from its statistical average to identify cyclical momentum and trend strength.
The standard formula is:
CCI = (Typical Price − SMA(Typical Price, n)) / (0.015 × Mean Deviation)
where Typical Price = (High + Low + Close)/3.
CCI is unbounded and centered around zero: sustained readings above zero indicate bullish momentum, below zero bearish. Classic interpretations often use zero-line crosses or fixed levels (±100, ±200, ±250), but these can be unreliable when CCI volatility changes across market regimes.
This indicator was developed to create a more disciplined trend-following tool that aligns with my core risk principle: “always protect to the downside.”
Starting from the standard CCI zero-line concept for trend direction, I experimented with standard deviation bands to make the oscillator volatility-adjusted. I then applied deliberate asymmetry: requiring the lower 1σ envelope (CCI − stdev) to cross above a positive threshold for bullish confirmation (high-probability entry only in robust trends), while exiting immediately on any raw CCI weakness below a negative threshold (quick downside protection). User inputs for both thresholds were added to allow fine-tuning and adaptability across different assets and timeframes.
An optional DEMA-smoothed version of the lower envelope provides additional clarity when desired.
Extreme zones
raw CCI ±240 and lower envelope > 200 or < –200 - are highlighted with background shading to flag rare acceleration or capitulation phases.
How it works
Standard CCI calculated on typical price (default length 38).
Rolling standard deviation of the CCI itself (default length 13) measures the oscillator’s recent volatility.
Lower envelope = CCI − stdev (dn).
Optional DEMA smoothing (default length 12) can be toggled.
Trend logic:
Bullish regime only when lower envelope
→ Long Threshold (default +10)
→ statistical proof of strength
Bearish/neutral immediately when raw CCI
→ Short Threshold (default –25)
→ fast downside protection
Origin and development
The indicator emerged from wanting a cleaner, more reliable CCI for trend direction. After testing volatility-adjusted versions, the asymmetric design proved superior:
it enters only high-conviction uptrends and exits rapidly on weakness, significantly reducing whipsaws while preserving trend capture.
Parameters were optimized through extensive backtests on major assets (BTC, ETH, SOL and many more Cryptos; Magnificent 7 stocks, QQQ, SPX, gold).
The defaults were selected for the best average Sortino ratio and lowest maximum drawdown across this broad universe, ensuring robustness and avoiding single-asset overfitting.
How to use it
Green triangle below bar
→ lower envelope crosses above Long Threshold
→ high-conviction bullish trend confirmed
→ enter or add to longs
Magenta triangle above bar
→ CCI crosses below Short Threshold
→ exit longs or go cash/short
While lower envelope remains above Long Threshold
→ hold bullish positions
Extreme background shading (dn >200 or CCI ±240)
→ rare high-attention zones (potential acceleration or exhaustion)
Recommended defaults
CCI length: 38
SD length: 13
Long threshold: +10
Short threshold: –25
Optional MA length: 12 (DEMA of lower envelope)
All visual elements (bar coloring, signals, background, smoothed line) are toggleable for personal preference.
This indicator is designed as a trend-strength and risk-management filter and is not intended as a standalone trading system.
Disclaimer:
This is not financial advice. Backtests are based on past results and are not indicative of future performance.

UVOL Thrust TrackerUVOL Thrust Tracker identifies institutional breadth thrusts using NYSE up-volume as a percentage of total volume (USI:UVOL / USI:TVOL), plotted directly on price.
The indicator highlights:
TRUE 90% UVOL thrusts (rare, high-conviction breadth events)
Surrogate thrust clusters (multi-day 80–89% participation)
Cluster failures (momentum that fails to expand)
Structural thrust failures (2022-style false starts)
A regime filter based on the chart symbol’s moving averages separates bull vs bear environments, dynamically adjusting thresholds and failure logic.
This tool is designed for regime confirmation and risk management, not short-term entries. TRUE thrusts typically confirm trend continuation, while failures warn when breadth support breaks down.
Note: This indicator is intended for regime and risk assessment, not precise entries or exits.

Price Prediction Forecast ModelPrice Prediction Forecast Model
This indicator projects future price ranges based on recent market volatility.
It does not predict exact prices — instead, it shows where price is statistically likely to move over the next X bars.
How It Works
Price moves up and down by different amounts each bar. This indicator measures how large those moves have been recently (volatility) using the standard deviation of log returns.
That volatility is then:
Projected forward in time
Scaled as time increases (uncertainty grows)
Converted into future price ranges
The further into the future you project, the wider the expected range becomes.
Volatility Bands (Standard Deviation–Based)
The indicator plots up to three projected volatility bands using standard deviation multipliers:
SD1 (1.0×) → Typical expected price movement
SD2 (1.25×) → Elevated volatility range
SD3 (1.5×) → High-volatility / stress range
These bands are based on standard deviation of volatility, not fixed probability guarantees.
Optional Drift
An optional drift term can be enabled to introduce a long-term directional bias (up or down).
This is useful for markets with persistent trends.


Harmonic Patterns [kingthies]Harmonic Patterns
This indicator scans price swings for classic X-A-B-C-D harmonic patterns and plots the structure plus a PRZ (Potential Reversal Zone) to help you frame areas where reactions are statistically more likely. It supports both bullish and bearish setups and can trigger alerts when a new D pivot confirms a pattern.
What it does
Builds a pivot-based swing map (ZigZag-style) using a configurable Pivot Length .
Evaluates the most recent 5 swing points (X, A, B, C, D) against harmonic ratio rules with a user-defined tolerance .
Detects: Gartley, Bat, Butterfly, Crab, Deep Crab, Cypher, Shark (loose) .
Draws the pattern legs (X-A-B-C-D), labels the detection with ratio readouts, and projects a PRZ using 3 target levels (derived from XA/BC logic per pattern).
Offers two rendering modes:
Best only : picks the closest match (lowest score) to reduce clutter.
Show all : plots every valid match (uses filled PRZ boxes to keep object usage under control).
PRZ (Potential Reversal Zone)
PRZ is built from three target levels and expanded into a zone.
Optional padding uses ATR (ATR multiplier) to widen/narrow the zone for volatility.
Display modes: Off, Box, Lines, Both .
Zones can be extended forward by a configurable number of bars to keep the area visible as price develops.
How to use
Start with Confirm only when D pivot forms enabled (recommended) to reduce false positives while patterns are still forming.
Adjust Pivot Length based on timeframe:
Lower values = more swings, more signals, more noise.
Higher values = cleaner structures, fewer signals.
Use Ratio Tolerance to control strictness:
Lower tolerance = fewer, higher-confidence matches.
Higher tolerance = more matches, potentially lower quality.
Treat harmonics as context , not a standalone entry system:
Look for confluence (HTF levels, structure, volume, momentum/RSI divergence, etc.).
Use your own confirmation and risk plan (invalidations beyond PRZ / beyond D).
Settings overview
Swings (Pivot ZigZag)
Pivot Length: pivot sensitivity.
Use Wicks: uses High/Low; if off, uses Close.
Max Stored Swings: limits stored pivots for performance/object control.
Harmonic Detection
Ratio Tolerance (%): allowed deviation around ideal ratios.
Confirm only when D pivot forms: reduces repaint-like behavior.
When multiple match: Best only vs Show all.
Pattern Filters enable/disable each pattern type.
PRZ
PRZ Display: Off / Box / Lines / Both.
PRZ Padding (ATR multiplier): volatility-adjusted zone padding.
PRZ Extend (bars): how far to project the zone.
Visuals
Draw Legs: draws X-A-B-C-D.
Show Pattern Label: prints pattern name, direction, ratios, and score.
Label Offset: shift label forward if you want more space.
Alerts
“Bullish/Bearish Harmonic (Any)” triggers on any detected pattern.
Per-pattern alerts are included for each supported pattern type.
Notes
This indicator is educational and intended to assist with pattern recognition and confluence mapping.
Harmonic patterns do not guarantee reversals—always manage risk and confirm with your own process.

Gaps IdentifierThis indicator identifies up and down Gaps using previous period's close price to the next period's open price. Potentially useful for Gap rebound strategies.
(Will identify gaps 4%–11% by default; can change in settings)

Multi-Timeframe Market Structure [MattyBTradez]Provides a Bullish or Bearish analysis based on market structure for the 1M, 5M, 15M, 30M, 1H, 4H, and 1D timeframes.

SMC Alpha Sentiment Hunter [Crypto Trade]The SMC Alpha Sentiment Hunter is an institutional-grade decision-support tool developed by the Crypto Trade community.
Unlike traditional lagging indicators, this script focuses on Smart Money Concepts (SMC) by analyzing real-time market sentiment data directly from Binance Futures.
Key Features:
- Real-time Open Interest (OI) Tracking: Confirms institutional capital flow.
- Long/Short Ratio (LSR) Analysis: Identifies retail positioning to spot "liquidity traps".
- Volume & Volatility Filters: Built-in ATR and Volume Moving Average to validate entry signals.
- Multi-Asset Compatibility: Optimized for a broad range of Binance Futures pairs on the 15-minute timeframe.
Logic:
Signals are triggered when institutional interest (OI) rises while retail traders (LSR) are caught on the wrong side of the trend, confirmed by RSI exhaustion and strong volume.
Disclaimer: For educational purposes only. Trading involves risk.

MACD Classic MT5 Style (2 Lines + Histogram)MACD Classic MT5 Style (แบบ MetaTrader 5) มีความแตกต่างจาก MACD ทั่วไปที่ใช้กันใน TradingView พอสมควรครับ นี่คือคำอธิบายว่ามันทำงานอย่างไรและอ่านค่าอย่างไรครับ:
1. ความแตกต่างสำคัญ (Key Difference)
MACD ทั่วไป (Standard):
มี 2 เส้น (เส้น MACD และ เส้น Signal)
ฮิสโตแกรม (แท่งกราฟ) คือ ส่วนต่าง (Gap) ระหว่าง 2 เส้นนั้น
MACD แบบ MT5 (Classic MT5):
เส้น MACD จะถูกวาดออกมาเป็น แท่งกราฟ (Histogram) แทนที่จะเป็นเส้น
เส้น Signal จะเป็น เส้น (Line) สีแดงพาดผ่านแท่งกราฟ
สรุปคือ: ในแบบ MT5 แท่งกราฟคือตัวพระเอก (MACD) ส่วนเส้นคือตัวช่วยกรอง (Signal)
Here is the English translation of the explanation:
MACD Classic MT5 Style vs. Standard MACD
The "Classic MT5 Style" MACD differs significantly from the standard MACD typically found on TradingView. Below is an explanation of its mechanics and how to interpret it.
1. Key Differences
Standard MACD (TradingView Default):
Displays 2 Lines (MACD Line and Signal Line).
The Histogram represents the difference (gap) between those two lines.
MT5 Style MACD (Classic):
The MACD value is plotted as a Histogram (bars) instead of a line.
The Signal Line appears as a standard Line (usually red) overlaying the histogram.
In summary: In the MT5 style, the Histogram represents the actual MACD Line, while the separate line acts as the Signal filter.

IDAHL | QuantEdgeBIDAHL | QuantEdgeB
🔍 Overview
The IDAHL indicator builds adaptive, volatility-aware threshold bands from two separate ALMA lines—one smoothed from recent highs, the other from recent lows—then uses percentiles of those lines to define a dynamic “high/low” channel. Price crossing above or below that channel triggers clear long/short signals, with on-chart candle coloring, fills, optional labels and even a built-in backtest table.
✨ Key Features
• 📈 Dual ALMA Bands (with DEMA pre-smoothing)
o High ALMA: ALMA applied to DEMA-smoothed highs (high → DEMA(30) → ALMA).
o Low ALMA: ALMA applied to DEMA-smoothed lows (low → DEMA(30) → ALMA).
• 📊 Percentile Thresholds
o Computes a high threshold at the Xth percentile of the High ALMA over a lookback window.
o Computes a low threshold at the Yth percentile of the Low ALMA.
o Shifts each threshold forward by a small period to reduce repainting.
• ⚡ Dynamic Channel Logic
o When price closes above the high percentile line, the “final” threshold flips down to the low percentile line (and vice versa), creating an adaptive channel that only moves when the outer bound is violated.
o Inside the channel, the threshold holds its last value to avoid whipsaw.
• 🎨 Visual & Alerts
o Plots the two percentile lines and fills between them with a color that reflects the current regime (green for long, yellow for neutral, orange for short).
o Colors your candles to match the active signal.
o Optional “Long”/“Short” labels on confirmed flips.
o Alert conditions fire on each long/short crossover.
• 📊 On-Chart Backtest Metrics
o Toggle on a small performance table—complete with win-rate, net P/L, drawdown—from your chosen start date, without any extra code.
⚙️ How It Works
1. Adaptive Smoothing (ALMA)
o Uses ALMA (Arnaud Legoux Moving Average) for smooth, low-lag filtering. In this script, the inputs are additionally pre-smoothed with DEMA(30) to reduce noise before ALMA is applied—improving stability on highs/lows.
2. Percentile Lines
o The High ALMA series feeds a linear-interpolation percentile function to generate the upper bound; the Low ALMA produces the lower bound.
o These lines are offset by a small look-ahead (X bars) to reduce repaint behavior.
3. Channel Logic
o Breakout Flip: When the selected source (default: Close) closes above the upper bound, the active threshold “jumps” to the lower bound—locking in a new channel until price next crosses.
o Breakdown Flip: Conversely, a close below the lower bound flips the threshold to the upper bound.
4. Signal Generation
o Long while the source is above the current “final” threshold.
o Short while below.
o Neutral inside the channel before any flip.
5. Visualization & Alerts
o Dynamic fills between the two percentile lines change hue as the regime flips.
o Candles adopt the regime color.
o Optional pinned “Long”/“Short” labels at flip bars.
o Alerts on every signal crossover of the zero-based regime line.
6. Backtest Table
o From your chosen start date, a mini-table displays cumulative P/L, win rate and drawdown for this strategy—handy for quick in-chart validation.
🎯 Who Should Use It
• Breakout Traders hunting for adaptive channels that auto-recenter on new highs/lows.
• Volatility Traders who want thresholds that expand and contract with market turbulence.
• Trend-Chasers seeking a fresh take on high/low channels with built-in smoothing.
• Systematic Analysts who appreciate on-chart backtesting without leaving TradingView.
⚙️ Default Settings
• ALMA Length: 14
• Percentile Length: 35 bars
• Percentile Lookback Period (offset): 4 bars
• Upper Percentile: 92%
• Lower Percentile: 50%
• Threshold Source: Close
• Visuals: Candle coloring on, labels off by default, “Strategy” palette
• Backtest Table: on by default (toggleable)
• Start Date (Backtest): 09 Oct 2017
📌 Conclusion
IDAHL blends two smooth, low-lag ALMA filters (fed by DEMA-smoothed highs/lows) with percentile-based channel construction for a self-rewiring high/low envelope. It gives you robust breakout/breakdown signals, immediate visual context via colored fills and candles, optional labels, alerts, and even performance stats—everything you need to spot and confirm regime shifts in one compact script.
🔹 Disclaimer : Past performance is not indicative of future results. Always backtest and align settings with your risk tolerance and objectives before live trading.
🔹 Strategic Advice : Always backtest, optimize, and align parameters with your trading objectives and risk tolerance before live trading.
