Stochastic Z-Score [AlgoAlpha]🟠 OVERVIEW
This indicator is a custom-built oscillator called the Stochastic Z-Score , which blends a volatility-normalized Z-Score with stochastic principles and smooths it using a Hull Moving Average (HMA). It transforms raw price deviations into a normalized momentum structure, then processes that through a stochastic function to better identify extreme moves. A secondary long-term momentum component is also included using an ALMA smoother. The result is a responsive oscillator that reacts to sharp imbalances while remaining stable in sideways conditions. Colored histograms, dynamic oscillator bands, and reversal labels help users visually assess shifts in momentum and identify potential turning points.
🟠 CONCEPTS
The Z-Score is calculated by comparing price to its mean and dividing by its standard deviation—this normalizes movement and highlights how far current price has stretched from typical values. This Z-Score is then passed through a stochastic function, which further refines the signal into a bounded range for easier interpretation. To reduce noise, a Hull Moving Average is applied. A separate long-term trend filter based on the ALMA of the Z-Score helps determine broader context, filtering out short-term traps. Zones are mapped with thresholds at ±2 and ±2.5 to distinguish regular momentum from extreme exhaustion. The tool is built to adapt across timeframes and assets.
🟠 FEATURES
Z-Score histogram with gradient color to visualize deviation intensity (optional toggle).
Primary oscillator line (smoothed stochastic Z-Score) with adaptive coloring based on momentum direction.
Dynamic bands at ±2 and ±2.5 to represent regular vs extreme momentum zones.
Long-term momentum line (ALMA) with contextual coloring to separate trend phases.
Automatic reversal markers when short-term crosses occur at extremes with supporting long-term momentum.
Built-in alerts for oscillator direction changes, zero-line crosses, overbought/oversold entries, and trend confirmation.
🟠 USAGE
Use this script to track momentum shifts and identify potential reversal areas. When the oscillator is rising and crosses above the previous value—especially from deeply negative zones (below -2)—and the ALMA is also above zero, this suggests bullish reversal conditions. The opposite holds for bearish setups. Reversal labels ("▲" and "▼") appear only when both short- and long-term conditions align. The ±2 and ±2.5 thresholds act as momentum warning zones; values inside are typical trends, while those beyond suggest exhaustion or extremes. Adjust the length input to match the asset’s volatility. Enable the histogram to explore underlying raw Z-Score movements. Alerts can be configured to notify key changes in momentum or zone entries.
Trendfollowing

Logarithmic Moving Average (LMA) [QuantAlgo]🟢 Overview
The Logarithmic Moving Average (LMA) uses advanced logarithmic weighting to create a dynamic trend-following indicator that prioritizes recent price action while maintaining statistical significance. Unlike traditional moving averages that use linear or exponential weights, this indicator employs logarithmic decay functions to create a more sophisticated price averaging system that adapts to market volatility and momentum conditions.
The indicator displays a smoothed signal line that oscillates around zero, with positive values indicating bullish momentum and negative values indicating bearish momentum. The signal incorporates trend quality assessment, momentum confirmation, and multiple filtering mechanisms to help traders and investors identify trend continuation and reversal opportunities across different timeframes and asset classes.
🟢 How It Works
The indicator's core innovation lies in its logarithmic weighting system, where weights are calculated using the formula: w = 1.0 / math.pow(math.log(i + steepness), 2) The steepness parameter controls how aggressively recent data is prioritized over historical data, creating a dynamic weight decay that can be fine-tuned for different trading styles. This logarithmic approach provides more nuanced weight distribution compared to exponential moving averages, offering better responsiveness while maintaining stability.
The LMA calculation combines multiple sophisticated components. First, it calculates the logarithmic weighted average of closing prices. Then it measures the slope of this average over a 10-period lookback: lmaSlope = (lma - lma ) / lma * 100 The system also incorporates trend quality assessment using R-squared correlation analysis of log-transformed prices, measuring how well the price data fits a linear trend model over the specified period.
The final signal generation uses the formula: signal = lmaSlope * (0.5 + rSquared * 0.5) which combines the LMA slope with trend quality weighting. When momentum confirmation is enabled, the indicator calculates annualized log-return momentum and applies a multiplier when the momentum direction aligns with the signal direction, strengthening confirmed signals while filtering out weak or counter-trend movements.
🟢 How to Use
1. Signal Interpretation and Threshold Zones
Positive Values (Above Zero): LMA slope indicating bullish momentum with upward price trajectory relative to logarithmic baseline
Negative Values (Below Zero): LMA slope indicating bearish momentum with downward price trajectory relative to logarithmic baseline
Zero Line Crosses: Signal transitions between bullish and bearish regimes, indicating potential trend changes
Long Entry Threshold Zone: Area above positive threshold (default 0.5) indicating confirmed bullish signals suitable for long positions
Short Entry Threshold Zone: Area below negative threshold (default -0.5) indicating confirmed bearish signals suitable for short positions
Extreme Values: Signals exceeding ±1.0 represent strong momentum conditions with higher probability of continuation
2. Momentum Confirmation and Visual Analysis
Signal Color Intensity: Gradient coloring shows signal strength, with brighter colors indicating stronger momentum
Bar Coloring: Optional price bar coloring matches signal direction for quick visual trend identification
Position Labels: Real-time position classification (Bullish/Bearish/Neutral) displayed on the latest bar
Momentum Weight Factor: When short-term log-return momentum aligns with LMA signal direction, the signal receives additional weight confirmation
Trend Quality Component: R-squared values weight the signal strength, with higher correlation indicating more reliable trend conditions
3. Examples: Preconfigured Settings
Default: Universally applicable configuration balanced for medium-term investing and general trading across multiple timeframes and asset classes.
Scalping: Highly responsive setup with shorter period and higher steepness for ultra-short-term trades on 1-15 minute charts, optimized for quick momentum shifts.
Swing Trading: Extended period with moderate steepness and increased smoothing for multi-day positions, designed to filter noise while capturing larger price swings on 1-4 hour and daily charts.
Trend Following: Maximum smoothing with lower steepness for established trend identification, generating fewer but more reliable signals optimal for daily and weekly timeframes.
Mean Reversion: Shorter period with high steepness for counter-trend strategies, more sensitive to extreme moves and reversal opportunities in ranging market conditions.

Momentum Trail Oscillator [AlgoAlpha]🟠 OVERVIEW
This script builds a Momentum Trail Oscillator designed to measure directional momentum strength and dynamically track shifts in trend bias using a combination of smoothed price change calculations and adaptive trailing bands. The oscillator aims to help traders visualize when momentum is expanding or contracting and to identify transitions between bullish and bearish conditions.
🟠 CONCEPTS
The core idea combines two methods. First, the script calculates a normalized momentum measure by smoothing price changes relative to their absolute values, which creates a bounded oscillator that highlights whether moves are directional or choppy. Second, it uses a trailing band mechanism inspired by volatility stops, where bands adapt to the oscillator’s volatility, adjusting the thresholds that define a shift in directional bias. This dual approach seeks to address both the magnitude and persistence of momentum, reducing false signals in ranging markets.
🟠 FEATURES
The momentum calculation applies Hull Moving Averages and double EMA smoothing to price changes, producing a smooth, responsive oscillator.
The trailing bands are derived by offsetting a weighted moving average of the oscillator by a multiple of recent momentum volatility. A directional state variable tracks whether the oscillator is above or below the bands, updating when the momentum crosses these dynamic thresholds.
Overbought and oversold zones are visually marked between fixed levels (+30/+40 and -30/-40), with color fills to highlight when momentum is in extreme areas. The script plots signals on both the oscillator pane and optionally overlays markers on the main price chart for clarity.
🟠 USAGE
To use the indicator, apply it to any symbol and timeframe. The “Oscillator Length” controls how sensitive the momentum line is to recent price changes—lower values react faster, higher values smooth out noise. The “Trail Multiplier” sets how far the adaptive bands sit from the oscillator mid-line, which affects how often trend state changes occur. When the momentum line rises into the upper filled area and then crosses back below +40, it signals potential overbought exhaustion. The opposite applies for the oversold zone below -40. The plotted trailing bands switch visibility depending on the current directional state: when momentum is trending up, the lower band acts as the active trailing stop, and when trending down, the upper band becomes active. Trend changes are marked with circular symbols when the direction variable flips, and optional overlay arrows appear on the price chart to highlight overbought or oversold reversals. Traders can combine these signals with their own price action or volume analysis to confirm entries or exits.

Volatility-Adjusted Momentum Score (VAMS) [QuantAlgo]🟢 Overview
The Volatility-Adjusted Momentum Score (VAMS) measures price momentum relative to current volatility conditions, creating a normalized indicator that identifies significant directional moves while filtering out market noise. It divides annualized momentum by annualized volatility to produce scores that remain comparable across different market environments and asset classes.
The indicator displays a smoothed VAMS Z-Score line with adaptive standard deviation bands and an information table showing real-time metrics. This dual-purpose design enables traders and investors to identify strong trend continuation signals when momentum persistently exceeds normal levels, while also spotting potential mean reversion opportunities when readings reach statistical extremes.
🟢 How It Works
The indicator calculates annualized momentum using a simple moving average of logarithmic returns over a specified period, then measures annualized volatility through the standard deviation of those same returns over a longer timeframe. The raw VAMS score divides momentum by volatility, creating a risk-adjusted measure where high volatility reduces scores and low volatility amplifies them.
This raw VAMS value undergoes Z-Score normalization using rolling statistical parameters, converting absolute readings into standardized deviations that show how current conditions compare to recent history. The normalized Z-Score receives exponential moving average smoothing to create the final VAMS line, reducing false signals while preserving sensitivity to meaningful momentum changes.
The visualization includes dynamically calculated standard deviation bands that adjust to recent VAMS behavior, creating statistical reference zones. The information table provides real-time numerical values for VAMS Z-Score, underlying momentum percentages, and current volatility readings with trend indicators.
🟢 How to Use
1. VAMS Z-Score Bands and Signal Interpretation
Above Mean Line: Momentum exceeds historical averages adjusted for volatility, indicating bullish conditions suitable for trend following
Below Mean Line: Momentum falls below statistical norms, suggesting bearish conditions or downward pressure
Mean Line Crossovers: Primary transition signals between bullish and bearish momentum regimes
1 Standard Deviation Breaks: Strong momentum conditions indicating statistically significant directional moves worth following
2 Standard Deviation Extremes: Rare momentum readings that often signal either powerful breakouts or exhaustion points
2. Information Table and Market Context
Z-Score Values: Current VAMS reading displayed in standard deviations (σ), showing how far momentum deviates from its statistical norm
Momentum Percentage: Underlying annualized momentum displayed as percentage return, quantifying the directional strength
Volatility Context: Current annualized volatility levels help interpret whether VAMS readings occur in high or low volatility environments
Trend Indicators: Directional arrows and change values provide immediate feedback on momentum shifts and market transitions
3. Strategy Applications and Alert System
Trend Following: Use sustained readings beyond the mean line and 1σ band penetrations for directional trades, especially when VAMS maintains position in upper or lower statistical zones
Mean Reversion: Focus on 2σ extreme readings for contrarian opportunities, particularly effective in sideways markets where momentum tends to revert to statistical norms
Alert Notifications: Built-in alerts for mean crossovers (regime changes), 1σ breaks (strong signals), and 2σ touches (extreme conditions) help monitor multiple instruments for both continuation and reversal setups

Wavelet-Trend ML Integration [Alpha Extract]Alpha-Extract Volatility Quality Indicator
The Alpha-Extract Volatility Quality (AVQ) Indicator provides traders with deep insights into market volatility by measuring the directional strength of price movements. This sophisticated momentum-based tool helps identify overbought and oversold conditions, offering actionable buy and sell signals based on volatility trends and standard deviation bands.
🔶 CALCULATION
The indicator processes volatility quality data through a series of analytical steps:
Bar Range Calculation: Measures true range (TR) to capture price volatility.
Directional Weighting: Applies directional bias (positive for bullish candles, negative for bearish) to the true range.
VQI Computation: Uses an exponential moving average (EMA) of weighted volatility to derive the Volatility Quality Index (VQI).
Smoothing: Applies an additional EMA to smooth the VQI for clearer signals.
Normalization: Optionally normalizes VQI to a -100/+100 scale based on historical highs and lows.
Standard Deviation Bands: Calculates three upper and lower bands using standard deviation multipliers for volatility thresholds.
Signal Generation: Produces overbought/oversold signals when VQI reaches extreme levels (±200 in normalized mode).
Formula:
Bar Range = True Range (TR)
Weighted Volatility = Bar Range × (Close > Open ? 1 : Close < Open ? -1 : 0)
VQI Raw = EMA(Weighted Volatility, VQI Length)
VQI Smoothed = EMA(VQI Raw, Smoothing Length)
VQI Normalized = ((VQI Smoothed - Lowest VQI) / (Highest VQI - Lowest VQI) - 0.5) × 200
Upper Band N = VQI Smoothed + (StdDev(VQI Smoothed, VQI Length) × Multiplier N)
Lower Band N = VQI Smoothed - (StdDev(VQI Smoothed, VQI Length) × Multiplier N)
🔶 DETAILS
Visual Features:
VQI Plot: Displays VQI as a line or histogram (lime for positive, red for negative).
Standard Deviation Bands: Plots three upper and lower bands (teal for upper, grayscale for lower) to indicate volatility thresholds.
Reference Levels: Horizontal lines at 0 (neutral), +100, and -100 (in normalized mode) for context.
Zone Highlighting: Overbought (⋎ above bars) and oversold (⋏ below bars) signals for extreme VQI levels (±200 in normalized mode).
Candle Coloring: Optional candle overlay colored by VQI direction (lime for positive, red for negative).
Interpretation:
VQI ≥ 200 (Normalized): Overbought condition, strong sell signal.
VQI 100–200: High volatility, potential selling opportunity.
VQI 0–100: Neutral bullish momentum.
VQI 0 to -100: Neutral bearish momentum.
VQI -100 to -200: High volatility, strong bearish momentum.
VQI ≤ -200 (Normalized): Oversold condition, strong buy signal.
🔶 EXAMPLES
Overbought Signal Detection: When VQI exceeds 200 (normalized), the indicator flags potential market tops with a red ⋎ symbol.
Example: During strong uptrends, VQI reaching 200 has historically preceded corrections, allowing traders to secure profits.
Oversold Signal Detection: When VQI falls below -200 (normalized), a lime ⋏ symbol highlights potential buying opportunities.
Example: In bearish markets, VQI dropping below -200 has marked reversal points for profitable long entries.
Volatility Trend Tracking: The VQI plot and bands help traders visualize shifts in market momentum.
Example: A rising VQI crossing above zero with widening bands indicates strengthening bullish momentum, guiding traders to hold or enter long positions.
Dynamic Support/Resistance: Standard deviation bands act as dynamic volatility thresholds during price movements.
Example: Price reversals often occur near the third standard deviation bands, providing reliable entry/exit points during volatile periods.
🔶 SETTINGS
Customization Options:
VQI Length: Adjust the EMA period for VQI calculation (default: 14, range: 1–50).
Smoothing Length: Set the EMA period for smoothing (default: 5, range: 1–50).
Standard Deviation Multipliers: Customize multipliers for bands (defaults: 1.0, 2.0, 3.0).
Normalization: Toggle normalization to -100/+100 scale and adjust lookback period (default: 200, min: 50).
Display Style: Switch between line or histogram plot for VQI.
Candle Overlay: Enable/disable VQI-colored candles (lime for positive, red for negative).
The Alpha-Extract Volatility Quality Indicator empowers traders with a robust tool to navigate market volatility. By combining directional price range analysis with smoothed volatility metrics, it identifies overbought and oversold conditions, offering clear buy and sell signals. The customizable standard deviation bands and optional normalization provide precise context for market conditions, enabling traders to make informed decisions across various market cycles.

Rolling Z-Score Trend [QuantAlgo]🟢 Overview
The Rolling Z-Score Trend measures how far the current price deviates from its rolling mean in terms of standard deviations. It transforms price data into standardized scores to identify overbought and oversold conditions while tracking momentum shifts.
The indicator displays a Z-Score line showing price deviation from statistical norms, with background momentum columns showing the rate of change in these deviations. This helps traders and investors identify mean reversion opportunities and momentum shifts across different asset classes and timeframes.
🟢 How It Works
The indicator uses the Z-Score formula: Z = (X - μ) / σ, where X is the current closing price, μ is the rolling mean, and σ is the rolling standard deviation over a user-defined lookback period. This creates a dynamic baseline that adapts to changing market conditions and standardizes price movements for interpretation across different assets and volatility conditions. The raw Z-Score undergoes 3-period EMA smoothing to reduce noise while maintaining responsiveness to market signals.
Beyond the basic Z-Score calculation, the indicator measures the rate of change in Z-Score values between successive bars, displayed as background momentum columns. This momentum component shows acceleration and deceleration of statistical deviations. All calculations are processed through confirmation filters, displaying signals only on confirmed bars to reduce premature signals based on incomplete price action.
🟢 How to Use
1. Z-Score Interpretation and Threshold Zones
Positive Values (Above Zero) : Price trading above statistical mean, suggesting bullish momentum or potential overbought conditions
Negative Values (Below Zero) : Price trading below statistical mean, suggesting bearish momentum or potential oversold conditions
Zero Line Crosses : Signal transitions between statistical regimes and potential trend changes
Upper Threshold Zone : Area above entry threshold (default 1.5) indicating potential overbought conditions
Lower Threshold Zone : Area below negative entry threshold (default -1.5) indicating potential oversold conditions
Extreme Values (±2.0 or higher) : Statistically significant deviations that may indicate reversal opportunities
2. Momentum Background Analysis and Info Table
Green Columns : Accelerating positive momentum in Z-Score values
Red Columns : Accelerating negative momentum in Z-Score values
Column Height : Magnitude of momentum change between bars
Momentum Divergence : When columns contradict primary Z-Score direction, often signals impending reversals
Info Table : Displays real-time numerical values for both Z-Score and momentum, including trend direction indicators and bar-to-bar change calculations for position management
3. Preconfigured Settings
Default : Balanced performance across multiple timeframes and asset classes for general trading and medium-term position management.
Scalping : Responsive setup for ultra-short-term trading on 1-15 minute charts with frequent signals and increased sensitivity to quick price movements.
Swing Trading : Optimized for multi-day positions with noise filtering, focusing on larger price swings. Most effective on 1-4 hour and daily timeframes.
Trend Following : Maximum smoothing that prioritizes established trends over short-term volatility. Generates fewer signals for daily and weekly charts.

Trend Flow Trail [AlgoAlpha]OVERVIEW
This script overlays a custom hybrid indicator called the Money Flow Trail which combines a volatility-based trend-following trail with a volume-weighted momentum oscillator. It’s built around two core components: the AlphaTrail—a dynamic band system influenced by Hull MA and volatility—and a smoothed Money Flow Index (MFI) that provides insights into buying or selling pressure. Together, these tools are used to color bars, generate potential reversal markers, and assist traders in identifying trend continuation or exhaustion phases in any market or timeframe.
CONCEPTS
The AlphaTrail calculates a volatility-adjusted channel around price using the Hull Moving Average as the base and an EMA of range as the spread. It adaptively shifts based on price interaction to capture trend reversals while avoiding whipsaws. The direction (bullish or bearish) determines both the band being tracked and how the trail locks in. The Money Flow Index (MFI) is derived from hlc3 and volume, measuring buying vs selling pressure, and is further smoothed with a short Hull MA to reduce noise while preserving structure. These two systems work in tandem: AlphaTrail governs directional context, while MFI refines the timing.
FEATURES
Dynamic AlphaTrail line with regime switching logic that controls directional bias and bar coloring.
Smoothed MFI with gradient coloring to visually communicate pressure and exhaustion levels.
Overbought/oversold thresholds (80/20), mid-level (50), and custom extreme zones (90/10) for deeper signal granularity.
Built-in take-profit signal logic: crossover of MFI into overbought with bullish AlphaTrail, or into oversold with bearish AlphaTrail.
Visual fills between price and AlphaTrail for clearer confirmation during trend phases.
Alerts for regime shifts, MFI crossovers, trail interactions, and bar color regime changes.
USAGE
Add the indicator to any chart. Use the AlphaTrail plot to define trend context: bullish (trailing below price) or bearish (trailing above). MFI values give supporting confirmation—favor long setups when MFI is rising and above 50 in a bullish regime, and shorts when MFI is falling and below 50 in a bearish regime. The colored fills help visually track strength; sharp changes in MFI crossing 80/20 or 90/10 zones often precede pullbacks or reversals. Use the plotted circles as optional take-profit signals when MFI and trend are extended. Adjust AlphaTrail length/multiplier and MFI smoothing to better match the asset’s volatility profile.

Dynamic Flow Ribbons [BigBeluga]🔵 OVERVIEW
A dynamic multi-band trend visualization system that adapts to market volatility and reveals trend momentum with layered ribbon channels.
Dynamic Flow Ribbons transforms price action into flowing trend bands that expand and contract with volatility. It not only shows the active directional bias but also visualizes how strong or weak the trend is through layered ribbons, making it easier to assess trend quality and structure.
🔵 CONCEPTS
Uses an adaptive trend detection system built on a volatility envelope derived from an EMA of the average price (HLC3).
Measures volatility using a long-period average of the high-low range, which scales the envelope width dynamically.
Trend direction flips when the average price crosses above or below these envelopes.
Ribbons form around the trend line to show how far price is stretching or compressing relative to the mean.
🔵 FEATURES
Volatility-Based Trend Line:
A thick, color-coded line tracks the current trend with smoother transitions between phases.
Multi-Layered Flow Ribbons:
Up to 10 bands (5 above and 5 below) radiate outward from the upper and lower envelopes, reflecting volatility strength and direction.
Trend Coloring & Transitions:
Ribbons and candles are dynamically colored based on trend direction— green for bullish , orange for bearish . Transparency fades with distance from the core trend band.
Real-Time Responsiveness:
Ribbon structure and trend shifts update in real time, adapting instantly to fast market changes.
🔵 HOW TO USE
Use the color and thickness of the core trend line to follow directional bias.
When ribbons widen symmetrically, it signals strong trend momentum .
Narrowing or overlapping ribbons can suggest consolidation or transition zones .
Combine with breakout systems or volume tools to confirm impulsive or corrective phases .
Adjust the “Length” (factor) input to tune sensitivity—higher values smooth trends more.
🔵 CONCLUSION
Dynamic Flow Ribbons offers a sleek and insightful view into trend strength and structure. By visualizing volatility expansion with directional flow, it becomes a powerful overlay for momentum traders, swing strategists, and trend followers who want to stay ahead of evolving market flows

Fibonacci Entry Bands [AlgoAlpha]OVERVIEW
This script plots Fibonacci Entry Bands, a trend-following and mean-reversion hybrid system built around dynamic volatility-adjusted bands scaled using key Fibonacci levels. It calculates a smoothed basis line and overlays multiple bands at fixed Fibonacci multipliers of either ATR or standard deviation. Depending on the trend direction, specific upper or lower bands become active, offering a clear framework for entry timing, trend identification, and profit-taking zones.
CONCEPTS
The core idea is to use Fibonacci levels—0.618, 1.0, 1.618, and 2.618—as multipliers on a volatility measure to form layered price bands around a trend-following moving average. Trends are defined by whether the basis is rising or falling. The trend determines which side of the bands is emphasized: upper bands for downtrends, lower bands for uptrends. This approach captures both directional bias and extreme price extensions. Take-profit logic is built in via crossovers relative to the outermost bands, scaled by user-selected aggressiveness.
FEATURES
Basis Line – A double EMA smoothing of the source defines trend direction and acts as the central mean.
Volatility Bands – Four levels per side (based on selected ATR or stdev) mark the Fibonacci bands. These become visible only when trend direction matches the side (e.g., only lower bands plot in an uptrend).
Bar Coloring – Bars are shaded with adjustable transparency depending on distance from the basis, with color intensity helping gauge overextension.
Entry Arrows – A trend shift triggers either a long or short signal, with a marker at the outermost band with ▲/▼ signs.
Take-Profit Crosses – If price rejects near the outer band (based on aggressiveness setting), a cross appears marking potential profit-taking.
Bounce Signals – Minor pullbacks that respect the basis line are marked with triangle arrows, hinting at continuation setups.
Customization – Users can toggle bar coloring, signal markers, and select between ATR/stdev as well as take-profit aggressiveness.
Alerts – All major signals, including entries, take-profits, and bounces, are available as alert conditions.
USAGE
To use this tool, load it on your chart, adjust the inputs for volatility method and aggressiveness, and wait for entries to form on trend changes. Use TP crosses and bounce arrows as potential exit or scale-in signals.

Intra_Candle_Welding by Chaitu50cIntra Candle Welding by Chaitu50c
This is a professional price action–based indicator designed to automatically detect and visualize *intra-candle reversal zones* using simple yet powerful logic. It highlights price levels where two consecutive opposite candles meet with a high probability of short-term market reaction.
Concept
The indicator identifies potential intraday support and resistance levels based on the "Intra Candle Welding" concept: when the close of one candle is very close to the open of the next candle, and the two candles have opposite directions (bullish followed by bearish, or bearish followed by bullish). These levels often attract market attention due to order flow imbalance created during such transitions.
How It Works
1. The indicator continuously monitors each new candle and checks if the current open is approximately equal to the previous close, within a configurable buffer.
2. It further ensures that the two candles form an opposite pair (green→red or red→green).
3. When a valid pair is detected, the indicator checks for existing active lines near this level. If no active line exists within the defined tolerance, it draws a new horizontal line at the detected level.
4. Each line is classified as either a potential resistance (from green→red pair) or support (from red→green pair).
5. Lines automatically extend rightward and update with each bar. If price breaks through the line beyond a configurable break buffer, the line stops extending and is visually marked as "broken."
6. The indicator intelligently manages the maximum number of lines on the chart by deleting the oldest ones when the limit is exceeded.
Use Case
Traders can use this tool to identify short-term reaction zones and potential intraday turning points. The highlighted levels act as temporary support and resistance areas where price frequently reacts. It is especially useful in fast-moving or volatile markets such as index futures or liquid stocks.
Features
* Automatically detects intra-candle reversal zones.
* Classifies zones as support (bottom) or resistance (top).
* Automatically updates and breaks lines when invalidated by price action.
* Adjustable parameters for flexibility:
* Equality Buffer
* Max Lines to Keep
* Line Suppression Tolerance
* Initial Extend Bars
* Break Buffer
* Line colors, widths, and styles (active and broken states)
* Efficient memory handling with capped line count.
* Minimalist and clean visual representation, suitable for overlay on any chart.
Recommended Settings
* Works best on intraday timeframes (1 min to 15 min).
* Tune the Equality Buffer and Tolerance parameters based on instrument volatility.
* Use conservative Break Buffer to avoid premature line invalidation.
Disclaimer
This is a tool to support discretionary trading decisions. It is not a standalone buy/sell signal generator. Users are advised to combine it with their own market context and risk management framework.
This indicator is released for the TradingView community for educational and practical trading use.
---

Adaptive MACD Deluxe [AlgoAlpha]OVERVIEW
This script is an advanced rework of the classic MACD indicator, designed to be more adaptive, visually informative, and customizable. It enhances the original MACD formula using a dynamic feedback loop and a correlation-based weighting system that adjusts in real-time based on how deterministic recent price action is. The signal line is flexible, offering several smoothing types including Heiken Ashi, while the histogram is color-coded with gradients to help users visually identify momentum shifts. It also includes optional normalization by volatility, allowing MACD values to be interpreted as relative percentage moves, making the indicator more consistent across different assets and timeframes.
CONCEPTS
This version of MACD introduces a deterministic weight based on R-squared correlation with time, which modulates how fast or slow the MACD adapts to price changes. Higher correlation means smoother, slower MACD responses, and low correlation leads to quicker reaction. The momentum calculation blends traditional EMA math with feedback and damping components to create a smoother, less noisy series. Heiken Ashi is optionally used for signal smoothing to better visualize short-term trend bias. When normalization is enabled, the MACD is scaled by an EMA of the high-low range, converting it into a bounded, volatility-relative indicator. This makes extreme readings more meaningful across markets.
FEATURES
The script offers six distinct options for signal line smoothing: EMA, SMA, SMMA (RMA), WMA, VWMA, and a custom Heiken Ashi mode based on the MACD series. Each option provides a different response speed and smoothing behavior, allowing traders to match the indicator’s behavior to their strategy—whether it's faster reaction or reduced noise.
Normalization is another key feature. When enabled, MACD values are scaled by a volatility proxy, converting the indicator into a relative percentage. This helps standardize the MACD across different assets and timeframes, making overbought and oversold readings more consistent and easier to interpret.
Threshold zones can be customized using upper and lower boundaries, with inner zones for early warnings. These zones are highlighted on the chart with subtle background fills and directional arrows when MACD enters or exits key levels. This makes it easier to spot strong or weak reversals at a glance.
Lastly, the script includes multiple built-in alerts. Users can set alerts for MACD crossovers, histogram flips above or below zero, and MACD entries into strong or weak reversal zones. This allows for hands-free monitoring and quick decision-making without staring at the chart.
USAGE
To use this script, choose your preferred signal smoothing type, enable normalization if you want MACD values relative to volatility, and adjust the threshold zones to fit your asset or timeframe. Use the colored histogram to detect changes in momentum strength—brighter colors indicate rising strength, while faded colors imply weakening. Heiken Ashi mode smooths out noise and provides clearer signals, especially useful in choppy conditions. Use alert conditions for crossover and reversal detection, or monitor the arrow markers for entries into potential exhaustion zones. This setup works well for trend following, momentum trading, and reversal spotting across all market types.

SMEMA Trend CoreSMEMA Trend Core is a multi-timeframe trend analysis tool designed to provide a clean, adaptive and structured view of the market’s directional bias. It can be used in short term, swing or long term contexts. The internal calculation adjusts automatically based on the selected trading style, while always combining data from six timeframes.
At its core, the indicator uses a SMEMA, which is a Simple Moving Average applied to an EMA. This combination improves smoothness without losing reactivity. The SMEMA is calculated separately on 1H, 4H, 1D, 3D, 1W and 1M timeframes. These six values are then combined using dynamic weights that depend on the trading mode:
Short Term mode gives more influence to 1H and 4H
Swing Trading mode gives more influence to 1D, 3D and 1W
Long Term mode gives more influence to 1W and 1M
However, all six timeframes are always included in the final result. This avoids the tunnel vision of relying on a single resolution and ensures that the indicator captures both local and structural movements.
The result is a synthetic trend line, called Global SMEMA, that adapts to market conditions and offers a realistic view of the ongoing trend. To enhance the reading, the indicator calculates a Trend Score. This score reflects the position of price relative to the Global SMEMA, scaled by a long-term ATR, and adjusted by the slope of the trend line. A hyperbolic tangent function is used to normalize values and reduce distortion from outliers.
The final score is capped between -10 and +10, and used to define the trend state:
Green when the trend is bullish (score > +1.5)
Red when the trend is bearish (score < -1.5)
Brown when the trend is neutral (score between -1.5 and +1.5)
Optional Deviation Bands can be displayed at ±1, ±2 and ±3 ATR distances around the central line. These dynamic zones help identify extended price movements or potential support and resistance areas, depending on the current trend bias.
Main features:
A single, stable trend line based on six timeframes
Automatic rebalancing depending on trading mode
Quantified score integrating distance and slope
No overreaction to short-term noise
Deviation zones for advanced market context
No repainting, no lookahead, 100% real-time
SMEMA Trend Core is not a signal tool. It is a directional framework that helps you stay aligned with the real structure of the market. Use it to confirm setups, filter trades or simply understand where the market stands in its trend cycle.

Kaufman Trend Strength Signal█ Overview
Kaufman Trend Strength Signal is an advanced trend detection tool that decomposes price action into its underlying directional trend and localized oscillation using a vector-based Kalman Filter.
By integrating adaptive smoothing and dynamic weighting via a weighted moving average (WMA), this indicator provides real-time insight into both trend direction and trend strength — something standard moving averages often fail to capture.
The core model assumes that observed price consists of two components:
(1) a directional trend, and
(2) localized noise or oscillation.
Using a two-step Predict & Update cycle, the filter continuously refines its trend estimate as new market data becomes available.
█ How It Works
This indicator employs a Kalman Filter model that separates the trend from short-term fluctuations in a price series.
Predict & Update Cycle : With each new bar, the filter predicts the price state and updates that prediction using the latest observed price, producing a smooth but adaptive trend line.
Trend Strength Normalization : Internally, the oscillator component is normalized against recent values (N periods) to calculate a trend strength score between -100 and +100.
(Note: The oscillator is not plotted on the chart but is used for signal generation.)
Filtered MA Line : The trend component is plotted as a smooth Kalman Filter-based moving average (MA) line on the main chart.
Threshold Cross Signals : When the internal trend strength crosses a user-defined threshold (default: ±60), visual entry arrows are displayed to signal momentum shifts.
█ Key Features
Adaptive Trend Estimation : Real-time filtering that adjusts dynamically to market changes.
Visual Buy/Sell Signals : Entry arrows appear when the trend strength crosses above or below the configured threshold.
Built-in Range Filter : The MA line turns blue when trend strength is weak (|value| < 10), helping you filter out choppy, sideways conditions.
█ How to Use
Trend Detection :
• Green MA = bullish trend
• Red MA = bearish trend
• Blue MA = no trend / ranging market
Entry Signals :
• Green triangle = trend strength crossed above +Threshold → potential bullish entry
• Red triangle = trend strength crossed below -Threshold → potential bearish entry
█ Settings
Entry Threshold : Level at which the trend strength triggers entry signals (default: 60)
Process Noise 1 & 2 : Control the filter’s responsiveness to recent price action. Higher = more reactive; lower = smoother.
Measurement Noise : Sets how much the filter "trusts" price data. High = smoother MA, low = faster response but more noise.
Trend Lookback (N2) : Number of bars used to normalize trend strength. Lower = more sensitive; higher = more stable.
Trend Smoothness (R2) : WMA smoothing applied to the trend strength calculation.
█ Visual Guide
Green MA Line → Bullish trend
Red MA Line → Bearish trend
Blue MA Line → Sideways/range
Green Triangle → Entry signal (trend strengthening)
Red Triangle → Entry signal (trend weakening)
█ Best Practices
In high-volatility conditions, increase Measurement Noise to reduce false signals.
Combine with other indicators (e.g., RSI, MACD, EMA) for confirmation and filtering.
Adjust "Entry Threshold" and noise settings depending on your timeframe and trading style.
❗ Disclaimer
This script is provided for educational purposes only and should not be considered financial advice or a recommendation to buy/sell any asset.
Trading involves risk. Past performance does not guarantee future results.
Always perform your own analysis and use proper risk management when trading.

Trend Scanner ProTrend Scanner Pro, Robust Trend Direction and Strength Estimator
Trend Scanner Pro is designed to evaluate the current market trend with maximum robustness, providing both direction and strength based on statistically reliable data.
This indicator builds upon the core logic of a previous script I developed, called Best SMA Finder. While the original script focused on identifying the most profitable SMA length based on backtested trade performance, Trend Scanner Pro takes that foundation further to serve a different purpose: analyzing and quantifying the actual trend state in real time.
It begins by testing hundreds of SMA lengths, from 10 to 1000 periods. Each one is scored using a custom robustness formula that combines profit factor, number of trades, and win rate. Only SMAs with a sufficient number of trades are retained, ensuring statistical validity and avoiding curve fitting.
The SMA with the highest robustness score is selected as the dynamic reference point. The script then calculates how far the price deviates from it using rolling standard deviation, assigning a trend strength score from -5 (strong bearish) to +5 (strong bullish), with 0 as neutral.
Two detection modes are available:
Slope mode, based on SMA slope reversals
Bias mode, based on directional shifts relative to deviation zones
Optional features:
Deviation bands for visual structure
Candle coloring to reflect trend strength
Compact table showing real-time trend status
This tool is intended for traders who want an adaptive, objective, and statistically grounded assessment of market trend conditions.

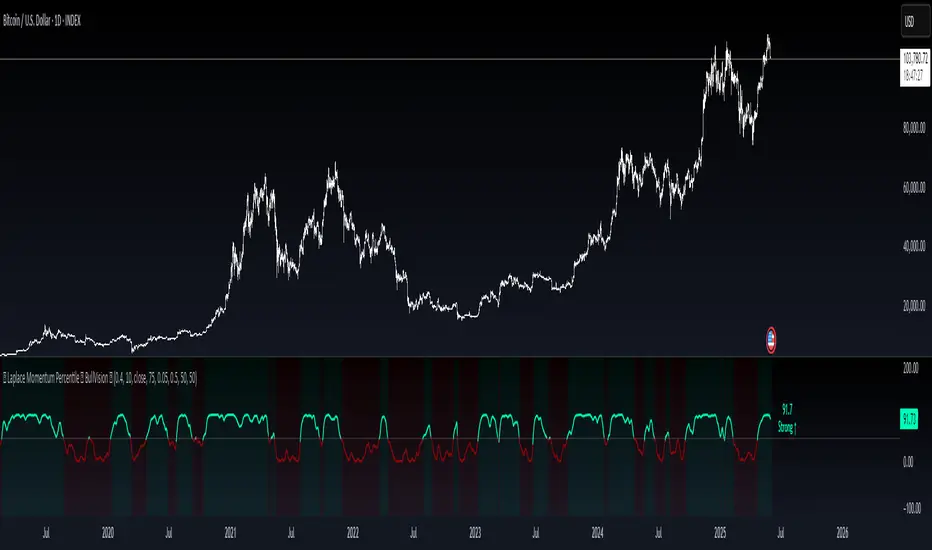
Laplace Momentum Percentile ║ BullVision 🔬 Overview
Laplace Momentum Percentile ║ BullVision is a custom-built trend analysis tool that applies Laplace-inspired smoothing to price action and maps the result to a historical percentile scale. This provides a contextual view of trend intensity, with optional signal refinement using a Kalman filter.
This indicator is designed for traders and analysts seeking a normalized, scale-independent perspective on market behavior. It does not attempt to predict price but instead helps interpret the relative strength or weakness of recent movements.
⚙️ Key Concepts
📉 Laplace-Based Smoothing
The core signal is built using a Laplace-style weighted average, applying an exponential decay to price values over a specified length. This emphasizes recent movements while still accounting for historical context.
🎯 Percentile Mapping
Rather than displaying the raw output, the filtered signal is converted into a percentile rank based on its position within a historical lookback window. This helps normalize interpretation across different assets and timeframes.
🧠 Optional Kalman Filter
For users seeking additional smoothing, a Kalman filter is included. This statistical method updates signal estimates dynamically, helping reduce short-term fluctuations without introducing significant lag.
🔧 User Settings
🔁 Transform Parameters
Transform Parameter (s): Controls the decay rate for Laplace weighting.
Calculation Length: Sets how many candles are used for smoothing.
📊 Percentile Settings
Lookback Period: Defines how far back to calculate the historical percentile ranking.
🧠 Kalman Filter Controls
Enable Kalman Filter: Optional toggle.
Process Noise / Measurement Noise: Adjust the filter’s responsiveness and tolerance to volatility.
🎨 Visual Settings
Show Raw Signal: Optionally display the pre-smoothed percentile value.
Thresholds: Customize upper and lower trend zone boundaries.
📈 Visual Output
Main Line: Smoothed percentile rank, color-coded based on strength.
Raw Line (Optional): The unsmoothed percentile value for comparison.
Trend Zones: Background shading highlights strong upward or downward regimes.
Live Label: Displays current percentile value and trend classification.
🧩 Trend Classification Logic
The indicator segments percentile values into five zones:
Above 80: Strong upward trend
50–80: Mild upward trend
20–50: Neutral zone
0–20: Mild downward trend
Below 0: Strong downward trend
🔍 Use Cases
This tool is intended as a visual and contextual aid for identifying trend regimes, assessing historical momentum strength, or supporting broader confluence-based analysis. It can be used in combination with other tools or frameworks at the discretion of the trader.
⚠️ Important Notes
This script does not provide buy or sell signals.
It is intended for educational and analytical purposes only.
It should be used as part of a broader decision-making process.
Past signal behavior should not be interpreted as indicative of future results.
SuperTrend Confluence Signals [AlgoAlpha]OVERVIEW
This script enhances the classic SuperTrend indicator by integrating volume dynamics, retracement detection, and a multi-asset trend matrix—alongside an automatic mitigation-level drawing system. It's designed for traders who want to see not just trend direction, but the confluence of trend strength, volatility-adjusted retracements, and capital flow through volume pressure. It visually maps key transitions in market structure while offering a clean, color-coded overview of multiple symbols and timeframes in a single chart.
CONCEPTS
At the core is the traditional SuperTrend , which determines directional bias using Average True Range (ATR) with a volatility multiplier. This script overlays that with a dynamic volume histogram that scales relative to recent volume standard deviation, coloring volume bursts within the trend. Retracement signals are triggered when price pulls back toward the SuperTrend level but respects it—quantified through normalized distance sensitivity. On top of that, the indicator automatically draws and manages horizontal support/resistance zones that appear at key trend shifts. These levels persist and are cleared based on configurable rules such as wick/body sweeps or consecutive candle closes. A multi-asset, multi-timeframe table then gives an instant snapshot of trend status across five user-defined symbols and timeframes.
FEATURES
SuperTrend : Configurable ATR length and multiplier for flexible trend sensitivity.
Volumetric Histogram : Gradient-filled candles anchored to SuperTrend bands, scaled by relative volume to indicate activity intensity during trends.
Retracement Arrows : Signals printed when price nears the SuperTrend level without breaking it, allowing identification of high-probability continuation zones.
Volume TP Markers : Diamond markers flag high-volume events, contextualizing price moves with liquidity bursts.
Automatic Structure Levels : Draws clean horizontal lines at significant trend transitions, with optional volatility-based band fills. These levels self-update and clear based on price interaction logic.
Trend Table : Displays trend direction (▲/▼) across five assets and five timeframes. Each cell is colored according to trend bias, providing a compact overview for multi-market confluence.
USAGE
Start by loading the indicator on your main chart and adjusting the ATR Length and Multiplier to match your strategy timeframe. Use lower values for scalping and higher values for swing trading. The histogram bars will appear as colored candles above or below the SuperTrend level, indicating how strong volume is within that trend. Arrow signals suggest minor pullbacks within the trend, which can act as entry opportunities. The level system will automatically plot key price zones during trend flips; if "Body" is selected for mitigation, price must close through the level to invalidate it. If "Wick" is chosen, a single wick breach is enough. Adjust expiry and rejection settings to fine-tune how long levels stay on chart. Finally, enable the Multi-Asset Table to view live trend signals across popular symbols like AAPL or NVDA in different timeframes, helping spot macro-to-micro alignment for higher-confidence trades.

Disparity Index with Volatility ZonesDisparity Index with Volatility Zones
is a momentum oscillator that measures the percentage difference between the current price and its simple moving average (SMA). This allows traders to identify overbought/oversold conditions, assess momentum strength, and detect potential trend reversals or continuations.
🔍 Core Concept:
The Disparity Index (DI) is calculated as:
DI = 100 × (Price − SMA) / SMA
A positive DI indicates the price is trading above its moving average (potential bullish sentiment), while a negative DI suggests the price is below the average (potential bearish sentiment).
This version of the Disparity Index introduces a dual-zone volatility framework, offering deeper insight into the market's current state.
🧠 What Makes This Version Unique?
1. High Volatility Zones
When DI crosses above +1.0% or below –1.0%, it often indicates the start or continuation of a strong trend.
Sustained readings beyond these thresholds typically align with trending phases, offering opportunities for momentum-based entries.
A reversal back within ±1.0% after exceeding these levels can suggest a shift in momentum — similar to how RSI exits the overbought/oversold zones before reversals.
These thresholds act as dynamic markers for breakout confirmation and potential trend exhaustion.
2. Low Volatility Zones
DI values between –0.5% and +0.5% define the low-volatility zone, shaded for visual clarity.
This area typically indicates market indecision, sideways price action, or consolidation.
Trading within this range may favor range-bound or mean-reversion strategies, as trend momentum is likely limited.
The logic is similar to interpreting a flat ADX, tight Bollinger Bands, or contracting Keltner Channels — all suggesting consolidation.
⚙️ Features:
Customizable moving average length and input source
Adjustable thresholds for overbought/oversold and low-volatility zones
Optional visual fill between low-volatility bounds
Clean and minimal chart footprint (non-essential plots hidden by default)
📈 How to Use:
1. Trend Confirmation:
A break above +1.0% can be used as a bullish continuation signal.
A break below –1.0% may confirm bearish strength.
Long periods above/below these thresholds support trend-following entries.
2. Reversal Detection:
If DI returns below +1.0% after exceeding it, bullish momentum may be fading.
If DI rises above –1.0% after falling below, bearish pressure may be weakening.
These shifts resemble overbought/oversold transitions in oscillators like RSI or Stochastic, and can be paired with divergence, volume, or price structure analysis for higher reliability.
3. Sideways Market Detection:
DI values within ±0.5% indicate low volatility or a non-trending environment.
Traders may avoid breakout entries during these periods or apply range-trading tactics instead.
Observing transitions out of the low-volatility zone can help anticipate breakouts.
4. Combine with Other Indicators:
DI signals can be enhanced using tools like MACD, Volume Oscillators, or Moving Averages.
For example, a DI breakout beyond ±1.0% supported by a MACD crossover or volume spike can help validate trend initiation.
This indicator is especially powerful when paired with Bollinger Bands:
A simultaneous price breakout from the Bollinger Band and DI moving beyond ±1.0% can help identify early trend inflection points.
This combination supports entering positions early in a developing trend, improving the efficiency of trend-following strategies and enhancing decision-making precision.
It also helps filter false breakouts when DI fails to confirm the move outside the band.
This indicator is designed for educational and analytical purposes and works across all timeframes and asset classes.
It is particularly useful for traders seeking a clear framework to identify momentum strength, filter sideways markets, and improve entry timing within a larger trading system.

Hurst Exponent Oscillator [PhenLabs]📊 Hurst Exponent Oscillator -
Version: PineScript™ v5
📌 Description
The Hurst Exponent Oscillator (HEO) by PhenLabs is a powerful tool developed for traders who want to distinguish between trending, mean-reverting, and random market behaviors with clarity and precision. By estimating the Hurst Exponent—a statistical measure of long-term memory in financial time series—this indicator helps users make sense of underlying market dynamics that are often not visible through traditional moving averages or oscillators.
Traders can quickly know if the market is likely to continue its current direction (trending), revert to the mean, or behave randomly, allowing for more strategic timing of entries and exits. With customizable smoothing and clear visual cues, the HEO enhances decision-making in a wide range of trading environments.
🚀 Points of Innovation
Integrates advanced Hurst Exponent calculation via Rescaled Range (R/S) analysis, providing unique market character insights.
Offers real-time visual cues for trending, mean-reverting, or random price action zones.
User-controllable EMA smoothing reduces noise for clearer interpretation.
Dynamic coloring and fill for immediate visual categorization of market regime.
Configurable visual thresholds for critical Hurst levels (e.g., 0.4, 0.5, 0.6).
Fully customizable appearance settings to fit different charting preferences.
🔧 Core Components
Log Returns Calculation: Computes log returns of the selected price source to feed into the Hurst calculation, ensuring robust and scale-independent analysis.
Rescaled Range (R/S) Analysis: Assesses the dispersion and cumulative deviation over a rolling window, forming the core statistical basis for the Hurst exponent estimate.
Smoothing Engine: Applies Exponential Moving Average (EMA) smoothing to the raw Hurst value for enhanced clarity.
Dynamic Rolling Windows: Utilizes arrays to maintain efficient, real-time calculations over user-defined lengths.
Adaptive Color Logic: Assigns different highlight and fill colors based on the current Hurst value zone.
🔥 Key Features
Visually differentiates between trending, mean-reverting, and random market modes.
User-adjustable lookback and smoothing periods for tailored sensitivity.
Distinct fill and line styles for each regime to avoid ambiguity.
On-chart reference lines for strong trending and mean-reverting thresholds.
Works with any price series (close, open, HL2, etc.) for versatile application.
🎨 Visualization
Hurst Exponent Curve: Primary plotted line (smoothed if EMA is used) reflects the ongoing estimate of the Hurst exponent.
Colored Zone Filling: The area between the Hurst line and the 0.5 reference line is filled, with color and opacity dynamically indicating the current market regime.
Reference Lines: Dash/dot lines mark standard Hurst thresholds (0.4, 0.5, 0.6) to contextualize the current regime.
All visual elements can be customized for thickness, color intensity, and opacity for user preference.
📖 Usage Guidelines
Data Settings
Hurst Calculation Length
Default: 100
Range: 10-300
Description: Number of bars used in Hurst calculation; higher values mean longer-term analysis, lower values for quicker reaction.
Data Source
Default: close
Description: Select which data series to analyze (e.g., Close, Open, HL2).
Smoothing Length (EMA)
Default: 5
Range: 1-50
Description: Length for smoothing the Hurst value; higher settings yield smoother but less responsive results.
Style Settings
Trending Color (Hurst > 0.5)
Default: Blue tone
Description: Color used when trending regime is detected.
Mean-Reverting Color (Hurst < 0.5)
Default: Orange tone
Description: Color used when mean-reverting regime is detected.
Neutral/Random Color
Default: Soft blue
Description: Color when market behavior is indeterminate or shifting.
Fill Opacity
Default: 70-80
Range: 0-100
Description: Transparency of area fills—higher opacity for stronger visual effect.
Line Width
Default: 2
Range: 1-5
Description: Thickness of the main indicator curve.
✅ Best Use Cases
Identifying if a market is regime-shifting from trending to mean-reverting (or vice versa).
Filtering signals in automated or systematic trading strategies.
Spotting periods of randomness where trading signals should be deprioritized.
Enhancing mean-reversion or trend-following models with regime-awareness.
⚠️ Limitations
Not predictive: Reflects current and recent market state, not future direction.
Sensitive to input parameters—overfitting may occur if settings are changed too frequently.
Smoothing can introduce lag in regime recognition.
May not work optimally in markets with structural breaks or extreme volatility.
💡 What Makes This Unique
Employs advanced statistical market analysis (Hurst exponent) rarely found in standard toolkits.
Offers immediate regime visualization through smart dynamic coloring and zone fills.
🔬 How It Works
Rolling Log Return Calculation:
Each new price creates a log return, forming the basis for robust, non-linear analysis. This ensures all price differences are treated proportionally.
Rescaled Range Analysis:
A rolling window maintains cumulative deviations and computes the statistical “range” (max-min of deviations). This is compared against the standard deviation to estimate “memory”.
Exponent Calculation & Smoothing:
The raw Hurst value is translated from the log of the rescaled range ratio, and then optionally smoothed via EMA to dampen noise and false signals.
Regime Detection Logic:
The smoothed value is checked against 0.5. Values above = trending; below = mean-reverting; near 0.5 = random. These control plot/fill color and zone display.
💡 Note:
Use longer calculation lengths for major market character study, and shorter ones for tactical, short-term adaptation. Smoothing balances noise vs. lag—find a best fit for your trading style. Always combine regime awareness with broader technical/fundamental context for best results.

The Ultimate Buy and Sell Indicator: Unholy Grail Edition"You see, Watson, the market is not random—it simply whispers in a code too complex for the average trader. Lucky for you, I am not average."
They searched for the Holy Grail of trading for decades—promises, false prophets, and overpriced PDFs.
But they were all looking in the wrong place.
This isn’t a relic buried in the desert.
This is the Unholy Grail — a machine-forged fusion of logic, engineering, and tactical overkill .
Built by Sherlock Macgyver , this is not a mystical object. It’s a surveillance system for trend detection, signal validation, and precision entries .
⚠️ Important: This script draws its own candles.
To see it properly, disable regular candles by turning off "Body", "Wick" and "Border" colors.
🔧 What You’re Looking At
This overlay plots confirmed Buy/Sell signals , momentum-based “watch” zones , adaptive candle coloring , SuperTrend bias detection , dual Bollinger Bands , and a moving average ribbon .
It’s not “minimalist” —it’s comprehensive .
📍 Configuring the Tool: Follow the Breadcrumbs
Every setting includes a tooltip — read them . They're not filler. They explain exactly how each feature functions so you can dial this thing in like you're tuning a surveillance rig in a Cold War bunker .
If you skip them, you're walking blind in a minefield .
🕰️ Timeframes: The Signal Sweet Spot
Each asset has a tempo . You need to find the one where signals align with clarity —not chaos .
Start with 4H or 1H —work up or down from there.
Too many fakeouts? → Higher timeframe
Too slow? → Drop to 15m or 5m —but expect more noise and adjust settings accordingly.
The signals scale with time, but you must find the rhythm that best fits your asset—and your trading lifestyle .
♻️ RSI Cycle = Signal Sensitivity
This is the heart of the system . It controls how reactive the RSI engine is.
Adjust based on noise level and how often you can actually monitor your charts.
Short cycle (14–24): More signals, more speed, more noise
Longer cycle (36–64): Smoother entries, better for swing traders
Tip: If your signals feel too jittery, increase the cycle. If they lag too much, reduce it.
📉 SuperTrend: Your Trend Bias Compass
This isn’t your average SuperTrend. It adapts with RSI overlay logic and detects market “silence” via EMA compression— turning white right before the chaos . That said, you still control its aggression.
ATR Length = how many bars to average
ATR Factor = how tight or loose it hugs price
Lower = more sensitive (more trades, more noise)
Higher = confirmation only (fewer, but stronger signals)
Tweak until it feels like a sniper rifle.
No, you won’t get it perfect on the first try.
Yes, it’s worth it.
🛠️ Modular Signals: Why Things Fire (or Don’t)
Buy/Sell entries require conditions to align. The logic is modular, and that’s on purpose.
RSI signals only fire if RSI crosses its smoothed MA outside the dead zone and a “Watch” condition is active.
SuperTrend signals can be enabled to act on crossovers, optionally ignoring the Watch filter .
Watch conditions (colored squares) act as early recon and hint at possible upcoming trades.
Background color changes are “pre-signal warnings” and will repaint . Use them as leading signals, not gospel.
Want more trades? Loosen your filters .
Want sniper entries? Lock them down .
🌈 Candles and MAs: Visual Market Structure
Candles adapt in real-time to MA structure:
Green = bullish (above both fast/slow MAs)
Yellow = indecision (between)
Red = bearish (below both)
Buy/Sell signals override candles with bright orange and fuchsia —because subtlety doesn’t win wars .
You can also enable up to 8 customizable moving averages —great for confluence , trend confirmation , or just looking like a wizard .
🧠 Pro Usage Tips (TL;DR for Smart People):
Use tooltips in the settings menu —every toggle and slider is explained
Test timeframes until signal frequency and reliability match your goals
Adjust RSI cycle to reduce noise or speed up signals based on how frequently you trade
Tweak SuperTrend factor and ATR to fit volatility on your asset
Start with visual confirmation :
• Are watch signals lining up with trend zones?
• Are backgrounds firing before price moves?
• Are candle colors agreeing with signal direction?
📣 Alerts & Integration
Alerts are available for:
Buy/Sell entries (confirmed or advanced background)
Watch signals
Full band agreement (both Bollinger bands bullish or bearish)
Use these with webhook systems , bots , or your own trade journals .
Created by Sherlock Macgyver
Because sometimes the best trade…
is knowing exactly when not to take one.

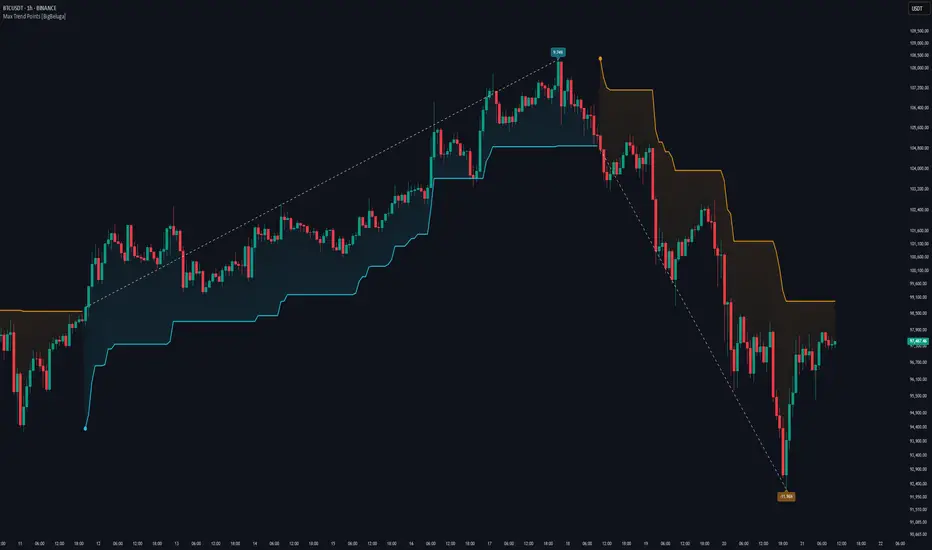
Max Trend Points [BigBeluga]🔵 OVERVIEW
A clean and powerful tool for identifying major trend shifts and quantifying the strength of each move using dynamically calculated price extremes.
This indicator helps traders visualize the most significant trend changes by plotting trend direction lines and dynamically tracking the highest or lowest point within each trend leg. It’s ideal for identifying key price impulses and measuring their magnitude in real time.
🔵 CONCEPTS
Uses an adaptive trend-following logic based on volatility envelopes created from HMA of the price range (high - low).
Identifies trend direction and flips when price breaks above or below these dynamic envelopes.
Tracks swing highs and lows within the current trend leg to highlight trend extremes.
Calculates and displays the percentage gain or drop from trend start to trend peak/valley.
🔵 FEATURES
Trend Shift Detection:
Plots a colored trend line (uptrend or downtrend) that updates based on price action volatility.
Impulse Mapping:
Draws a dashed line between the point of trend change (close) and the current trend leg's extreme (highest high or lowest low).
Percentage Labeling:
Displays a floating label showing the exact percent change from the trend start to the current extreme.
Real-Time Adjustments:
As the trend progresses, the extreme point and the percent label update automatically to reflect new highs/lows.
🔵 HOW TO USE
Look for the trend color shift and circular marker to identify a new potential trend direction.
Use the dashed lines and percent label to evaluate the strength and potential maturity of each move.
Combine this tool with support/resistance levels or other indicators to identify confluence zones.
Adjust the "Factor" input to make the trend detection more or less sensitive depending on your timeframe.
🔵 CONCLUSION
Max Trend Points is an efficient visual indicator for understanding the structure and magnitude of trending moves. It provides essential feedback on how far a trend has traveled, where momentum may be peaking, and when a shift may be underway—all with real-time adaptability and clean presentation.
Market Structure Confluence [AlgoAlpha]OVERVIEW
This script is called "Market Structure Confluence" and it combines classic market structure analysis with a dynamic volatility-based band system to detect shifts in trend and momentum more reliably. It tracks key swing points (higher highs, higher lows, lower highs, lower lows) to define the trend, then overlays a basis and ATR-smoothed volatility bands to catch rejection signals and highlight potential inflection points in the market.
CONCEPTS
Market structure is the foundation of price action trading, focusing on the relationship between successive highs and lows to understand trend conditions. Break of Structure (BOS) and Change of Character (CHoCH) events are important because they signal when a market might be shifting direction. This script enhances traditional structure by integrating volatility bands, which act like dynamic support/resistance zones based on ATR, allowing it to capture momentum surges and rejections beyond just structural shifts.
FEATURES
Swing Detection: It detects and labels Higher Highs (HH), Higher Lows (HL), Lower Highs (LH), and Lower Lows (LL) based on user-defined time horizons, helping traders quickly spot the trend direction.
BOS and CHoCH Lines: When a previous swing point is broken, the script automatically plots a Break of Structure (BOS) line. If the break represents a major trend reversal (a CHoCH), it is marked differently to separate simple breakouts from real trend changes.
Rejection Signals: Special arrows plot when price pierces a band and then pulls back, suggesting a potential trap move or rejection signal in the direction of the new structure.
Alerts: Built-in alerts for structure breaks, CHoCHs, swing points, rejections at bands, and trend flips make it easy to automate setups without manually watching the chart.
USAGE
Set your preferred swing detection size depending on your timeframe and trading style — smaller numbers for intraday, larger numbers for swing trading. Choose whether you want BOS/CHoCH confirmed by candle closes or by wick breaks. Use the volatility band settings to fine-tune how tightly or loosely the bands hug the price, adjusting sensitivity based on market conditions. When a BOS or CHoCH occurs, or when a rejection happens at the bands, the script will highlight it clearly and optionally trigger alerts. Watch for combinations where both structure breaks and volatility band rejections happen together — those are high-quality trade signals. This setup works best when used with basic trend filtering and higher timeframe confirmation.

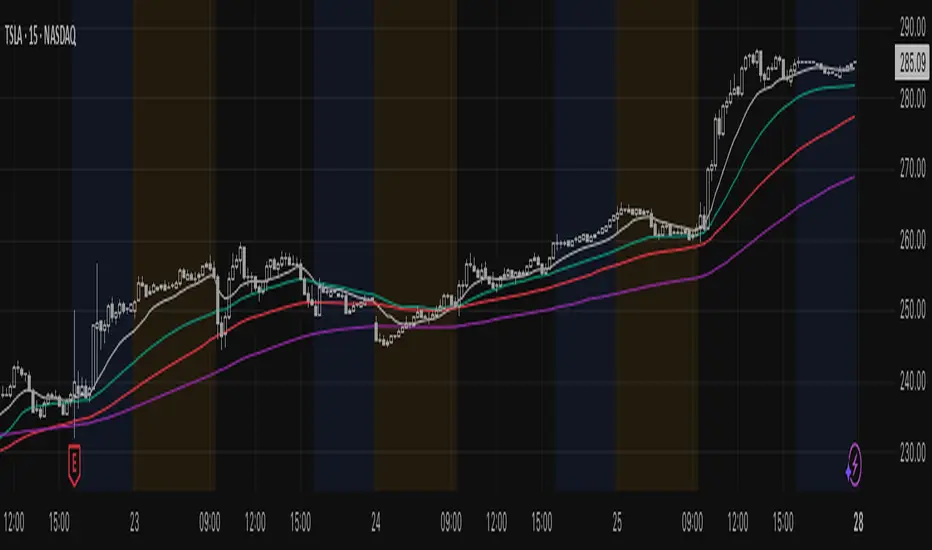
Institutional Composite Moving Average (ICMA) [Volume Vigilante]Institutional Composite Moving Average (ICMA)
The Next Evolution of Moving Averages — Built for Real Traders.
ICMA blends the strength of four powerful averages (SMA, EMA, WMA, HMA) into a single ultra-responsive, ultra-smooth signal.
It reacts faster than traditional MAs while filtering out noise, giving you clean trend direction with minimal lag.
🔹 Key Features:
• Faster reaction than SMA, EMA, or WMA individually
• Smoother and more stable than raw HMA
• Naturally adapts across trend, momentum, and consolidation conditions
• Zero gimmicks. Zero repainting. Full institutional quality.
🔹 Designed For:
• Scalping
• Swing trading
• Signal engines
• Algorithmic systems
📎 How to Use:
• Overlay it on any chart
• Fine-tune the length per timeframe
• Combine with your entries/exits for maximum edge
Created by Volume Vigilante 🧬 — Delivering Real-World Trading Tools.
Aurora Flow Oscillator [QuantAlgo]The Aurora Flow Oscillator is an advanced momentum-based technical indicator designed to identify market direction, momentum shifts, and potential reversal zones using adaptive filtering techniques. It visualizes price momentum through a dynamic oscillator that quantifies trend strength and direction, helping traders and investors recognize momentum shifts and trading opportunities across various timeframes and asset class.
🟢 Technical Foundation
The Aurora Flow Oscillator employs a sophisticated mathematical approach with adaptive momentum filtering to analyze market conditions, including:
Price-Based Momentum Calculation: Calculates logarithmic price changes to measure the rate and magnitude of market movement
Adaptive Momentum Filtering: Applies an advanced filtering algorithm to smooth momentum calculations while preserving important signals
Acceleration Analysis: Incorporates momentum acceleration to identify shifts in market direction before they become obvious
Signal Normalization: Automatically scales the oscillator output to a range between -100 and 100 for consistent interpretation across different market conditions
The indicator processes price data through multiple filtering stages, applying mathematical principles including exponential smoothing with adaptive coefficients. This creates an oscillator that dynamically adjusts to market volatility while maintaining responsiveness to genuine trend changes.
🟢 Key Features & Signals
1. Momentum Flow and Extreme Zone Identification
The oscillator presents market momentum through an intuitive visual display that clearly indicates both direction and strength:
Above Zero: Indicates positive momentum and potential bullish conditions
Below Zero: Indicates negative momentum and potential bearish conditions
Slope Direction: The angle and direction of the oscillator provide immediate insight into momentum strength
Zero Line Crossings: Signal potential trend changes and new directional momentum
The indicator also identifies potential overbought and oversold market conditions through extreme zone markings:
Upper Zone (>50): Indicates strong bullish momentum that may be approaching exhaustion
Lower Zone (<-50): Indicates strong bearish momentum that may be approaching exhaustion
Extreme Boundaries (±95): Mark potentially unsustainable momentum levels where reversals become increasingly likely
These zones are displayed with gradient intensity that increases as the oscillator moves toward extremes, helping traders and investors:
→ Identify potential reversal zones
→ Determine appropriate entry and exit points
→ Gauge overall market sentiment strength
2. Customizable Trading Style Presets
The Aurora Flow Oscillator offers pre-configured settings for different trading approaches:
Default (80,150): Balanced configuration suitable for most trading and investing situations.
Scalping (5,80): Highly responsive settings for ultra-short-term trades. Generates frequent signals and catches quick price movements. Best for 1-15min charts when making many trades per day.
Day Trading (8,120): Optimized for intraday movements with faster response than default settings while maintaining reasonable signal quality. Ideal for 5-60min or 4h-12h timeframes.
Swing Trading (10,200): Designed for multi-day positions with stronger noise filtering. Focuses on capturing larger price swings while avoiding minor fluctuations. Works best on 1-4h and daily charts.
Position Trading (14,250): For longer-term position traders/investors seeking significant market trends. Reduces false signals by heavily filtering market noise. Ideal for daily or even weekly charts.
Trend Following (16,300): Maximum smoothing that prioritizes established directional movements over short-term fluctuations. Best used on daily and weekly charts, but can also be used for lower timeframe trading.
Countertrend (7,100): Tuned to detect potential reversals and exhaustion points in trends. More sensitive to momentum shifts than other presets. Effective on 15min-4h charts, as well as daily and weekly charts.
Each preset automatically adjusts internal parameters for optimal performance in the selected trading context, providing flexibility across different market approaches without requiring complex manual configuration.
🟢 Practical Usage Tips
1/ Trend Analysis and Interpretation
→ Direction Assessment: Evaluate the oscillator's position relative to zero to determine underlying momentum bias
→ Momentum Strength: Measure the oscillator's distance from zero within the -100 to +100 range to quantify momentum magnitude
→ Trend Consistency: Monitor the oscillator's path for sustained directional movement without frequent zero-line crossings
→ Reversal Detection: Watch for oscillator divergence from price and deceleration of movement when approaching extreme zones
2/ Signal Generation Strategies
Depending on your trading approach, multiple signal strategies can be employed:
Trend Following Signals:
Enter long positions when the oscillator crosses above zero
Enter short positions when the oscillator crosses below zero
Add to positions on pullbacks while maintaining the overall trend direction
Countertrend Signals:
Look for potential reversals when the oscillator reaches extreme zones (±95)
Enter contrary positions when momentum shows signs of exhaustion
Use oscillator divergence with price as additional confirmation
Momentum Shift Signals:
Enter positions when oscillator changes direction after establishing a trend
Exit positions when oscillator direction reverses against your position
Scale position size based on oscillator strength percentage
3/ Timeframe Optimization
The indicator can be effectively applied across different timeframes with these considerations:
Lower Timeframes (1-15min):
Use Scalping or Day Trading presets
Focus on quick momentum shifts and zero-line crossings
Be cautious of noise in extreme market conditions
Medium Timeframes (30min-4h):
Use Default or Swing Trading presets
Look for established trends and potential reversal zones
Combine with support/resistance analysis for entry/exit precision
Higher Timeframes (Daily+):
Use Position Trading or Trend Following presets
Focus on major trend identification and long-term positioning
Use extreme zones for position management rather than immediate reversals
🟢 Pro Tips
Price Momentum Period:
→ Lower values (5-7) increase sensitivity to minor price fluctuations but capture more market noise
→ Higher values (10-16) emphasize sustained momentum shifts at the cost of delayed response
→ Adjust based on your timeframe (lower for shorter timeframes, higher for longer timeframes)
Oscillator Filter Period:
→ Lower values (80-120) produce more frequent directional changes and earlier response to momentum shifts
→ Higher values (200-300) filter out shorter-term fluctuations to highlight dominant market cycles
→ Match to your typical holding period (shorter holding time = lower filter values)
Multi-Timeframe Analysis:
→ Compare oscillator readings across different timeframes for confluence
→ Look for alignment between higher and lower timeframe signals
→ Use higher timeframe for trend direction, lower for earlier entries
Volatility-Adaptive Trading:
→ Use oscillator strength to adjust position sizing (stronger = larger)
→ Consider reducing exposure when oscillator reaches extreme zones
→ Implement tighter stops during periods of oscillator acceleration
Combination Strategies:
→ Pair with volume indicators for confirmation of momentum shifts
→ Use with support/resistance levels for strategic entry and exit points
→ Combine with volatility indicators for comprehensive market context
