Falcon 1Introducing the MyFXSchool Falcon 1Leading Indicator™, a next-generation market prediction tool designed exclusively for traders who want accuracy, clarity, and early trend identification. Built using advanced price-action logic, institutional order-flow concepts, and dynamic volatility algorithms, this indicator gives you a true leading advantage—not just lagging signals.
Volatilité

Falcon 2Introducing the MyFXSchool Falcon 2 Leading Indicator™, a next-generation market prediction tool designed exclusively for traders who want accuracy, clarity, and early trend identification. Built using advanced price-action logic, institutional order-flow concepts, and dynamic volatility algorithms, this indicator gives you a true leading advantage—not just lagging signals.

ATR Volatility FilterA Basic Volatility Filter
3 Modes
1- Absolute ATR filter
2- Filter Based on ATR threshold relative percentage of the price
3- ATR Threshold relative to its moving average

@tom_w777 Turtles Systems with 2N marks//// @tom_w777
//// 2 systems from the Turtles trading system, including S1 and S2 2N marks for the drawbacks to enter an existing trend
//// data to program it taken from the book : "the complete turtle trader" from Michael W. COVEL
/////////

SMA MAD Trend [Alpha Extract]A sophisticated trend identification system that combines Simple Moving Average with Mean Absolute Deviation methodology to create adaptive Super Trend-style bands with advanced strength filtering and gradient visualization. Utilizing ADX-based trend strength validation and slope analysis for signal quality enhancement, this indicator delivers institutional-grade trend detection with dynamic ATR-based ribbon visualization and comprehensive strength measurement. The system's dual-filter architecture eliminates false signals during weak or choppy market conditions while maintaining sensitivity to genuine trend establishment and reversal events.
🔶 Advanced SMA-MAD Band Construction
Implements innovative Mean Absolute Deviation calculation around Simple Moving Average baseline to create volatility-adaptive bands with ratcheting logic for trend persistence. The system calculates MAD by measuring absolute price deviations from the mean, then applies configurable multipliers to generate upper and lower bands that adjust to changing market conditions while preventing premature band violations.
// Core SMA-MAD Framework
SMA_Value = ta.sma(close, SMA_Length)
Mean = ta.sma(close, MAD_Length)
Abs_Deviation = abs(close - Mean)
MAD_Value = ta.sma(Abs_Deviation, MAD_Length)
// Adaptive Bands
Upper_Band = SMA_Value + MAD_Factor * MAD_Value
Lower_Band = SMA_Value - MAD_Factor * MAD_Value
🔶 Intelligent Dual-Filter System
Features comprehensive trend validation using ADX strength measurement and slope analysis to eliminate low-conviction signals during ranging or consolidating markets. The system calculates normalized slope strength using ATR scaling and combines with ADX threshold analysis, generating filtered trend states that distinguish genuine trends from temporary price fluctuations.
🔶 Dynamic Trend Strength Engine
Implements sophisticated strength calculation combining slope intensity and ADX readings to produce normalized 0-100% strength scores with gradient colour intensity modulation. The system normalizes slope by minimum threshold and ADX by configurable level, multiplying factors to create composite strength measurement that drives visual feedback intensity across all indicator elements.
🔶 Super Trend-Style Direction Logic
Utilizes classic Super Trend methodology adapted for SMA-MAD bands, where trend direction flips occur on opposite band violations with persistent state maintenance. The system tracks previous band levels with ratcheting behaviour that adjusts bands only when price movement or new calculations warrant changes, preventing oscillation during normal volatility.
🔶 ATR-Based Ribbon Visualization
Provides dynamic ribbon overlay using ATR-scaled width around the trend line with opacity modulation based on trend strength for intuitive conviction assessment. The system creates upper and lower ribbon bounds at configurable ATR multiples, filling the channel with gradient-adjusted transparency that increases during strong trends and fades during weak conditions.
🔶 Multi-Dimensional Visual Architecture
Provides complete chart integration through trend line overlay, ATR ribbon fills, candle colouring, background glow, and transition signal labels with configurable visibility toggles. The system enables traders to customize display density from minimal (trend line only) to comprehensive (all visual elements) while maintaining consistent colour scheme and strength-based intensity across components.
🔶 Slope Strength Validation
Calculates ATR-normalized slope over configurable lookback periods to measure trend line momentum and filter sideways price action. The system compares absolute slope against minimum threshold requirements, preventing trend signals when price movement relative to the trend line lacks sufficient directional conviction regardless of band position.
🔶 Signal Generation Framework
Generates trend change signals when filtered direction state transitions from bearish to bullish or vice versa, with label placement and alert integration. The system implements state persistence that maintains previous trend until both ADX and slope filters confirm directional change, reducing whipsaw signals while capturing genuine reversals with minimal lag.
🔶 Performance Optimization Framework
Utilizes efficient calculation methods with optimized variable management and configurable parameters for balance between responsiveness and stability. The system includes intelligent state tracking with NA handling for initial bars and smooth gradient calculations that maintain performance across extended historical periods and real-time updates.
This indicator delivers sophisticated trend identification through Mean Absolute Deviation methodology combined with dual-strength filtering for superior signal quality. Unlike traditional Super Trend indicators that rely solely on ATR bands, the SMA-MAD approach uses statistical deviation measurement while incorporating ADX strength and slope validation to eliminate false signals during choppy conditions. The system's gradient-based visual feedback, ATR ribbon visualization, comprehensive dashboard, and multi-dimensional filtering make it essential for traders seeking reliable trend-following approaches with clear conviction measurement across cryptocurrency, forex, and equity markets. The combination of adaptive bands, strength-based transparency, and intelligent filtering creates an institutional-grade trend system suitable for systematic trading strategies.

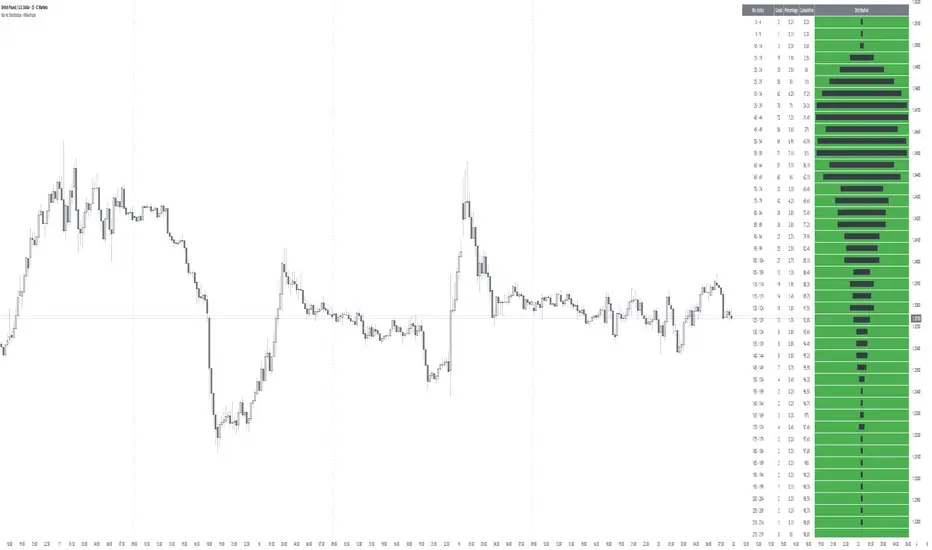
Bar HL Distribution - XWiseTradeBar HL Distribution - XWiseTrade
Analyze the distribution of High-Low ranges over the last N bars.
This indicator groups candle ranges (in ticks) into bins and displays:
• Count per bin
• Percentage and cumulative %
• Visual histogram bars
Perfect for understanding typical volatility, setting realistic targets/stops, and spotting unusual bar sizes.
Features:
• Adjustable lookback and bin size
• Clean table with truncation warning
• Lightweight and always up-to-date
More premium indicators and strategies coming soon at:
xwisetrade.com
Be Wise. Trade X.
VuManChu Strategy [ADX + Vol + Risk] - Good for BTC- The strategy uses the VuManChu WaveTrend oscillator
- Before entering any trade, the ADX filter must show a reading above 25. For more reliable momentum moves
- Three-Layer Exit System:
Fixed Stop Loss (3%): Hard stop placed 3% below entry for longs (above for shorts) to limit maximum loss per trade. This accommodates typical BTC 5-minute volatility without premature stopouts.
Take Profit Target (9%): Fixed profit target at 9% providing a 1:3 risk-reward ratio. This means you only need a 40-50% win rate to be profitable overall.
Conditional Trailing Stop: The most sophisticated protection - a trailing stop that only activates after the trade reaches 4.5% profit (halfway to target). Once activated, it trails price by 2%, locking in gains while still allowing the trade to reach the full 9% target.

Frequency AnalyzerFREQUENCY ANALYZER
This indicator is called Frequency Analyzer to analyze the movement of volatility explosion, to detect exploding candles, before they explode. The indicator only describes large volatility would happen in the future, but we don't know, it's volatility as a buy or sell transaction. Of course this has an impact on whether the candle after that occurs a rally or a drop.
That this is useful for detecting exploding candles before exploding, to detect super bullish before bullish, or detect super bearish before bearish. If the candle is in the support position and there is the Spike Bar on Frequency Analyzer, that high probability the exploding volatility becomes a rally. Conversely, if the candle position is in the resistance and there is the Spike Bar on Frequency Analyzer, that high probability the exploding volatility becomes a drop. So this is an indicator to detect exploding candles before they explode, the candles become super rally or super drop.

XAUUSD M15 momentum realDetects when xausd enters a healthy directional phase during the NY session, and only flags entries with real momentum and controlled volatility.

Offset Bollinger Bandsbollinger band offset by 10 period. Appied on daily time frame for entry and exit

ATR + Moving AverageThis indicator shows a manually calculated Average True Range (ATR) along with a moving average of the ATR.
The ATR measures current candle volatility.
The ATR Moving Average shows the average candle size over the selected period.
Both can use different smoothing types (RMA, SMA, EMA, WMA) for flexibility.
It’s useful for seeing when price is stretched, volatility is expanding or contracting, and for higher-timeframe mean-reversion analysis.

BBMA by RWBTradeLabBBMA by RWBTradeLab
A clean, non-repainting BBMA indicator built for traders who combine Bollinger Bands with Linear Weighted Moving Averages and EMA to track volatility expansion, price extremes, and confirmed breakout behavior using closed candles only.
What this indicator does
This script combines Bollinger Bands (20, 2) with Linear Weighted Moving Averages (LWMA) and a 50 EMA to help traders identify high-probability price extension zones and confirmed BBMA break conditions—without repainting.
All calculations and alerts are based strictly on closed candles (no running-bar signals).
Core components
Bollinger Bands
*Period: 20
*Deviations: 2
*Apply to: Close
*Visual shift supported (default 0)
*Clean white band structure for clarity
Linear Weighted Moving Averages (LWMA)
*LW MA 5 Low
*LW MA 10 Low
*LW MA 5 High
*LW MA 10 High
These weighted averages react faster to recent price action and help define dynamic BBMA zones.
Exponential Moving Average
*EMA 50
*Apply to: Close
*Method: Exponential
Used as a higher-timeframe trend and structure reference.
BBMA alert logic (closed candle only)
Lower BBMA Break
Triggered when:
*LW MA 5 Low crosses below the Lower Bollinger Band
*The candle closes below the Lower Bollinger Band
*LW MA 5 Low remains below the Lower Bollinger Band after close
Upper BBMA Break
Triggered when:
*LW MA 5 High crosses above the Upper Bollinger Band
*The candle closes above the Upper Bollinger Band
*LW MA 5 High remains above the Upper Bollinger Band after close
⚠️ No alerts are generated on running candles—only on confirmed bar close.
Visuals on chart
*Bollinger Bands plotted in clean white
*LW MAs color-coded for easy distinction
*EMA 50 plotted in green
*Optional show/hide toggles for BB, LW MAs, and EMA
Alerts
Built-in alerts trigger only on candle close:
*BBMA Lower Break (confirmed)
*BBMA Upper Break (confirmed)
Designed for reliable discretionary trading and automation without repainting issues.
Key settings
*BB Period & Deviations
*LW MA periods (5 & 10, High / Low)
*EMA period
*Visual shift for Bollinger Bands
*Individual visibility toggles
Non-repainting confirmation
All calculations, plots, and alerts are based on confirmed candles only.
No running-bar logic → no repainting.
Disclaimer
This indicator is a technical analysis tool, not financial advice.
Trading involves risk—always use proper risk management and confirm signals with your own analysis.
Creator: RWBTradeLab
If you find this indicator useful, please leave a like ⭐ and share your feedback.

Kijun Sen Standard Deviation | QuantLapse SystemsOverview
The Kijun Sen Standard Deviation indicator by QuantLapse Systems is a volatility-aware trend-following framework that combines the structural equilibrium of the Kijun Sen (基準線) with statistically adaptive standard deviation bands.
By anchoring trend detection to market structure and confirming direction through volatility expansion, the indicator delivers a cleaner, more reliable regime classification across varying market conditions.
Rather than reacting to short-term noise, the system focuses on identifying statistically justified trend phases , making it well-suited for disciplined, rule-based trading.
Technical Composition, Calculation, Key Components & Features
📌 Kijun Sen (基準線) – Structural Trend Baseline
Calculated as the midpoint between the highest high and lowest low over a user-defined period.
Represents market equilibrium and structural balance rather than short-term momentum.
Naturally adapts to expanding and contracting price ranges.
Provides a stable baseline for regime detection and volatility validation.
Acts as the anchor for deviation bands and persistent trend-state logic.
Unlike fast or reactive moving averages, the Kijun Sen emphasizes price structure and equilibrium , making it especially effective for higher-quality trend confirmation.
📌 Volatility Adjustment – Standard Deviation Bands
Standard deviation is calculated over a configurable lookback to measure current price dispersion.
Upper and lower envelopes are formed by applying a deviation multiplier to the Kijun Sen.
Band width expands during volatility surges and contracts during consolidation.
Creates proportional, volatility-aware thresholds instead of static offsets.
Visually represents market energy through expanding and compressing channels.
These adaptive bands ensure that trend signals only occur when volatility supports directional movement.
📌 Trend Signal & Regime Calculation
Bullish Trend is confirmed when price closes above the upper deviation band.
Bearish Trend is confirmed when price closes below the lower deviation band.
Once established, the trend state persists until an opposing volatility break occurs.
This persistence reduces whipsaws and improves regime stability.
Trend state is reinforced with color-coded lines, envelopes, and background shading.
This volatility-confirmed persistence model is visible in the chart, where trends remain intact through minor pullbacks and only flip on decisive expansion.
How It Works in Trading
✅ Volatility-Confirmed Trend Detection – Requires expansion beyond deviation bands.
✅ Noise Suppression – Filters low-energy price movement within volatility envelopes.
✅ Regime Persistence – Maintains trend state until statistical invalidation.
✅ Immediate Visual Context – Direction, strength, and transitions are clear at a glance.
Visual Representation
Trend signals are displayed directly on price using both line and background context:
🟢 Green / Teal Kijun & Envelope → Confirmed bullish regime.
🔴 Red / Pink Kijun & Envelope → Confirmed bearish regime.
Semi-transparent band fill visualizes volatility expansion and compression.
Buy and Sell labels appear only on confirmed regime transitions.
The lower panel includes:
Strategy equity curve based on trend exposure.
Buy & Hold equity for performance comparison.
Background regime shading synchronized with trend state.
Features and User Inputs
The Kijun Sen Standard Deviation framework offers a focused yet powerful set of configurable inputs:
Kijun Sen Length – Controls structural trend sensitivity.
Standard Deviation Controls – Adjust lookback length and multiplier for regime strictness.
Backtesting & Date Filters – Define evaluation periods and starting conditions.
Display Options – Toggle labels, equity curves, and background shading.
Color Customization – Fully configurable buy/sell colors for trends and equity curves.
These controls allow users to balance responsiveness, stability, and clarity without overfitting.
Practical Applications
The Kijun Sen Standard Deviation indicator is designed for traders who prioritize structure, volatility confirmation, and regime awareness.
Primary Trend Filtering – Identify and stay aligned with dominant market direction.
Volatility-Aware Trend Following – Participate only when price expansion confirms intent.
Risk-Managed Exposure – Avoid chop during compression and transitional phases.
Systematic Strategy Development – Use as a regime engine or higher-timeframe filter.
Performance Evaluation – Compare trend-following equity against buy-and-hold benchmarks.
This framework bridges classical Ichimoku structure with modern statistical validation.
Conclusion
The Kijun Sen Standard Deviation indicator by QuantLapse Systems represents a refined evolution of Ichimoku-based trend analysis.
By integrating the structural equilibrium of the Kijun Sen with adaptive standard deviation confirmation, the system delivers clearer regime classification, reduced noise, and more reliable trend participation.
Rather than attempting to predict price, it focuses on confirming when trends are statistically justified .
Who should use Kijun Sen Standard Deviation:
📊 Trend-Following Traders – Stay aligned with dominant market structure.
⚡ Momentum & Swing Traders – Enter only on volatility-backed expansions.
🤖 Systematic & Algorithmic Traders – Ideal as a regime filter or trend-state engine.
Past performance is not indicative of future results.
Disclaimer: All trading involves risk, and no indicator can guarantee profitability.
Strategic Advice: Always backtest thoroughly, optimize parameters responsibly, and align settings with your timeframe, asset class, and risk tolerance before live deployment.

London BoxThis indicator specifically optimized for intraday trading strategies.
HOW IT WORKS
Volume and Volatility Analysis:
The opening hours of the London session represent periods when trading volume and volatility typically peak. The indicator is designed to visualize this specific window to highlight the initial market direction and range.
Daily Redraw and Custom Timing:
The boxes are redrawn daily at a user-defined time between 18:00 and 23:30 (UTC+3). This allows traders to refresh their intraday zones consistently according to their preferred daily routine or market close bias.
Timeframe Filtering:
The script is designed to operate on specific timeframes.
Visual Customization:
The box color, background transparency, and the width can be fully adjusted in the settings
KEY FEATURES
Automatic Daily Updates:
Automatically calculates and draws the London session range every single day.
Adjustable Redraw Time:
It offers the flexibility to choose when the box appears on the chart.

Trend Consensus Engine [TCE]The Trend Consensus Engine (TCE) is a comprehensive market analysis system designed to filter out noise and provide a quantifiable "Trend Score" (0-100). Instead of relying on a single indicator, this script aggregates data from multiple market factors—volatility, momentum, and trend structure—to generate high-probability entry signals based on a consensus logic.
This tool is particularly optimized for Crypto (with specific time-gated logic) and BIST (Borsa Istanbul) markets, allowing traders to see the overall health of the trend at a glance via a dashboard.
How It Works
The engine calculates a composite "Total Score" (0-100) derived from four weighted components:
Trend Structure (AlphaTrend & Guppy):
Analyzes the slope and position relative to the AlphaTrend (Credit to @KivancOzbilgic) and Guppy Multiple Moving Averages (GMMA).
Positive slopes and price action above key levels add points to the score.
Volatility & Momentum (Squeeze & ADX):
Incorporates the Squeeze Momentum logic (Credit to @LazyBear) to detect explosive moves.
ADX Filter: Filters out chopping/ranging markets. If the ADX is too low, the score is penalized or the signal is blocked.
Dynamic Resistance (MA Channels):
Uses a combination of Donchian Mid-Lines and SMAs to determine if the price is in a "safe zone" or hitting resistance.
Price Action Filters (Pinbar Veto):
Automatically detects bearish "Shooting Star" or weak candles at highs. If a bearish pinbar is detected, the entry signal is vetoed regardless of the trend score.
Features & Settings
Smart Scoring Dashboard: Displays the realtime Score, Instant Decision, and confirmed Close Decision on the chart.
Market Profiles:
Crypto Mode: Includes a "Time Gate" feature (07:00 UTC+3 check) to prevent fakeouts during low-liquidity hours.
BIST Mode: Optimized parameters for the Turkish stock market logic (14:00 session checks).
Score Threshold: Users can adjust the minimum score required (Default: 70) to trigger a "BUY" signal.
Visual Guidance: The background of the dashboard changes color (Green/Red/Yellow) based on the consensus.
How to Use
Check the Dashboard: Look at the "SONUÇ" (Result) row.
GİRİŞ ✅ (ENTRY): The Score is above 70, Momentum is positive, and no Bearish Pinbars are present.
BEKLE ⏳ (WAIT): The trend is weak, or a filter (like ADX or Squeeze) is blocking the trade.
Confirm with Price Action: Use the AlphaTrend lines (Blue/Red) as dynamic support/stop-loss levels.
Credits:
AlphaTrend by KivancOzbilgic
Squeeze Momentum Indicator by LazyBear
VuManChu Cipher concepts for inspiration.
Custom Logic: Scoring algorithm and Time-Gating mechanisms are original custom developments.
Disclaimer: This tool is for educational purposes only and does not constitute financial advice.

ORB Fusion Adaptive🎯 ORB Fusion Adaptive Strategy
Professional Opening Range Breakout Trading System
═══════════════════════════════════════════════════════════════════════════════
The first fully-automated, multi-instrument ORB strategy on TradingView.
💡 WHAT IT DOES:
Automatically trades Opening Range breakouts and failed breakout reversals with intelligent position sizing, professional risk management, and complete trade lifecycle tracking. Built for serious backtesting and live trading.
⚡ KEY FEATURES:
✓ Automated Entry & Exit (breakouts + reversals)
✓ Adaptive Position Sizing (3 modes: Fixed, Risk-Based, Risk-Based Initial)
✓ Multi-Instrument Support (Futures, Forex, Crypto, Stocks)
✓ Advanced Risk Management (daily limits, drawdown protection)
✓ ML-Powered Breakout Filtering (pContinue/pFail scoring)
✓ Failed Breakout Detection (high-probability reversals)
✓ Native Trailing Stops (Pine Script v5)
✓ Multi-Target Management (T1, T2, T3)
✓ Real-Time Performance Dashboard
✓ Comprehensive Backtesting (5+ years tested)
🎯 STRATEGY LOGIC:
Entry Signals
The strategy enters trades on two high-probability setups:
1. ORB Breakouts
• Detects when price breaks above/below Opening Range
• Confirms with volume (configurable threshold)
• ML filter scores probability of continuation
• Enters within 3 bars of breakout (no late entries)
• Stop placed at ORB midpoint or ATR-based
• Targets at Fibonacci extensions (1.0x, 1.618x, 2.5x ORB range)
2. Failed Breakout Reversals
• Monitors for breakouts that fail and reverse
• Confirms failure after price returns inside ORB
• Automatic reversal entry with tight stops
• Three profit targets (0.5x, 1.0x, 1.5x ORB range)
• Historical 65-75% win rate on reversals
Exit Management
• Stop Loss: Multiple methods (ATR, ORB Mid, ORB Opposite, Hybrid)
• Native Trailing Stop: Activates after configurable R-multiple profit
• Profit Targets: Single target or scaled exits at T1/T2/T3
• Daily Stop: Halts trading after max daily loss
• Drawdown Protection: Circuit breaker at max drawdown threshold
🔧 ADAPTIVE POSITION SIZING:
The strategy's most powerful feature - intelligent position sizing that adapts to your instrument and account:
Mode 1: Fixed
• Simple contract/lot size
• Best for: Testing, stable position sizing
• Use case: "Always trade 2 contracts"
Mode 2: Risk-Based (Current Equity)
• Size = (Current Equity × Risk%) / (Stop Distance × Point Value)
• Compounds with wins, reduces with losses
• Best for: Aggressive compounding
• Use case: Maximize geometric growth
Mode 3: Risk-Based (Initial Capital)
• Size = (Initial Capital × Risk%) / (Stop Distance × Point Value)
• No compounding - consistent risk exposure
• Best for: Professional risk management
• Use case: Live trading with stable risk
Multi-Instrument Intelligence
Auto-detects and calculates correctly for:
• Futures: Uses contract point value (ES $50/pt, NQ $20/pt, MES $5/pt, MNQ $2/pt)
• Forex: Uses pip value per lot (Standard/Mini/Micro/Nano)
• Crypto: Uses contract multiplier (1.0 BTC, 0.001 BTC, etc)
• Stocks: Uses $1 per share
Manual override available if auto-detect fails.
📊 RISK MANAGEMENT:
Multi-Layer Protection
• Per-Trade Risk: 0.5-2% of capital (configurable)
• Daily Risk Limit: Max 4% loss per day (halts trading)
• Max Drawdown Pause: Circuit breaker at 12% drawdown
• Position Size Limits: Min/max contracts enforced
• Max Stop Distance: ATR-based hard limit (prevents catastrophic losses)
Trailing Stop System
• Uses Pine Script's native trail_price and trail_offset
• Activates after configurable R-multiple profit (default 0.5R)
• Trail distance: ATR-based (tight 0.5 ATR to loose 2.0 ATR)
• Works reliably in backtesting AND live trading
• No manual stop management needed
🌍 GLOBAL MARKET SUPPORT:
Configurable Sessions
Unlike basic ORB indicators, this strategy works globally:
• US Equities: 9:30 AM ET default
• Forex London: Custom session 08:00-08:30 GMT
• Forex NY: Custom session 13:30-14:00 GMT
• Asian Markets: Custom session with Tokyo timezone
• Crypto: 24/7 support with custom ORB windows
Timezone support includes:
America/New_York, Europe/London, Asia/Tokyo, Asia/Hong_Kong, UTC, and more.
Session ORBs
• Asian Session ORB (Tokyo open)
• London Session ORB (Forex primary)
• NY Session ORB (US market hours)
Critical for Forex traders working multiple sessions.
📈 BACKTESTING CAPABILITIES:
Realistic Simulation
• Commission: Configurable (default $1 per order)
• Slippage: 2 ticks default (adjustable)
• Volume Confirmation: Prevents unrealistic fills
• RTH Filtering: Optional Regular Trading Hours only
• Bar Magnifier: Improved intrabar execution
Performance Metrics Dashboard
Real-time statistics displayed:
• Total Trades & Win Rate
• Net P&L & Profit Factor
• Current Drawdown
• Daily P&L tracking
• Position details (if in trade)
• Position sizing mode & current size
Historical Testing
• Supports 5000+ bars of history
• Test across multiple market conditions
• Bull markets, bear markets, range-bound periods
• Optimize by day type (trend vs rotation)
🎛️ CUSTOMIZATION OPTIONS:
ORB Settings
• Timeframe: 5, 15, 30, or 60 minutes
• Confirmation: Close, Wick, or Body
• Volume: On/off with multiplier threshold
• LTF Precision: Sub-minute high/low detection
• RTH Filter: Regular Trading Hours only option
Breakout Detection
• ML Filtering: Enable/disable with thresholds
• Failed Breakout: Sensitivity (2-10 bars)
• Failure Buffer: ATR-based confirmation
• Entry Window: Bars after signal (prevents late entries)
Stop Methods
• ATR: Tight dynamic stops (recommended)
• ORB Mid: Structural stop at midpoint
• ORB Opposite: Wide stop at opposite boundary
• Hybrid: Best of ATR and structural
Target Methods
• Single: One target, full exit
• Scaled: Partial exits at T1/T2/T3 (recommended)
• Trail Only: No fixed targets, trail to exit
🔬 OPTIMIZATION GUIDE:
For Futures (ES, NQ, MNQ, MES)
• ORB: 30 min
• Confirmation: Close
• Volume: ON (1.5x)
• Stop Method: ATR (1.0x multiplier)
• Position Mode: Risk-Based (Initial)
• Risk Per Trade: 1.5%
• Failed Breakouts: ENABLE
For Forex Majors
• ORB: 60 min (or 15 min at London open)
• Confirmation: Close
• Volume: OFF (tick volume unreliable)
• Stop Method: ATR (1.5x multiplier)
• Position Mode: Risk-Based (Initial)
• Risk Per Trade: 1.0%
• Custom Session: 0800-0900 GMT
• Timezone: Europe/London
For Crypto (BTC, ETH)
• ORB: 60 min
• Confirmation: Close
• Volume: OFF or ON (1.2x)
• Stop Method: ATR (2.0x wider stops)
• Position Mode: Fixed or Risk-Based
• Risk Per Trade: 2.0% (higher volatility)
• Custom Session: Define your preferred window
For Stocks/ETF
• ORB: 15-30 min
• Confirmation: Body (most conservative)
• Volume: ON (2.0x threshold)
• Stop Method: Hybrid
• Position Mode: Risk-Based (Initial)
• Risk Per Trade: 1.0%
• RTH Only: ENABLED
• Gap Analysis: ENABLED
💎 ADVANCED FEATURES:
Initial Balance Analysis
• First hour range tracking (A + B periods)
• IB extensions at 0.5x, 1.0x, 1.5x, 2.0x
• Day type classification (Trend/Normal/Rotation)
• Adjusts strategy behavior by day type
ORB Extensions
• Fibonacci targets: 1.272x, 1.5x, 1.618x, 2.0x, 2.618x, 3.0x
• Dynamic monitoring for take-profit zones
• Extension tracking in statistics
VWAP Integration
• Institutional benchmark reference
• Standard deviation bands (1σ and 2σ)
• Breakout alignment scoring
• Context for trade quality
Gap Analysis
• Overnight gap detection
• Gap fill target projection
• Gap fill rate statistics
• Direction bias from gap type
Comprehensive Statistics
• Bull/Bear breakout win rates
• Reversal win rate (typically 65-75%)
• Day type distribution
• Extension statistics
• Gap fill rate
• Real-time performance tracking
🎨 VISUAL FEEDBACK:
Enhanced Plots
• ORB levels (High/Low/Mid continuous lines)
• Entry markers (L for long, S for short, 🔥 for reversals)
• Extension levels with labels
• Session ORBs (Asian/London/NY)
• IB levels and extensions
• VWAP with bands
• Failed breakout markers
Color-Coded Momentum Boxes
• Blue: Inside ORB (consolidation)
• Green: Above ORB (bullish momentum)
• Red: Below ORB (bearish momentum)
• Orange: Failed breakout zones
• Variable intensity based on distance
Dynamic Dashboards
• Main Dashboard: ORB status, breakout info, setup details, market context
• Strategy Dashboard: Trades, Win%, P&L, Profit Factor, Daily P&L, Drawdown, Position info
• Narrative Dashboard: Plain-language market interpretation
Three Display Modes
• Simple: Clean chart, essential ORB only
• Standard: ORB + IB + Sessions + VWAP (recommended)
• Advanced: All features + statistics
🔔 ALERT SYSTEM:
Strategy Alerts
• Breakout Entry (with ML probabilities)
• Failed Breakout Entry (with targets)
• Stop Hit (position closed)
• Target Hit (T1, T2, T3 partials)
• Extension Reached (profit zone)
• IB Break (potential trend day)
All alerts include:
• Direction and setup type
• Entry price and position size
• Stop and target levels
• ML scores (if enabled)
• Setup grade (A+ to D)
• Win rate context
⏱️ TIMEFRAMES: 1m-15m optimal (works on all)
💎 INSTRUMENTS: Futures, Forex, Crypto, Stocks, Indices
🎓 SKILL LEVEL: Intermediate to Advanced
📚 WHAT'S INCLUDED:
Comprehensive Documentation
• 200+ lines of detailed tooltips
• Every setting fully explained
• Optimization guides by market
• Position sizing calculator explanations
• Risk management framework
• Best practices and common pitfalls
Ready-to-Use Configurations
• Default settings optimized for ES/NQ
• Recommended settings for each instrument type
• Conservative vs Aggressive profiles
• Scalping vs Swing configurations
Full Transparency
• All calculations shown in dashboard
• Position sizing visible in real-time
• Strategy performance metrics live
• No black boxes or hidden logic
🚨 RISK DISCLAIMERS:
CRITICAL INFORMATION - PLEASE READ:
• This is a trading strategy that executes real trades in backtesting
• Past performance does NOT guarantee future results
• All trading involves substantial risk of loss
• Never risk money you cannot afford to lose
• This is NOT financial advice - for educational purposes only
• Requires understanding of ORB methodology and risk management
• Test thoroughly on paper/demo account before live trading
• Position sizing must be configured correctly for your account
• Stop losses are NOT guaranteed in all market conditions
• Slippage and commissions will affect live results
• Volatile markets may trigger circuit breakers (drawdown pause)
Strategy-Specific Risks:
• Opening range breakouts can fail (hence the reversal system)
• Volume confirmation may limit signals in low-volume instruments
• Custom sessions must match your market's actual hours
• Multi-instrument support requires correct point value configuration
• Trailing stops may exit early in volatile conditions
• Daily limits may prevent recovery trades
• Backtesting results may not match live execution
Position Sizing Warnings:
• Risk-Based modes can size large positions if stops are tight
• Always set max position size limits appropriate for your account
• Verify point values are correct for your instrument
• Test with small size first
• Monitor position size in dashboard before every trade
🎓 WHO THIS IS FOR:
Best Suited For:
• Traders with ORB methodology knowledge
• Those seeking a fully-automated system
• Backtesting enthusiasts
• Multi-instrument traders
• Risk-conscious systematic traders
• Traders who understand position sizing
Not Recommended For:
• Complete beginners to trading
• Those seeking "set and forget" with zero monitoring
• Traders unwilling to backtest first
• Those who don't understand risk management
• Accounts under $5,000 (position sizing too small)
💡 PRO TIPS:
Backtesting Best Practices
• Start with 2+ years of data
• Include both bull and bear markets
• Test on same timeframe you'll trade (5-min for 5-min ORB)
• Account for commissions/slippage realistically
• Verify win rate >45% and profit factor >1.3
Position Sizing
• Use Risk-Based (Initial Capital) for most consistent results
• Start with 1% risk per trade, increase to 1.5-2% if comfortable
• Set max position size to prevent oversizing
• Verify point values are correct before live trading
• Monitor dashboard for actual size before each trade
Risk Management
• NEVER disable daily loss limit
• Keep max drawdown pause at 12% or lower
• Use ATR stop method for best R:R
• Enable trailing stops for trend capturing
• Take partial profits at T1 (at least 30-40%)
Failed Breakout Trading
• These are your highest win-rate setups (65-75%)
• Always enable this feature
• Use tighter stops on reversals than breakouts
• Don't chase if you miss the entry window
• Three targets allow you to scale out profitably
ML Filtering
• Dramatically improves breakout quality
• Reduce signals but increase win rate
• Start with default thresholds (pCont≥0.55, pFail≤0.35)
• Lower signals = higher quality in choppy markets
• Can disable for more signals in strong trends
⚙️ TECHNICAL DETAILS:
Strategy Engine
• Pine Script v5
• Native strategy.entry() and strategy.exit()
• Trailing stops use trail_price/trail_offset (no repainting)
• Proper position sizing with strategy.position_size
• Realistic fills with commission and slippage
• Bar magnifier for improved intrabar execution
Performance
• Optimized for 1-minute to 15-minute charts
• Supports 5000+ bars of history
• Efficient calculations (no arrays in hot loops)
• Max 500 visual objects (boxes/lines/labels)
• No repainting - all signals confirmed on bar close
Position Sizing Engine
• Auto-detects Futures, Forex, Crypto, Stocks
• Uses syminfo.pointvalue when available
• Falls back to manual configuration
• Proper rounding to exchange increments
• Min/max limits enforced
Risk System
• Per-trade risk percentage enforced
• Daily P&L tracking
• Drawdown from peak equity
• Circuit breakers halt trading when limits hit
• Resets daily for fresh start
🔄 VERSION HISTORY:
Current Version: 1.0 (Initial Release)
• Complete ORB breakout + reversal strategy
• Adaptive position sizing (3 modes)
• Multi-instrument support
• Advanced risk management
• Native trailing stops
• ML filtering integration
• Comprehensive backtesting
• Real-time performance dashboard
Planned Updates:
• Additional session templates (Tokyo, Sydney)
• More stop methods
• Enhanced ML model training
• Volatility regime detection
• Trade journal export
═══════════════════════════════════════════════════════════════════════════════
Trade the opening range with institutional precision.
Automated entries. Intelligent sizing. Professional risk management.
Test first. Trade smart. Scale safely.
Taking you to school. — Dskyz, Trade with insight. Trade with anticipation.

Liquidity Void and Repair EngineLiquidity Void & Repair Engine
OVERVIEW
The Liquidity Void & Repair Engine is a high-fidelity institutional order flow tool designed to identify and track "Market Imbalances" or "Fair Value Gaps" (FVG). Unlike standard gap indicators that clutter the chart with every minor price jump, this engine uses Volatility-Adjusted Range Mapping to isolate high-conviction voids where price moved so rapidly that liquidity was left "unfilled."
The standout feature of this tool is its Active Repair Logic. The engine doesn't just draw static boxes; it monitors price action in real-time to determine when an imbalance has been "healed" by subsequent trading volume, providing a dynamic look at where the market has "unfinished business."
TECHNICAL LOGIC & ORIGINALITY
This script is published Open Source to contribute to the Pine Script community’s understanding of dynamic object management and order flow visualization.
ATR-Relative Filtering: To ensure only significant voids are plotted, the script uses a user-defined ATR (Average True Range) multiplier. This filters out market noise and focuses on institutional "impulse" moves.
Dynamic Box Management: Utilizing the Pine Script box array system, the script manages memory efficiently by updating existing objects rather than creating redundant ones.
The "Repair" Algorithm: The script tracks the high and low of every active void. When price action fully traverses the coordinates of a void, the script "seals" the box, visually marking the moment of liquidity equilibrium.
HOW TO USE
1. Identifying the "Magnet" (The Void)
When price moves aggressively, it leaves a "hole" in the auction.
Bullish Voids (Green): These represent areas where price surged so fast that buyers may still have unfilled orders sitting below. These act as Magnets for pullbacks.
Bearish Voids (Red): These represent areas where price plummeted, leaving a vacuum of selling pressure. These act as Magnets for relief rallies.
2. Trading the "Repair" Process
The Engine tracks how the market "repairs" these holes:
Partial Fill: If price enters a box but doesn't cross it, the "Magnet" is still active.
Full Repair: When a box is "sealed" (stops extending right), it indicates the imbalance is gone. If price "Seals" a green box and then bounces, it confirms the zone as Valid Institutional Support.
3. Confluence with the Trend
Continuation: In a strong uptrend, look for price to drop into a Green Bullish Void and find support. This is often the "Golden Entry" for trend followers.
Reversal Confirmation: If price ignores a Red Bearish Void and blasts right through it (sealing it instantly), it signals a massive shift in market regime and extreme bullish conviction.
USER SETTINGS
Lookback Period: How far back the engine searches for un-repaired gaps.
Min Gap Size (ATR %): Increase this to see only the "Major" institutional gaps; decrease it for a more granular intraday look.
Visual Styles: Fully customizable colors and transparency to match any chart theme (Dark/Light).
NOTES & DISCLAIMER
This script is a visualization of historical price imbalances and is intended for educational purposes only. It does not provide trade signals, entry/exit points, or financial advice. All trading involves risk.

Sen Regression ChannelSen Regression Channel
OVERVIEW
The Sen Regression Channel is a trend-structure visualization tool built on the Theil–Sen estimator, a median-based regression method designed to reduce sensitivity to price outliers. Unlike traditional least-squares regression channels, this approach anchors trend using the most representative slope across the lookback period, resulting in a more stable and noise-resistant structure.
TECHNICAL LOGIC & ORIGINALITY
To protect the proprietary implementation of the median-slope engine and adaptive band construction, this script is published as Protected.
Median Slope Engine
Calculates the Theil–Sen slope by evaluating the median rate of change across the lookback window, producing a trendline less distorted by extreme candles or transient volatility.
Adaptive Volatility Bands
Channel width can be derived from either Standard Deviation or ATR, allowing the envelope to adjust dynamically to changing volatility regimes.
Multi-Reference Context (Optional)
VWAP and EMA/SMA overlays can be enabled to compare the median regression structure against commonly used price and volume-weighted references.
HOW TO USE (EDUCATIONAL)
This tool is designed to help analyze trend quality and market structure, not to generate trade signals.
Trend Direction & Stability
A sustained upward or downward slope of the median regression line indicates directional structure with reduced noise sensitivity.
Volatility Expansion Zones
Price closing outside the channel bands highlights volatility expansion relative to the median trend and may signal regime change.
Mean-Reversion Context
Price oscillation between the median line and bands reflects balanced conditions; movement toward the outer bands indicates relative extension.
VWAP Confluence
Alignment between the regression midline and VWAP may highlight areas of consensus value.
USER INPUTS
Lookback Period – Sets the window for the median slope calculation
Band Multiplier – Scales the channel width
Band Method – Standard Deviation or ATR-based envelope
Visual Overlays – Toggle VWAP, midline, and cloud transparency
NOTES
This script is a historical charting and visualization tool for educational purposes only.
It does not provide trade signals, alerts, or financial advice.
All values are calculated in real time using available chart data.
Linear Regression Channel with Crossover SignalsLinear Regression Channel with Crossover Signals is an overlay indicator that plots a statistically derived **linear regression channel** around price and optionally generates **crossover / re-entry signals**, labels, alerts, and a small on-chart dashboard. It is designed to help visualize trend direction (via regression slope), typical price “containment” (via deviation bands), and potential breakout/mean-reversion events when price interacts with the channel.
---
## What this indicator shows
### 1) Linear Regression Midline (trend estimate)
The midline is the **linear regression value** of `close` over the selected *Regression Length*. It represents the “best fit” straight line through the last *N* bars, providing:
- **Trend direction** (via slope: rising/falling/flat)
- A dynamic reference level for midline cross signals (optional)
### 2) Upper / Lower Deviation Bands (channel)
A channel is built around the regression midline using the **standard deviation of price from the regression line**:
- Upper Band = midline + (stdDev × Deviation Multiplier)
- Lower Band = midline − (stdDev × Deviation Multiplier)
This creates a volatility-scaled envelope that adapts to how tightly or loosely price has been tracking the regression line.
### 3) Optional visual aids
You can independently toggle:
- Channel lines (upper/lower)
- Midline
- Channel fill (shaded area between bands)
- Background coloring to reflect whether price is **above / inside / below** the channel
A dashboard (optional) displays live values and context such as band values, distance from bands, current position, and trend direction.
---
## How it works (calculation overview)
### Regression calculation (manual)
The script calculates slope and intercept using a least-squares approach across the last `lengthInput` bars:
- It iterates over the window, builds sums (X, Y, XY, X²), and computes:
- **Slope** and **Intercept** of the regression line
- The midline value plotted is the regression value at the most recent point in the window.
### Standard deviation from the regression line
Instead of using standard deviation of closes directly, it measures the **deviation of each close from the regression line** and computes:
- variance = average of squared deviations
- stdDev = sqrt(variance)
This is what makes the channel represent “how far price typically strays from the trend line” over the lookback period.
---
## Signal logic (what triggers markers)
All signals are optional and controlled by the **Signal Types** toggles.
### A) Upper band cross signals (optional)
- **Upper Breakout (OB)**: price crosses **above** the Upper Band (`crossover(close, upperBand)`)
- **Upper Re-entry**: price crosses **back below** the Upper Band (`crossunder(close, upperBand)`)
These are often interpreted as “extension above channel” and “return from extension,” but interpretation depends on your style (breakout vs mean reversion).
### B) Lower band cross signals (optional)
- **Lower Breakdown (OS)**: price crosses **below** the Lower Band (`crossunder(close, lowerBand)`)
- **Lower Re-entry**: price crosses **back above** the Lower Band (`crossover(close, lowerBand)`)
### C) Midline cross signals (optional)
- **Mid Bullish**: price crosses above the regression midline
- **Mid Bearish**: price crosses below the regression midline
### D) Re-entry-to-channel signals (enabled by default)
The script tracks whether price was previously:
- **above** the channel (close > upperBand)
- **below** the channel (close < lowerBand)
- **inside** the channel
It then triggers “re-entry” when price returns inside the channel:
- **Bullish Re-entry (Bounce Support)**: price was below and crosses back above the Lower Band
- **Bearish Re-entry (Rejection Resistance)**: price was above and crosses back below the Upper Band
These are intended to highlight potential mean-reversion acceptance back into the “normal” channel range.
---
## Plot markers and labels (what you’ll see)
If enabled, the indicator can plot:
- Triangles and circles for band/midline crosses (with short text such as **OB**, **OS**, ▲, ▼)
- Diamond markers for re-entry confirmations (✓ / ✗)
- Optional text labels describing the event (e.g., “OVERBOUGHT Breakout”, “REJECTION Resistance”, etc.)
Note: this script sets high label/line limits (`max_labels_count` / `max_lines_count`) to reduce the chance of hitting platform limits when many signals occur.
---
## Alerts (optional)
When “Enable Alerts” is ON, the script can fire alerts for:
- Upper breakout / upper re-entry
- Lower breakdown / lower re-entry
- Re-entry bounce / re-entry rejection
- Midline bullish / bearish cross
Alerts are triggered **once per bar** when conditions occur. They are informational and should be validated within your trading plan.
---
## Inputs (how to tune it)
### Channel Settings
- **Regression Length**: larger = smoother and slower to react; smaller = more responsive but noisier
- **Deviation Multiplier**: larger = wider channel (fewer band touches); smaller = tighter channel (more touches)
- **Extend Forward**: present as an input, but this version does not draw forward-projected lines; it primarily affects nothing visually unless you add line objects later
### Signal Settings / Types
- Enable only the signal types you actually use to keep charts clean.
- Re-entry signals are ON by default because they depend on context (previously outside → back inside), which many traders find more meaningful than a single cross alone.
### Visual Settings
- Show/hide channel, midline, fill, background coloring
- Customize colors for upper/lower/mid and fill for readability
---
## Limitations / notes (important for public descriptions)
- This is an **indicator**, not a strategy; it does not backtest performance.
- Linear regression channels are **context-dependent**: strong trends can “ride” a band, and ranging markets can produce frequent crosses.
- Signals are based on **price crossing computed bands** and do not predict direction by themselves.
- Standard deviation bands reflect past dispersion around the regression line; volatility regime shifts can change behavior quickly.
- Always apply risk management and confirm with additional context (structure, volume, higher timeframe bias, session conditions, etc.).

Beast Mode - Flux OscillatorBeast Mode – Flux Oscillator (BM-FLUX) is a momentum + volatility-compression oscillator designed to help traders visualize (1) directional momentum shifts and (2) “pressure build-up” periods where volatility contracts and expansion risk increases. It combines a MACD-style momentum core with a Bollinger Bands vs. Keltner Channels squeeze filter, displayed in a clean oscillator pane (overlay=false).
---
What makes it useful/original:
1) You can switch the smoothing method between EMA and VWMA. When VWMA is enabled, the fast/slow averages are volume-weighted, which can help emphasize momentum moves that occur on higher participation.
2) It includes built-in volatility squeeze context by detecting when Bollinger Bands are inside Keltner Channels and marking those compression periods on the zero line, helping you interpret momentum signals differently during contraction vs. expansion regimes.
---
How it works (overview):
Momentum core:
- The script calculates a fast MA and slow MA from close (EMA or VWMA depending on the “Weight with Volume?” setting).
- The Fast Flux (MACD line) is: fast_ma − slow_ma
- The Slow Flux (signal line) is: EMA(macd_line, Signal Length)
- The Flux Histogram is: macd_line − signal_line
Squeeze detection:
- Bollinger Bands are calculated using BB Length and BB Mult.
- Keltner Channels are built using the same basis and a True Range average over KC Length scaled by KC Mult.
- A squeeze is active when the Bollinger Bands are fully inside the Keltner Channels.
---
How to read it:
Histogram colors (direction + acceleration):
- Bright green = above zero and rising (bullish momentum strengthening)
- Dark green = above zero but falling (bullish momentum weakening)
- Bright red = below zero and falling (bearish momentum strengthening)
- Dark red = below zero but rising (bearish momentum weakening)
Lines:
- Teal line = MACD line (Fast Flux)
- Orange line = Signal line (Slow Flux)
Squeeze dots:
- A white dot on the zero line indicates “Squeeze Active” (volatility compression).
---
Alerts:
- Flux Cross UP: MACD crosses above signal (momentum turns bullish)
- Flux Cross DOWN: MACD crosses below signal (momentum turns bearish)
- Squeeze Active: volatility compression detected (BB inside KC)
Alerts are informational conditions and do not guarantee outcomes.
---
Limitations / notes:
- This is an indicator (not a strategy) and does not provide backtest results.
- Like most momentum tools it can whipsaw in ranging markets.
- Squeeze conditions highlight volatility compression but do not predict direction by themselves.
- Always use proper risk management and confirm signals with your broader trading plan.

Beast Mode - ORB Indicator [Advanced Retest & Targets]Beast Mode - ORB Indicator
The Beast Mode - ORB Indicator is a comprehensive institutional trading system designed to automate the Opening Range Breakout (ORB) strategy. Unlike standard ORB indicators that simply draw high/low lines, this script integrates "Smart Retest" logic, dynamic risk/reward targets, and volume/volatility filters to help traders identify high-probability setups while filtering out chop and fake-outs.
This tool is designed for Futures (ES, NQ, YM) and Equities traders who rely on the initial market balance to determine the day's directional bias.
How It Works
The Opening Range is defined as the High and Low price established during the first X minutes of the market session (e.g., 5 minutes, 15 minutes). This range represents the initial battle between buyers and sellers.
1. The Range Formation: The script monitors the user-defined opening window (e.g., 9:30–9:35 AM ET). Once the window closes, it plots the ORB High (Green), ORB Low (Red), and Midline (Gray).
2. The Breakout: A signal is generated when a candle closes outside the defined range. This signal is filtered by volume (must be higher than average) and range quality (to avoid trading during extremely tight or over-extended ranges).
3. The Smart Retest (New Feature): Breakouts often fail. The most reliable entry is often the retest of the breakout level. This script uses a unique algorithm to detect valid retests:
- Tolerance: Price must return to within a specific point range of the ORB level.
- Rejection: Price must physically "bounce" away from the level by a minimum point value.
- Volume: The rejection candle must have significant volume to confirm institutional defense of the level.
Key Features
1. Dynamic Risk/Reward Targets
The indicator automatically projects profit targets based on the size of the Opening Range:
- Target 1 (💰): Placed at a 1:1 ratio relative to the range size. (e.g., If the range is 20 points, T1 is 20 points above the High).
- Target 2: A user-defined multiplier (default 2.0x) for extended trend days.
- Stop Loss Zones: Visual dotted lines indicating statistically significant stop-loss placement levels.
2. Smart Retest Logic
Instead of blindly buying a touch of the line, the script waits for confirmation. It looks for a "Checkmark" pattern: Breakout -> Pullback to Zone -> Rejection Bounce. Retest signals are marked with a distinct "RE" label.
3. Quality Filters
- Volume Filter: Ensures that breakout signals are backed by relative volume (RVOL) to avoid "low volume drift" fake-outs.
- Range Filter: Prevents signals if the Opening Range is too small (chop) or too large (exhaustion), based on point values.
4. Professional Dashboard
A data table displays real-time statistics:
- Status: Forming, Active, or Waiting.
- Range: The exact size of the opening range in points.
- Position: Current price relation to the ORB (Above/Below/Inside).
- Targets: Exact price levels for T1 and T2.
Settings & Configuration
- ORB Timeframe: Select between 5m PreMarket, 5m Standard, 15m, or 30m ranges.
- Trading Session: Define your active trading hours (signals are muted outside this window).
- Target Multiplier: Adjust the extension for the second target (e.g., 1.5x, 2.0x, 3.0x).
- Retest Specifics:
- Tolerance: How close price must get to the line to count as a test.
- Min Bounce: How hard price must reject to trigger a signal.
- Visuals: Fully customizable colors for lines, backgrounds, and labels.
Disclaimer
This indicator is a technical analysis tool intended to assist in identifying market structure and potential areas of interest. Past performance of the Opening Range Breakout strategy does not guarantee future results. Users should always manage risk appropriately and use this tool in conjunction with their own analysis.
Concepts based on standard institutional Opening Range Breakout theory.

Gamma Conviction OscillatorGamma Conviction Oscillator
OVERVIEW
The Gamma Conviction Oscillator is a specialized momentum study that integrates volume-weighted price change with a dynamic volatility-adjustment engine. Unlike traditional oscillators, it scales its sensitivity based on current market ATR, allowing the tool to stay responsive during low-volatility drifts and stabilize during high-volatility expansions.
THE MATH BEHIND THE "CONVICTION"
Volatility-Adjusted Sensitivity: The script utilizes a normalized ATR ratio to calculate a 'Dynamic Adjustment Factor.' This ensures that overbought/oversold thresholds are not static but react to the current market regime.
Volume-Weighted Basis: Momentum is calculated using the product of price-change and volume, ensuring that "Conviction" is only displayed when there is actual participation behind the move.
Trend-Alignment Filter: The coloring engine uses a long-term moving average anchor to determine the 'Context.' Conviction is categorized as 'Trend-Aligned' or 'Counter-Trend' based on the price relation to this long-term anchor.
HOW TO USE
Observe the Oscillator Color:
Bright Lime / Bright Red: High-momentum extremes aligned with the long-term trend. Indicates areas where price movement has strong participation and trend confirmation.
Teal / Maroon: Counter-trend momentum extremes, highlighting potential areas for trend testing or mean-reversion.
Assess Overbought and Oversold Zones:
The dynamic overbought (OB) and oversold (OS) levels adjust based on current market volatility. Readings outside these zones indicate stronger-than-normal conviction.
Consider Trend Context:
Compare the oscillator reading to the long-term trend (based on the selected moving average). Alignment with the trend reinforces trend strength; divergence may indicate temporary pullbacks or consolidation.
Adjust Inputs for Your Trading Timeframe:
Base Oscillator Length: Shorter values make the oscillator more responsive to intraday momentum; longer values smooth for swing analysis.
Volatility Smoothing Length: Controls sensitivity to ATR fluctuations; higher values reduce noise in volatile markets.
Dynamic Sensitivity Factor: Fine-tunes how strongly volatility influences the oscillator scale.
Use as an Educational Guide:
This tool is a visualization of historical and current momentum. Use it to study how momentum builds, fades, or reverses. It does not generate trade signals and is for educational and informational purposes only.
NOTES
All calculations are proprietary and protected to preserve the underlying logic. This script is intended purely as an educational visualization tool.

Rainbow Road [kingthies]Rainbow Road
Rainbow Road is a trend-structure and momentum visualization tool built around a cascading chain of smoothed simple moving averages. Instead of plotting independent moving averages on price, each line is progressively smoothed from the prior one using the same length, creating a layered “road” that reveals trend strength, direction, and transition with exceptional clarity.
OVERVIEW
Rainbow Road visualizes trend quality using a spectrum of fast-to-slow moving averages derived from one another. Because each average is smoothed from the prior line, the indicator forms a continuous structure rather than a collection of unrelated signals. This makes trend alignment, momentum expansion, and compression immediately visible.
HOW IT WORKS
The first average is a Simple Moving Average of price
Each subsequent average is an SMA of the previous average using the same length
This creates a cascading chain of averages with increasing smoothness
Colors progress from red (fastest) to purple (slowest) to represent trend hierarchy
HOW TO READ IT
Strong Trend : All averages are aligned and expanding in the same direction
Acceleration : Spacing between averages increases
Deceleration : Spacing narrows while direction remains intact
Consolidation : Averages converge and overlap
Reversal Risk : Faster averages cross back through the slowest average
TREND CONTEXT
The optional fill between the fastest and slowest averages visualizes overall trend pressure. Expanding fill suggests strengthening momentum, while contracting fill highlights compression and potential regime change.
USE CASES
Trend confirmation and directional bias
Momentum expansion vs compression analysis
Identifying trend exhaustion and early reversal zones
Contextual filtering for entries and exits
WHY RAINBOW ROAD
Traditional moving average stacks often produce clutter and redundant signals. Rainbow Road focuses on structure and flow, helping traders evaluate the quality of a trend rather than reacting to individual crossovers.
BEST USED WITH
Price action and market structure
Support and resistance
Volatility or range-based tools
Higher-timeframe trend bias
Rainbow Road is designed to sit quietly on your chart and clearly communicate whether the market is flowing, stalling, or preparing to turn.
