Dynamic Liquidity Depth [BigBeluga]
Dynamic Liquidity Depth
A liquidity mapping engine that reveals hidden zones of market vulnerability. This tool simulates where potential large concentrations of stop-losses may exist — above recent highs (sell-side) and below recent lows (buy-side) — by analyzing real price behavior and directional volume. The result is a dynamic two-sided volume profile that highlights where price is most likely to gravitate during liquidation events, reversals, or engineered stop hunts.
🔵 KEY FEATURES
Two-Sided Liquidity Profiles:
Plots two separate profiles on the chart — one above price for potential sell-side liquidity , and one below price for potential buy-side liquidity . Each profile reflects the volume distribution across binned zones derived from historical highs and lows.
Real Stop Zone Simulation:
Each profile is offset from the current high or low using an ATR-based buffer. This simulates where traders might cluster their stop-losses above swing highs (short stops) or below swing lows (long stops).
Directional Volume Analysis:
Buy-side volume is accumulated only from bullish candles (close > open), while sell-side volume is accumulated only from bearish candles (close < open). This directional filtering enhances accuracy by capturing genuine pressure zones.
Dynamic Volume Heatmap:
Each liquidity bin is rendered as a horizontal box with a color gradient based on volume intensity:
- Low activity bins are shaded lightly.
- High-volume zones appear more vividly in red (sell) or lime (buy).
- The maximum volume bin in each profile is emphasized with a brighter fill and a volume label.
Extended POC Zones:
The Point of Control (PoC) — the bin with the most volume — is extended backwards across the entire lookback period to mark critical resistance (sell-side) or support (buy-side) levels.
Total Volume Summary Labels:
At the center of each profile, a summary label displays Total Buy Liquidity and Total Sell Liquidity volume.
This metric helps assess directional imbalance — when buy liquidity is dominant, the market may favor upward continuation, and vice versa.
Customizable Profile Granularity:
You can fine-tune both Resolution (Bins) and Offset Distance to adjust how far profiles are displaced from price and how many levels are calculated within the ATR range.
🔵 HOW IT WORKS
The indicator calculates an ATR-based buffer above highs and below lows to define the top and bottom of the liquidity zones.
Using a user-defined lookback period, it scans historical candles and divides the buffered zones into bins.
Each bin checks if bullish (or bearish) candles pass through it based on price wicks and body.
Volume from valid candles is summed into the corresponding bin.
When volume exists in a bin, a horizontal box is drawn with a width scaled by relative volume strength.
The bin with the highest volume is highlighted and optionally extended backward as a zone of importance.
Total buy/sell liquidity is displayed with a summary label at the side of the profile.
🔵 USAGE/b]
Identify Stop Hunt Zones: High-volume clusters near swing highs/lows are likely liquidation zones targeted during fakeouts.
Fade or Follow Reactions: Price hitting a high-volume bin may reverse (fade opportunity) or break with strength (confirmation breakout).
Layer with Other Tools: Combine with market structure, order blocks, or trend filters to validate entries near liquidity.
Adjust Offset for Sensitivity: Use higher offset to simulate wider stop placement; use lower for tighter scalping zones.
🔵 CONCLUSION
Dynamic Liquidity Depth transforms raw price and volume into a spatial map of liquidity. By revealing areas where stop orders are likely hidden, it gives traders insight into price manipulation zones, potential reversal levels, and breakout traps. Whether you're hunting for traps or trading with the flow, this tool equips you to navigate liquidity with precision.
Volumeprofileanalysis

Price Map Profile [BigBeluga]An advanced volume-based tool designed to map out how trading activity is distributed across price levels. It combines dynamic volume profiling with structural pivot detection to highlight key levels of interest in the market — including hidden support/resistance zones and dominant liquidity areas.
Unlike traditional volume profiles locked to fixed sessions, this indicator continuously processes historical bars to build a real-time "map" of volume distribution. It intelligently reveals where buyers and sellers were most active, helping traders pinpoint high-impact zones with clarity.
🔵 KEY FEATURES
Creates a volume map profile by scanning price action over a defined lookback window (`length`).
Divides price vertically into volume bins (default: 100) and aggregates either total volume or bar count per bin.
Bins are plotted as horizontal zones extending to the right of the chart — wider offset means more volume at that price.
Each zone is color-coded using gradients to represent volume magnitude:
- Below average volume = cool tones (blue/teal)
- Above average volume = warm tones (red/orange)
The highest volume bin is highlighted with a red label showing the exact volume, helping to identify strong price agreement.
Detects pivot highs and lows using a 15-bar swing method, marking them as potential S/R levels.
If a pivot level is located inside a low-volume zone (volume < average), it is emphasized with a dashed line and label .
Pivot line color matches direction:
- High pivots = yellow
- Low pivots = aqua
The volume of the bin containing the pivot is shown alongside the pivot, providing volume context for the structural level.
Filters out nearby duplicate pivots using ATR-based distance checks to ensure clean and non-redundant signals.
🔵 HOW TO USE
Use the wide red zones as liquidity and consolidation areas where price may stall, reverse, or absorb volume.
Pivot-based dashed lines within low-volume zones highlight hidden support/resistance levels where price may react sharply.
Combine this indicator with trend or order flow tools to validate reversal or breakout setups .
Switch between Volume and Frequency modes to adapt to the type of data your asset provides.
🔵 CONCLUSION
The Price Map Profile transforms raw volume into an actionable visual map. By aligning volume depth with key market structure levels, it helps traders identify where market participants are most active — and where hidden inefficiencies lie. Ideal for traders seeking precision entries, dynamic S/R zones, and deeper volume structure insight.

Volume Profile [ActiveQuants]The Volume Profile indicator visualizes the distribution of trading volume across price levels over a user-defined historical period. It identifies key liquidity zones, including the Point of Control (POC) (price level with the highest volume) and the Value Area (price range containing a specified percentage of total volume). This tool is ideal for traders analyzing support/resistance levels, market sentiment , and potential price reversals .
█ CORE METHODOLOGY
Vertical Price Rows: Divides the price range of the selected lookback period into equal-height rows.
Volume Aggregation: Accumulates bullish/bearish or total volume within each price row.
POC: The row with the highest total volume.
Value Area: Expands from the POC until cumulative volume meets the user-defined threshold (e.g., 70%).
Dynamic Visualization: Rows are plotted as horizontal boxes with widths proportional to their volume.
█ KEY FEATURES
- Customizable Lookback & Resolution
Adjust the historical period ( Lookback ) and granularity ( Number of Rows ) for precise analysis.
- Configurable Profile Width & Horizontal Offset
Control the relative horizontal length of the profile rows, and set the distance from the current bar to the POC row’s anchor.
Important: Do not set the horizontal offset too high. Indicators cannot be plotted more than 500 bars into the future.
- Value Area & POC Highlighting
Set the percentage of total volume required to form the Value Area , ensuring that key volume levels are clearly identified.
Value Area rows are colored distinctly, while the POC is marked with a bold line.
- Flexible Display Options
Show bullish/bearish volume splits or total volume.
Place the profile on the right or left of the chart.
- Gradient Coloring
Rows fade in color intensity based on their relative volume strength .
- Real-Time Adjustments
Modify horizontal offset, profile width, and appearance without reloading.
█ USAGE EXAMPLES
Example 1: Basic Volume Profile with Value Area
Settings:
Lookback: 500 bars
Number of Rows: 100
Value Area: 70%
Display Type: Up/Down
Placement: Right
Image Context:
The profile appears on the right side of the chart. The POC (orange line) marks the highest volume row. Value Area rows (green/red) extend above/below the POC, containing 70% of total volume.
Example 2: Total Volume with Gradient Colors
Settings:
Lookback: 800 bars
Number of Rows: 100
Profile Width: 60
Horizontal Offset: 20
Display Type: Total
Gradient Colors: Enabled
Image Context:
Rows display total volume in a single color with gradient transparency. Darker rows indicate higher volume concentration.
Example 3: Left-Aligned Profile with Narrow Value Area
Settings:
Lookback: 600 bars
Number of Rows: 100
Profile Width: 45
Horizontal Offset: 500
Value Area: 50%
Profile Placement: Left
Image Context:
The profile shifts to the left, with a tighter Value Area (50%).
█ USER INPUTS
Calculation Settings
Lookback: Historical bars analyzed (default: 500).
Number of Rows: Vertical resolution of the profile (default: 100).
Profile Width: Horizontal length of rows (default: 50).
Horizontal Offset: Distance from the current bar to the POC (default: 50).
Value Area (%): Cumulative volume threshold for the Value Area (default: 70%).
Volume Display: Toggle between Up/Down (bullish/bearish) or Total volume.
Profile Placement: Align profile to the Right or Left of the chart.
Appearance
Rows Border: Customize border width/color.
Gradient Colors: Enable fading color effects.
Value Area Colors: Set distinct colors for bullish and bearish Value Area rows.
POC Line: Adjust color, width, and visibility.
█ CONCLUSION
The Volume Profile indicator provides a dynamic, customizable view of market liquidity. By highlighting the POC and Value Area, traders can identify high-probability reversal zones, gauge market sentiment, and align entries/exits with key volume levels.
█ IMPORTANT NOTES
⚠ Lookback Period: Shorter lookbacks prioritize recent activity but may omit critical levels.
⚠ Horizontal Offset Limitation: Avoid excessively high offsets (e.g., close to ±300). TradingView restricts plotting indicators more than 500 bars into the future, which may truncate or hide the profile.
⚠ Risk Management: While the indicator highlights areas of concentrated volume, always use it in combination with other technical analysis tools and proper risk management techniques.
█ RISK DISCLAIMER
Trading involves substantial risk. The Volume Profile highlights historical liquidity but does not predict future price movements. Always use stop-loss orders and confirm signals with additional analysis. Past performance is not indicative of future results.
📊 Happy trading! 🚀

Fibonacci Volume Profiles [AlgoAlpha]Unlock a deeper understanding of price action with the Fibonacci Volume Profiles indicator by AlgoAlpha! This powerful tool blends Fibonacci retracement levels with customizable volume profiles, helping traders identify high-probability areas of support, resistance, and accumulation. Designed for both continuous dynamic levels and custom time periods, this indicator is a must-have for traders seeking confluence in market structure analysis.
🔑 Key Features
📈 Dual Mode Selection : Choose between Continuous Fibonacci levels, which adapt dynamically to pivots, or a Custom Period mode, where you set your own start and end points.
📊 Integrated Volume Profile : Visualize volume distributions at key Fibonacci retracement levels, revealing areas of strong buying/selling interest.
🎨 Customizable Colors & Transparency : Adjust Fibonacci level colors, fill zones, and profile transparency for a visually clear experience.
🔍 Profile Resolution & Scaling : Control the number of price levels and width of the volume profile for detailed market insights.
🛠 Extendable Levels : Optionally extend Fibonacci levels to the right of the chart for better visualization of future price interaction.
📌 How to Use
Add the Indicator: Click on the star icon to add it to your favorites and apply it to your TradingView chart.
Analyze The Market: Observe how price interacts with Fibonacci levels alongside the volume profile to confirm support/resistance zones. Switch between custom range or continuous mode to align the tool with your trading style.
⚙️ How It Works
The indicator calculates pivot highs/lows dynamically (or uses user-defined time periods) to plot Fibonacci retracement levels. It then builds a volume profile by analyzing historical volume data, grouping it into price bins to highlight volume-heavy zones. The Point of Control (PoC) is identified as the level with the highest traded volume, acting as a key price magnet. The color-coded Fibonacci levels help traders spot retracement zones, while the volume profile confirms strength or weakness in those areas.

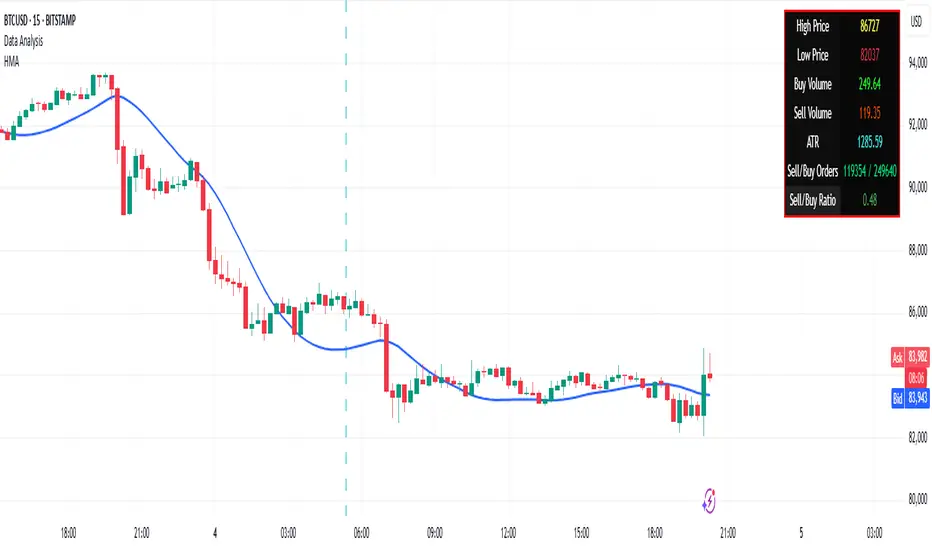
Volume Data Customized TimeframeThe "Volume Data Customized Timeframe" (VolData CTF) indicator provides traders with an enhanced volume analysis tool that aggregates buy and sell volume over a user-defined timeframe. It enables a comparative assessment of bullish and bearish volume trends, offering deeper insights into market sentiment. The indicator features a customizable display table with user-selectable themes and positioning, providing essential volume metrics for improved trading decisions.
1. Introduction:
The "Volume Data Customized Timeframe" indicator is designed to help traders analyze volume trends across different timeframes. It allows users to customize the period for volume calculations, view the ratio of selling to buying volume, and present the data in a user-friendly table format.
2. Features:
Selectable timeframe for volume analysis (default: chart timeframe)
Calculation of bullish (buy) and bearish (sell) volume
Customizable table size, theme, and positioning
Displays key volume metrics:
Total Buy Volume
Total Sell Volume
Sell/Buy Volume Ratio
Analysis period in minutes, days, weeks, or months
3. Indicator Inputs:
Average Volume Lookback (n): Number of bars used to calculate volume statistics.
Select Timeframe: Custom timeframe for volume calculations (leave empty to use the chart's timeframe).
Table Size: Choose from Small, Medium, or Big to adjust text size.
Table Theme: Choose between Light and Dark themes.
Table Position: Place the table in any corner of the chart (top-left, top-right, bottom-left, bottom-right).
4. How It Works:
The indicator retrieves volume data for the selected timeframe.
It aggregates bullish and bearish volume based on the lookback period.
The sell-to-buy volume ratio is calculated and color-coded (green for bullish dominance, red for bearish dominance).
The volume statistics are displayed in a customizable table for easy reference.
5. Interpretation:
Δ BUY VOL: Represents the total volume of bullish (up-closing) bars within the lookback period.
Δ SELL VOL: Represents the total volume of bearish (down-closing) bars within the lookback period.
Δ SELL/Δ BUY: The ratio of bearish to bullish volume; values above 1 indicate more selling pressure, while values below 1 indicate buying dominance.
Period (M/D/W/M): Displays the selected timeframe for volume aggregation.
Real-Time HTF Volume Footprint [BigBeluga]Real-time HTF Volume Footprint Profile is designed to provide a comprehensive view of higher timeframe volume profiles on your current chart. It overlays critical volume information from larger timeframes (like daily, weekly, or monthly) onto lower timeframe charts, helping you spot significant levels where volume is concentrated, acting as potential support or resistance.
🔵 Key Features:
HTF High and Low Zones: The indicator highlights the high and low of the chosen higher timeframe with clear zones, marking them with boxes. These zones help you see the broader market structure at a glance.
Volume Profile within HTF Range: Each higher timeframe range displays a volume profile, showing the distribution of volume at each price level. The most-traded price is highlighted in blue, known as the Point of Control (POC), indicating the price level with the highest activity.
Dynamic POC Option: Activate Dynamic POC to observe how the Point of Control shifts over time, giving insight into changing market interests and potential price direction.
Timeframe Flexibility: Select from daily, weekly, and monthly ranges (and more) to overlay their footprint profiles on your lower timeframe chart. This helps you tailor the indicator to the trading horizon that suits your strategy.
Info Table: Table shows a traders which timeframe is selected with last high and low of the selected timeframe
Visual Clarity with Custom Colors: The indicator uses subtle fills and distinct colors to ensure volume profile data integrates seamlessly into your chart without overwhelming other indicators or price data.
🔵 When to Use:
The HTF Volume Footprint Profile is essential for traders who want to bridge the gap between high-timeframe and intraday analysis. By visualizing HTF volume distribution on lower timeframes, this tool helps you:
Spot potential liquidity zones where price might react.
Identify support and resistance levels within HTF ranges.
Monitor PoC shifts that indicate changes in market behavior.
Track how current price aligns with significant volume clusters, providing a clear edge for volume-based strategies.
This indicator empowers traders to analyze lower timeframes with the context of higher timeframe volume profiles, providing a solid basis for identifying critical support and resistance levels shaped by large volume clusters. Whether you’re looking to spot liquidity zones or align your trades with broader market trends, HTF Volume Footprint Profile equips you with a strategic view.

Volume Delta Candles HTF [TradingFinder] LTF Volume Candles 🔵 Introduction
In financial markets, understanding the concepts of supply and demand and their impact on price movements is of paramount importance. Supply and demand, as fundamental pillars of economics, reflect the interaction between buyers and sellers.
When buyers' strength surpasses that of sellers, demand increases, and prices tend to rise. Conversely, when sellers dominate buyers, supply overtakes demand, causing prices to drop. These interactions play a crucial role in determining market trends, price reversal points, and trading decisions.
Volume Delta Candles offer traders a practical way to visualize trading activity within each candlestick. By integrating data from lower timeframes or live market feeds, these candles eliminate the need for standalone volume indicators.
They present the proportions of buying and selling volume as intuitive colored bars, making it easier to interpret market dynamics at a glance. Additionally, they encapsulate critical metrics like peak delta, lowest delta, and net delta, allowing traders to grasp the market's internal order flow with greater precision.
In financial markets, grasping the interplay between supply and demand and its influence on price movements is crucial for successful trading. These fundamental economic forces reflect the ongoing balance between buyers and sellers in the market.
When buyers exert greater strength than sellers, demand dominates, driving prices upward. Conversely, when sellers take control, supply surpasses demand, and prices decline. Understanding these dynamics is essential for identifying market trends, pinpointing reversal points, and making informed trading decisions.
Volume Delta Candles provide an innovative method for evaluating trading activity within individual candlesticks, offering a simplified view without relying on separate volume indicators. By leveraging lower timeframe or real-time data, this tool visualizes the distribution of buying and selling volumes within a candle through color-coded bars.
This visual representation enables traders to quickly assess market sentiment and understand the forces driving price action. Buyer and seller strength is a critical concept that focuses on the ratio of buying to selling volumes. This ratio not only provides insights into the market's current state but also serves as a leading indicator for detecting potential shifts in trends.
Traders often rely on volume analysis to identify significant supply and demand zones, guiding their entry and exit strategies. Delta Candles translate these complex metrics, such as Maximum Delta, Minimum Delta, and Final Delta, into an easy-to-read visual format using Japanese candlestick structures, making them an invaluable resource for analyzing order flows and market momentum.
By merging the principles of supply and demand with comprehensive volume analysis, tools like the indicator introduced here offer unparalleled clarity into market behavior. This indicator calculates the relative strength of supply and demand for each candlestick by analyzing the ratio of buyers to sellers.
🔵 How to Use
The presented indicator is a powerful tool for analyzing supply and demand strength in financial markets. It helps traders identify the strengths and weaknesses of buyers and sellers and utilize this information for better decision-making.
🟣 Analyzing the Highest Volume Trades on Candles
A unique feature of this indicator is the visualization of price levels with the highest trade volume for each candlestick. These levels are marked as black lines on the candles, indicating prices where most trades occurred. This information is invaluable for identifying key supply and demand zones, which often act as support or resistance levels.
🟣 Trend Confirmation
The indicator enables traders to confirm bullish or bearish trends by observing changes in buyer and seller strength. When buyer strength increases and demand surpasses supply, the likelihood of a bullish trend continuation grows. Conversely, decreasing buyer strength and increasing seller strength may signal a potential bearish trend reversal.
🟣 Adjusting Timeframes and Calculation Methods
Users can customize the indicator's candlestick timeframe to align with their trading strategy. Additionally, they can switch between moving average and current candle modes to achieve more precise market analysis.
This indicator, with its accurate and visual data display, is a practical and reliable tool for market analysts and traders. Using it can help traders make better decisions and identify optimal entry and exit points.
🔵 Settings
Lower Time Frame Volume : This setting determines which timeframe the indicator should use to identify the price levels with the highest trade volume. These levels, displayed as black lines on the candlesticks, indicate prices where the most trades occurred.
It is recommended that users align this timeframe with their primary chart’s timeframe.
As a general rule :
If the main chart’s timeframe is low (e.g., 1-minute or 5-minute), it is better to keep this setting at a similarly low timeframe.
As the main chart’s timeframe increases (e.g., daily or weekly), it is advisable to set this parameter to a higher timeframe for more aligned data analysis.
Cumulative Mode :
Current Candle : Strength is calculated only for the current candlestick.
EMA (Exponential Moving Average) : The strength is calculated using an exponential moving average, suitable for identifying longer-term trends.
Calculation Period : The default period for the exponential moving average (EMA) is set to 21. Users can modify this value for more precise analysis based on their specific requirements.
Ultra Data : This option enables users to view more detailed data from various market sources, such as Forex, Crypto, or Stocks. When activated, the indicator aggregates and displays volume data from multiple sources.
🟣 Table Settings
Show Info Table : This option determines whether the information table is displayed on the chart. When enabled, the table appears in a corner of the chart and provides details about the strength of buyers and sellers.
Table Size : Users can adjust the size of the text within the table to improve readability.
Table Position : This setting defines the table’s placement on the chart.
🔵 Conclusion
The indicator introduced in this article is designed as an advanced tool for analyzing supply and demand dynamics in financial markets. By leveraging buyer and seller strength ratios and visually highlighting price levels with the highest trade volume, it aids traders in identifying key market zones.
Key features, such as adjustable analysis timeframes, customizable calculation methods, and precise volume data display, allow users to tailor their analyses to market conditions.
This indicator is invaluable for analyzing support and resistance levels derived from trade volumes, enabling traders to make more accurate decisions about entering or exiting trades.
By utilizing real market data and displaying the highest trade volume lines directly on the chart, it provides a precise perspective on market behavior. These features make it suitable for both novice and professional traders aiming to enhance their analysis and trading strategies.
With this indicator, traders can gain a better understanding of supply and demand dynamics and operate more intelligently in financial markets. By combining volume data with visual analysis, this tool provides a solid foundation for effective decision-making and improved trading performance. Choosing this indicator is a significant step toward refining analysis and achieving success in complex financial markets.

IQ Zones [TradingIQ]Hey Traders!
Introducing "IQ Zones".
"IQ Zones" is an indicator that combines support and resistance identification with volume, the "value area" of a candlestick to be exact. IQ Zones identifies turning points in the market; however, the candlestick high or low that formed the key turning point is not necessarily distinguished as the support/resistance area. Instead, the script looks into the bar at lower timeframes and calculates the value area of the candlestick that formed the support or resistance level. Therefore, any lines protruding from a candlestick reflect the value area of that candlestick. These levels (value area high and value area low) are marked on the candlestick as a support/resistance level. If the level formed on high volume it's marked as an "IQ Zone".
Additionally, IQ Zones presents a heat map to show volume intensity at nearby price areas. The heatmap is a product of the Volume Profile (IQ Profile) located on the right of the chart.
The IQ Profile is a segmented volume profile. Recent price is split into fifths (customizable), and individual volume profiles are calculated for all segmented price areas. Price is split into more than one segment to avoid a situation where volume in a ranging price zone far surpasses all other recent price areas - creating an "unusable" volume profile that doesn't offer helpful insights. If desired, you can set the segmenting option to "1" to calculate one unified volume profile for the entire price range.
The image above shows IQ Zones in action!
Core Features of IQ Zones
Value Area Support and Resistance Levels
Segmented volume profile for the recent trading period
Volume intensity heatmap
Support and resistance levels in high volume intensity may be more significant as price stoppers
The image above explains the labels marked along the y-axis of the IQ Profile.
The "more green" a price area/label is, the higher the volume intensity at the marked support/resistance area.
The image above further explains line lines protruding from the IQ Profile.
For this example, the value area of the candlestick (where most trading action occurred) is quite far from the high price of the candlestick that formed a resistance level! Using the value area of a candlestick that marks a key turning point to draw support/resistance offers insight into where the majority of trading action took place when the support/resistance level was forming!
Additionally, you can hover your mouse over the IQ Zone labels (triangles pointing up or down) to see the prices of the value area for the support/resistance level, including the total buying volume and total selling volume at the price area!
The image above further explains the IQ Profile!
You can segment the recent price area anywhere from 1 - 15 times.
The image above further explains IQ Zones and the IQ Profile!
That will be all for this indicator - a fun project to share with the community.
Thank you!

Dynamic Supply and Demand Zones [AlgoAlpha]Introducing the Dynamic Supply and Demand Zones by AlgoAlpha. This indicator is designed to automatically identify and visualize dynamic supply and demand zones on your chart, helping traders pinpoint potential reversal areas and assess market sentiment with enhanced clarity. It adapts to market conditions using a dynamic look-back mechanism, making it more responsive to recent price movements. 📈💡
Key Features
📊 Dynamic Look-Back : Automatically adjusts the look-back period based on the most recent pivot point, ensuring the most relevant data is analyzed.
🎯 Pivot Point Detection : Utilizes a user-defined period to detect significant pivot highs and lows, marking potential reversal points with precision.
🛠 Customizable Parameters : Offers extensive customization options including look-back period, pivot detection sensitivity, resolution, and zone tolerance.
🗺 Visual Display : Shows supply and demand zones as boxes on the chart, with optional profiles and background highlighting to differentiate between bullish and bearish zones.
🖍 Color-Coded Zones : Zones are color-coded for easy identification: green for bullish, red for bearish, and gray for neutral levels.
🔔 Alert Conditions : Triggers alerts when new pivot points are detected, ensuring you never miss a key market movement.
How to Use
🚀 Adding the Indicator : Press the star icon and add the indicator to favorites. Add it to your chart and adjust settings to fit your trading strategy.
🔍 Zone Analysis : Observe the color-coded zones on the chart. Bullish zones indicate potential support areas, while bearish zones suggest resistance. Monitor price interactions with these zones for potential entry and exit signals.
🔔 Alerts : Activate alert conditions for new pivot detections to stay ahead of market reversals.
How It Works
The indicator starts by detecting pivot highs and lows over a specified period. These pivots serve as reference points for determining the analysis range. If the Dynamic Look-Back feature is enabled, the look-back range dynamically adjusts from the most recent pivot to the current bar. Otherwise, a fixed look-back period is used. The price range is divided into multiple bins based on a specified resolution, and each bin’s volume is calculated by accumulating the volume of candles that fall within its price range. A zone is defined as significant if its volume is less than the adjacent bins, and the difference meets the Zone Tolerance criteria, indicating a potential area of support or resistance. These zones are then plotted on the chart as boxes. Bullish zones are shown in green, and bearish zones in red, helping traders visually identify key levels where supply and demand imbalances may cause price reversals.

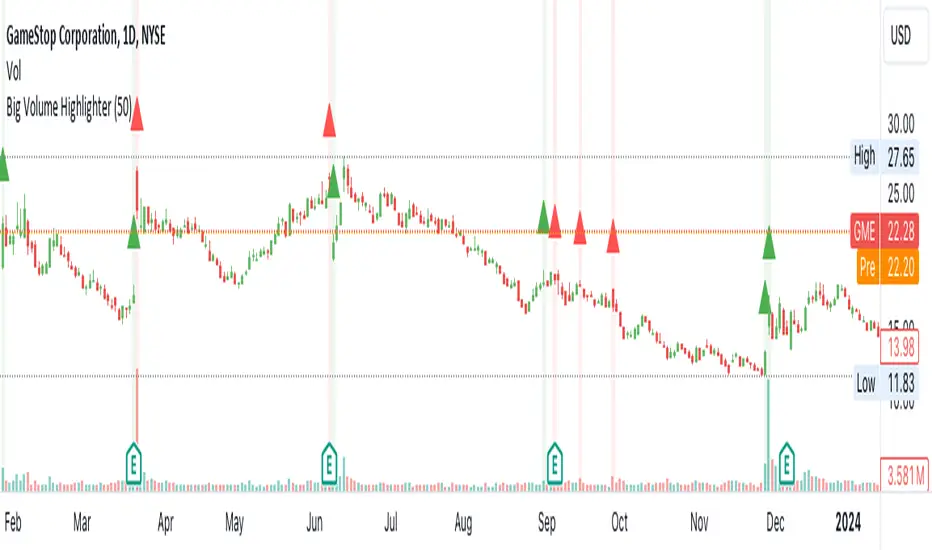
Big Volumes HighlighterBig Volumes Highlighter
Overview:
The "Big Volume Highlighter" is a powerful tool designed to help traders quickly identify candles with the highest trading volume over a specified period. This indicator not only highlights the most significant volume candles but also color-codes them based on the candle's direction—green for bullish (close > open) and red for bearish (close < open). Whether you're analyzing volume spikes or looking for key moments in price action, this indicator provides clear visual cues to enhance your trading decisions.
Features:
Customizable Lookback Period: Define the number of candles to consider when determining the highest volume.
Automatic Color Coding: Candles with the highest volume are highlighted in green if bullish and red if bearish.
Visual Clarity: The indicator marks the significant volume candles with a triangle above the bar and changes the background color to match, making it easy to spot important volume events at a glance.
Use Cases:
Volume Spike Detection:
Quickly identify when a large volume enters the market, which may indicate significant buying or selling pressure.
Trend Confirmation: Use volume spikes to confirm trends or potential reversals by observing the direction of the high-volume candles.
Market Sentiment Analysis: Understand market sentiment by analyzing the direction of the candles with the biggest volumes.
How to Use:
Add the "Big Volume Highlighter" to your chart.
Adjust the lookback period to suit your analysis.
Observe the highlighted candles for insights into market dynamics.
This script is ideal for traders who want to incorporate volume analysis into their technical strategy, providing a simple yet effective way to monitor significant volume changes in the market.
Delta Flow Profile [LuxAlgo]The Delta Flow Profile is a charting tool that tracks and visualizes money flow and the difference between buying and selling pressure accumulated within multiple price ranges over a specified period. It reveals the relationship between an asset's price and traders' willingness to buy or sell, helping traders identify significant price levels and analyze market activity.
The Normalized Profile displays the percentage of money flow at each price level relative to the maximum money flow level, enabling traders to easily compare levels and understand the relative importance of each price point in the context of overall trading activity.
🔶 USAGE
The Delta Flow Profile is made of two principal components with different usability, each one of them described in the sub-sections below.
🔹 Money Flow Profile
The Money Flow Profile illustrates the total buying and selling activity at different price ranges. By analyzing this profile, users can identify key price zones with substantial buying or selling pressure. These zones can often act as potential support or resistance.
The rows of the Money Flow Profile represent the trading activity at specific price ranges over a given period.
A normalized profile is included to compare each zone relative to the peak money flow using a percentage, with 100% indicating that a price range is the one with the highest accumulated money flow.
🔹 Delta Profile
The Delta Profile assesses the dominant sentiment (buying or selling) from volume delta at different price levels to gauge market sentiment and potential reversals.
Delta Profile rows with more significant buying or selling volume indicate dominance from one side of the market in that specific price area. Price coming back to that area might indicate willingness from a dominant side to further accumulate orders within it, potentially causing price to follow the direction established by this dominant side afterward.
The volume delta is determined from the user-selected Polarity Method, with "Bar Polarity" using candle sentiment to determine if a bar associated volume is buying or selling volume, and "Bar Buying/Selling Pressure" making use of the high/low price to obtain more precise results.
🔹 Level of Significance
Users can quickly highlight the price levels with the highest recorded money flow activity through the included "Level of Significance". Various display methods are included:
Developing: Show the price level with the highest recorded money flow activity spanning over the indicator calculation interval.
Level: Show the price level with the highest recorded money flow activity.
Row: Show the price zone with the highest recorded money flow activity.
These levels/zones can be used as potential support/resistance points and can serve as a reference of where prices might go next for market participants to accumulate orders.
🔶 SETTINGS
The script offers a range of customizable settings to tailor the analysis to your trading needs.
🔹 Calculation Settings
Money Flow Profile: Toggles the visibility of the Money Flow Profile.
Normalized: Toggles the visibility of the Normalized Profile.
Sentiment Profile: Toggles the visibility of the Sentiment Profile.
Polarity Method: Choose between Bar Polarity or Bar Buying/Selling Pressure to calculate the Sentiment Profile.
Level of Significance: Toggles the visibility of the level of significance line/zone.
Lookback Length / Fixed Range: Sets the lookback length.
Number of Rows: Specify how many rows each profile histogram will have.
🔹 Display Settings
Profile Width %: Alters the width of the rows in the histogram, relative to the profile length.
Profile Horizontal Offset: Enables moving the profile on the horizontal axis.
Profile Text: Toggles the visibility of profile texts, and alters the size of the text. Setting to Auto will keep the text within the box limits.
Currency: Extends the profile text with the traded currency.
Profile Price Levels: Toggles the visibility of the profile price levels.
🔶 RELATED SCRIPTS
Money-Flow-Profile
Volume-Profile-with-Node-Detection

Rolling Price Activity Heatmap [AlgoAlpha]📈 Rolling Price Activity Heatmap 🔥
Enhance your trading experience with the Rolling Price Activity Heatmap , designed by AlgoAlpha to provide a dynamic view of price activity over a rolling lookback period. This indicator overlays a heatmap on your chart, highlighting areas of significant price activity, allowing traders to spot key price levels at a glance.
🌟 Key Features
📊 Rolling Heatmap: Visualize historical price activity intensity over a user-defined lookback period.
🔄 Customizable Lookback: Adjust the heatmap lookback period to suit your trading style.
🌫️ Transparency Filter: Fine-tune the heatmap’s transparency to filter out less significant areas.
🎨 Color Customization: Choose colors for up, down, and highlight areas to fit your chart’s theme.
🔄 Inverse Heatmap Option: Flip the heatmap to highlight less active areas if needed.
🛠 Add the Indicator: Add the Indicator to favorites. Customize settings like lookback period, transparency filter, and colors to fit your trading style.
📊 Market Analysis: Watch for areas of high price activity indicated by the heatmap to identify potential support and resistance levels.
🔧 How it Works
This script calculates the highest and lowest prices within a specified lookback period and divides the price range into 15 segments. It counts the number of candles that fall within each segment to determine areas of high and low price activity. The script then plots the heatmap on the chart, using varying levels of transparency to indicate the strength of price activity in each segment, providing a clear visual representation of where significant trading occurs.
Stay ahead of the market with this powerful visualization tool and make informed trading decisions! 📈💼

Weighted Volume Profile Pivot Points | Flux Charts💎 GENERAL OVERVIEW
Introducing our new Weighted Volume Profile Pivot Points (WVPPP) Indicator! This indicator renders a volume profile using the latest pivot points, automatically adjusting itself when new pivots occur. The pivoting mode can be switched between default pivot points and order blocks mode. It can be adjusted to give more weight to recent or past candlesticks, or can be used as a normal volume profile. For more information, please read the full write-up.
Features of the new Weighted Volume Profile Pivot Points (WVPPP) Indicator :
Renders Volume Profile Of The Range Between Latest Pivots
Two Pivoting Modes Including Order Blocks Mode
Adjustable Weighthing Towards Past or Recent
Customizable Row Count & Maximum Distance
Left or Right Alignment
More Styling Options
🚩UNIQUENESS
This indicator stands out with two key features. One is it's ability to weight volumes based on their distance to the current time. Giving weight to volumes may offer new trading opportunities to traders as they can now see the most recent Point Of Control (POC) or a more powerful but past POC based on their choice. Another key feature the indicator has is that it automatically finds latest valid pivot points, and uses that range for the volume profile. The range changes dynamically as new pivots points emerge. You can select between normal pivot points and order blocks mode. The indicator also has a variety of useful styling settings such as aligning the volume profile to the right or the left of the chart, POC Line styling and color settings for bullish & bearish volumes.
📌 HOW DOES IT WORK ?
A volume profile provides an in-depth look at trading activity over a period of time by plotting a histogram on the price axis. This indicator can also give weight to volumes based on their distance to the current time, essentially determining their importance for the profile. The range which the volume profile will cover is determined by the latest pivot points. Here is how it works step-by-step :
1. Determine how much candlesticks the volume profile will cover (Analyze Bars setting)
2. Find the latest pivot points. If the mode is set to "Pivots", the pivot points are the candlesticks which has the highest / lowest wick in X amount of bars (Swing Length setting). If the mode is set to "Order Blocks", the volume profile range is the area between the latest buyside order block and the sellside order block. Order blocks occur when there is a high amount of market orders exist on a price range. It is possible to find order blocks using specific candlestick formations on the chart. For more information about the order block detection, I suggest you checking the write-up of our "Volumized Order Blocks" script. Increasing the "Swing Length" setting is recommended when the mode is set to "Pivots", as this will help in finding stronger pivot points.
3. Make a range using the latest pivot points, then divide it into rows (Row Count setting)
4. Then for each candlestick, add it's volume to the corresponding row in the range. Note that the volume can be added into several rows if it overlaps with them all.
5. If the candlestick is a bullish candlestick, we add it's volume into the bullish volume of the row, if it's a bearish candlestick, we add it to the bearish volume of the row.
With the weighted volume mode, which is activated if "Volume Weighthing" setting is set to "Recent" or "Past", all volumes get a penalty based on their distance to the latest candletstick. For example, if the setting is set to "Recent", the latest candlestick contributes it's volume by 100% to the corresponding row, but the candlestick which is 50 candlesticks far from the current candlestick only contributes it's volume by ~17% to the row. The same applies to the "Past" setting, but in the reversed order, where past candlesticks have more priority than the current ones.
Volume contribution percent for "Recent" setting : ((100 * 0.85) / (i + 1)) + (100 * (1.0 - 0.85))
Volume contribution percent for "Past" setting : ((100 * 0.85) * ((i + 1) / N)) + (100 * (1.0 - 0.85))
Where i = candlestick index from right to left, N = total number of candlesticks analyzed by the volume profile.
The Point Of Control (POC) line is drawn from the row with the most total volume, and is generally considered as a strong level because a lot of trading volume happened on that particular row. Traders may use this line as a support & resistance level.
We believe that automatically ranging the volume profile to important pivot points will help traders see crucial volume information easier without unnecessary hassle. Traders can use this indicator to have an insight of areas which price moves quickly without much volume, or see areas that holds the price still for much longer and plan their trades accordingly.
⚙️SETTINGS
1. General Configuration
Mode -> The pivoting mode that is switchable between "Pivots" and "Order Blocks" as described in the write-up. Please read the upper section to understand how this setting works.
Analyze Bars -> Total amount of bars that will be analyzed by the indicator from right to left.
Row Count -> The amount of rows that will the vertical range between pivot points will be divided into.
Volume Weighting -> The volume weighting mode as explained in the write-up.
2. Style
Highlight Sessions -> The volume profile sessions will be highlighted with a blue tint. To prevent confusion, highlighting will not work if the alignment is set to "Right".
Align To -> The alignment of the volume profile.

Weighted Volume Profile | Flux Charts💎 GENERAL OVERVIEW
Introducing our new Weighted Volume Profile Indicator! This indicator renders a volume profile based on the volume of latest candlesticks. It can be adjusted to give more weight to recent or past candlesticks, or can be used as a normal volume profile. For more information, please read the full write-up.
Features of the new Weighted Volume Profile indicator :
Renders Volume Profile Of Current Ticker
Adjustable Weighthing Towards Past or Recent
Customizable Row Count & Maximum Distance
Left or Right Alignment
More Styling Options
🚩UNIQUENESS
This indicator differs from a normal volume profile indicator by it's ability to weight volumes based on their distance to the current time. Giving weight to volumes may offer new trading opportunities to traders as they can now see the most recent Point Of Control (POC) or a more powerful but past POC based on their choice. The indicator also has a variety of useful styling settings such as aligning the volume profile to the right or the left of the chart, POC Line styling and color settings for bullish & bearish volumes.
📌 HOW DOES IT WORK ?
A volume profile provides an in-depth look at trading activity over a period of time by plotting a histogram on the price axis. This indicator can also give weight to volumes based on their distance to the current time, essentially determining their importance for the profile. Here is how it works step-by-step :
1. Determine how much candlesticks the volume profile will cover (Analyze Bars setting)
2. Make a range from the highest point of chart to the lowest point of chart, then divide it into rows (Row Count setting)
3. For each candlestick, add it's volume to the corresponding row in the range. Note that the volume can be added into several rows if it overlaps with them.
4. If the candlestick is a bullish candlestick, we add it's volume into the bullish volume of the row, if it's a bearish candlestick, we add it to the bearish volume of the row.
With the weighted volume mode, which is activated if "Volume Weighthing" setting is set to "Recent" or "Past", all volumes get a penalty based on their distance to the latest candletstick. For example, if the setting is set to "Recent", the latest candlestick contributes it's volume by 100% to the corresponding row, but the candlestick which is 50 candlesticks far from the current candlestick only contributes it's volume by ~17% to the row. The same applies to the "Past" setting, but in the reversed order, where past candlesticks have more priority than the current ones.
Volume contribution percent for "Recent" setting : ((100 * 0.85) / (i + 1)) + (100 * (1.0 - 0.85))
Volume contribution percent for "Past" setting : ((100 * 0.85) * ((i + 1) / N)) + (100 * (1.0 - 0.85))
Where i = candlestick index from right to left, N = total number of candlesticks analyzed by the volume profile.
The Point Of Control (POC) line is drawn from the row with the most total volume, and is generally considered as a strong level because a lot of trading volume happened on that particular row. Traders may use this line as a support & resistance level.
Traders can use this indicator to have an insight of areas which price moves quickly without much volume, or see areas that holds the price still for much longer and plan their trades accordingly.
⚙️SETTINGS
1. General Configuration
Analyze Bars -> Total amount of bars that will be analyzed by the indicator from right to left.
Row Count -> The amount of rows that will the vertical range of chart will be divided into.
Volume Weighting -> The volume weighting mode as explained in the write-up.
2. Style
Align To -> The alignment of the volume profile.

Volume Profile with Node Detection [LuxAlgo]The Volume Profile with Node Detection is a charting tool that allows visualizing the distribution of traded volume across specific price levels and highlights significant volume nodes or clusters of volume nodes that traders may find relevant in utilizing in their trading strategies.
🔶 USAGE
The volume profile component of the script serves as the foundation for node detection while encompassing all the essential features expected from a volume profile. See the sub-sections below for more detailed information about the indicator components and their usage.
🔹 Peak Volume Node Detection
A volume peak node is identified when the volume profile nodes for the N preceding and N succeeding nodes are lower than that of the evaluated one.
Displaying peak volume nodes along with their surrounding N nodes (Zones or Clusters) helps visualize the range, typically representing consolidation zones in the market. This feature enables traders to identify areas where trading activity has intensified, potentially signaling periods of price consolidation or indecision among market participants.
🔹 Trough Volume Node Detection
A volume trough node is identified when the volume profile nodes for the N preceding and N succeeding nodes are higher than that of the evaluated one.
🔹 Highest and Lowest Volume Nodes
Both the highest and lowest volume areas play significant roles in trading. The highest volume areas typically represent zones of strong price acceptance, where a significant amount of trading activity has occurred. On the other hand, the lowest volume areas signify price levels with minimal trading activity, often indicating zones of price rejection or areas where market participants have shown less interest.
🔹 Volume profile
Volume profile is calculated based on the volume of trades that occur at various price levels within a specified timeframe. It divides the price range into discrete price intervals, typically known as "price buckets" or "price bars," and then calculates the total volume of trades that occur at each price level within those intervals. This information is then presented graphically as a histogram or profile, where the height of each bar represents the volume of trades that occurred at that particular price level.
🔶 SETTINGS
🔹 Volume Nodes
Volume Peaks: Toggles the visibility of either the "Peaks" or "Clusters" on the chart, depending on the specified percentage for detection.
Node Detection Percent %: Specifies the percentage for the Volume Peaks calculation.
Volume Troughs: Toggles the visibility of either the "Troughs" or "Clusters" on the chart, depending on the specified percentage for detection.
Node Detection Percent %: Specifies the percentage for the Volume Troughs calculation.
Volume Node Threshold %: A threshold value specified as a percentage is utilized to detect peak/trough volume nodes. If a value is set, the detection will disregard volume node values lower than the specified threshold.
Highest Volume Nodes: Toggles the visibility of the highest nodes for the specified count.
Lowest Volume Nodes: Toggles the visibility of the lowest nodes for the specified count.
🔹 Volume Profile - Components
Volume Profile: Toggles the visibility of the volume profile with either classical display or gradient display.
Value Area Up / Down: Color customization option for the volume nodes within the value area of the profile.
Profile Up / Down Volume: Color customization option for the volume nodes outside of the value area of the profile.
Point of Control: Toggles the visibility of the point of control, allowing selection between "developing" or "regular" modes. Sets the color and width of the point of control line accordingly.
Value Area High (VAH): Toggles the visibility of the value area high level and allows customization of the line color.
Value Area Low (VAL): Toggles the visibility of the value area low level and allows customization of the line color.
Profile Price Labels: Toggles the visibility of the Profile Price Levels and allows customization of the text size of the levels.
🔹 Volume Profile - Display Settings
Profile Lookback Length: Specifies the length of the profile lookback period.
Value Area (%): Specifies the percentage for calculating the value area.
Profile Placement: Specify where to display the profile.
Profile Number of Rows: Specify the number of rows the profile will have.
Profile Width %: Adjusts the width of the rows in the profile relative to the profile range.
Profile Horizontal Offset: Adjusts the horizontal offset of the profile when it is selected to be displayed on the right side of the chart.
Value Area Background: Toggles the visibility of the value area background and allows customization of the fill color.
Profile Background: Toggles the visibility of the profile background and allows customization of the fill color.
🔶 RELATED SCRIPTS
Supply-Demand-Profiles
Liquidity-Sentiment-Profile
Thanks to our community for recommending this script. For more conceptual scripts and related content, we welcome you to explore by visiting >>> LuxAlgo-Scripts .

Rolling Point of Control (POC) [AlgoAlpha]Enhance your trading decisions with the Rolling Point of Control (POC) Indicator designed by AlgoAlpha! This powerful tool displays a dynamic Point of Control based on volume or price profiles directly on your chart, providing a vivid depiction of dominant price levels according to historical data. 🌟📈
🚀 Key Features:
Profile Type Selection: Choose between Volume Profile and Price Profile to best suit your analysis needs.
Adjustable Lookback Period: Modify the lookback period to consider more or less historical data for your profile.
Customizable Resolution and Scale: Tailor the resolution and horizontal scale of the profile for precision and clarity.
Trend Analysis Tools: Enable trend analysis with the option to display a weighted moving average of the POC.
Color-Coded Feedback: Utilize color gradients to quickly identify bullish and bearish conditions relative to the POC.
Interactive Visuals: Dynamic rendering of profiles and alerts for crossing events enhances visual feedback and responsiveness.
Multiple Customization Options: Smooth the POC line, toggle profile and fill visibility, and choose custom colors for various elements.
🖥️ How to Use:
🛠 Add the Indicator:
Add the indicator to favorites and customize settings like profile type, lookback period, and resolution to fit your trading style.
📊 Market Analysis:
Monitor the POC line for significant price levels. Use the histogram to understand price distributions and locate major market pivots.
🔔 Alerts Setup:
Enable alerts for price crossing over or under the POC, as well as for trend changes, to stay ahead of market movements without constant chart monitoring.
🛠️ How It Works:
The Rolling POC indicator dynamically calculates the Point of Control either based on volume or price within a user-defined lookback period. It plots a histogram (profile) that highlights the level at which the most trading activity has occurred, helping to identify key support and resistance levels.
Basic Logic Overview:
- Data Compilation: Gathers high, low, and volume (if volume profile selected) data within the lookback period.
- Histogram Calculation: Divides the price range into bins (as specified by resolution), counting hits in each bin to find the most frequented price level.
- POC Identification: The price level with the highest concentration of hits (or volume) is marked as the POC.
- Trend MA (Optional): If enabled, the indicator plots a moving average of the POC for trend analysis.
By integrating the Rolling Point of Control into your charting toolkit, you can significantly enhance your market analysis and potentially increase the accuracy of your trading decisions. Whether you're day trading or looking at longer time frames, this indicator offers a detailed, customizable perspective on market dynamics. 🌍💹

Market Structure Volume Distribution [LuxAlgo]The Market Structure Volume Distribution tool allows traders to identify the strength behind breaks of market structure at defined price ranges to measure de correlation of forces between bulls and bears visually and easily.
🔶 USAGE
This tool has three main features: market structure highlighting, grid levels, and volume profile. Each feature is covered more in depth below:
🔹 Market Structure
The basic unit of market structure is a swing point, the period of the swing point is user-defined, so traders can identify longer-term market structures. Price breaking a prior swing point will confirm the occurrence of a market structure.
The tool will plot a line after a market structure is confirmed, by default the lines on bullish MS will be green (indicative of an uptrend), and red in case of bearish MS (indicative of a downtrend).
🔹 Grid Levels
The Grid visually divides the price range contained inside the tool execution window, into equal size rows, the number of rows is user-defined so users can divide the full price range up to 100 rows.
The main objective of this feature is to help identify the execution window and the limits of each row in the volume profile so traders can know in a simple look what BoMS belongs to each row.
There is however another use for the grid, by dividing the range into equal-sized parts, this feature provides automatic support and resistance levels as good as any other.
Grid provides a visual help to know what our execution window is and to associate MS with their rows in the profile. It can provide S/R levels too.
🔹 Volume Profile
The volume profile feature shows in a visually easy way the volume behind each MS aggregated by rows and divided into buy and sell volume to spot the differences in a simple look.
This tool allows users to spot the liquidity associated with the event of a market structure in a specific price range, allowing users to know which price areas where associated with the most trading activity during the occurrence of a market structutre.
🔶 SETTINGS
🔹 Data Gathering
Execute on all visible range: Activate this to use all visible bars on the calculations. This disables the use of the next parameter "Execute on the last N bars". Default false.
Execute on the last N bars: Use last N bars on the calculations. To use this parameter "Execute on all visible range" must be disabled. Values from 20 to 5000, default 500.
Pivot Length: How many bars will be used to confirm a pivot. The bigger this parameter is the fewer breaks of structure will detect. Values from 1, default 2
🔹 Profile
Profile Rows: Number of rows in the volume profile. Values from 2 to 100, default 10.
Profile Width: Maximum width of the volume profile. Values from 25 to 500, default 200.
Profile Mode: How the volume will be displayed on each row. "TOTAL VOLUME" will aggregate buy & sell volume per row, "BUY&SELL VOLUME" will separate the buy volume from the sell volume on each row. Default BUY&SELL VOLUME.
🔹 Style
Buy Color: This is the color for the buy volume on the profile when the "BUY&SELL VOLUME" mode is activated. Default green.
Sell Color: This is the color for the sell volume on the profile when the "BUY&SELL VOLUME" mode is activated. Default red.
Show dotted grid levels: Show dotted inner grid levels. Default true.

Money Flow Profile [LuxAlgo]The Money Flow Profile is a charting tool that measures the traded volume or the money flow at all price levels on the market over a specified time period and highlights the relationship between the price of a given asset and the willingness of traders to either buy or sell it, allowing traders to reveal dominant and/or significant price levels and to analyze the trading activity of a particular user-selected range.
This tool combines a volume/money flow profile, a sentiment profile, and price levels, where the right side of the profile highlights the distribution of the traded activity/money flow at different price levels, the left side of the profile highlights the market sentiment at those price levels, and in the middle the price levels.
🔶 USAGE
A volume/money flow profile is an advanced charting tool that displays the traded volume/money flow at different price levels over a specific period. It helps traders visualize where the majority of trading activity/money flow has occurred.
A sentiment profile is a difference between buy and sell volume/money flow aiming to highlight the sentiment/dominance at specific price levels.
Each row of the profile presents figures on volume and money flow specific to price levels.
High volume/money flow nodes indicate areas of high activity and are likely to act as support or resistance in the future. They attract price and try to hold it there. Conversely, low-volume nodes are areas with low trading activity, that are less subject to get revisited by the price. The market often bounces right over these levels, not staying for long. The "Profile Heatmap" option of the script helps to better emphasize the trading activity within each areas.
By measuring the traded activity at each price level the script presents an ability to highlight the consolidation zones, in other words, highlights accumulation and distribution zones. When the price moves toward one end of the consolidation and volume pick up, it can foreshadow a potential breakout.
Level of Significance, Point of Control, Highest Sentiment Zone, and Profile Price levels are some of the other profile-related options available with the script.
🔶 SETTINGS
The script takes into account user-defined parameters and plots the profiles, where detailed usage for each user-defined input parameter in indicator settings is provided with the related input's tooltip.
🔹 Profile Generic Settings
Lookback Length / Fixed Range: Sets the lookback length.
Profile Source: Sets the profile source, Volume, or Money Flow.
🔹 Profile Presentation Settings
Volume/Money Flow Profile: Toggles the visibility of the Volume/Money Flow Profile.
High Traded Nodes: Threshold and Color option for high traded nodes.
Average Traded Nodes: Color option for average traded nodes.
Low Traded Nodes: Threshold and Color option for low traded nodes.
🔹 Sentiment Profile Settings
Sentiment Profile: Toggles the visibility of the Sentiment Profile.
Sentiment Polarity Method: Sets the method used to calculate the up/down volume/money flow.
Bullish Nodes: Color option for Bullish Nodes.
Bearish Nodes: Color option for Bearish Nodes.
🔹 Profile Heatmap Settings
Profile Heatmap: Toggles the visibility of the profile heatmap.
Heatmap Source: Sets the source of the profile heatmap, Volume/Money Flow Profile, or Sentiment Profile.
Heatmap Transparency: Control the transparency of the profile heatmap.
🔹 Other Presentation Settings
Level of Significance: Toggles the visibility of the level of significance line/zone.
Consolidation Zones: Toggles the visibility of the consolidation zones.
Consolidation Threshold, Color: Sets the threshold value and zone color.
Highest Sentiment Zone: Toggles the visibility of the highest bullish or bearish sentiment zone.
Profile Price Levels, Color, Size: Toggles the visibility of the profile price levels, and sets the color and the size of the level labels.
Profile Range Background Fill: Toggles the visibility of the profiles range.
🔹 Other Settings
Number of Rows: Specify how many rows each profile histogram will have.
Profile Width %: Alters the width of the rows in the histogram, relative to the profile length
Profile Text Size: Alters the size of the text. Setting to Auto will keep the text within the box limits.
Profile Horizontal Offset: Enables to move profile in the horizontal axis.
🔶 RELATED SCRIPTS
Liquidity-Sentiment-Profile
Swing-Volume-Profiles
For more and other conceptual scripts you are kindly invited to visit LuxAlgo-Scripts .

VSA Volume Spread AnalysisVolume Spread Analysis with Trend Direction is an indicator designed to Identify trend based volume spread.
Volume
Spread
Trend
This is a very simple yet powerful to identify Trend and corresponding volume Breakout. Unlike other Volume Indicators this indicator detects Breakout along with trend direction. One can detect the Early breakout in volume using this indicator. The Buy or Sell Signal is based on zero crossing of the Histogram.
Trend direction is confirmed using the MA of the Histogram which is similar to the Volume MA on volume indicator. One can enter a trade using the indicator when Trend direction and histogram are in same direction. Entry is done when ever histogram crosses the Trend MA line.
Fake entries can be eliminated by changing the indicator to higher Timeframe.
Spread is determined using the difference in open and close of the candle
Volume change is determined using the ratio of change of volume to previous volume
EMA 10 is used to determine the Spread and multiplied by volume change so the
PRICE(ema10), Volume, Spread(close-open) are merged to one indicator.
Direction changes when ever difference of VSA is positive or negative.

Volume Heatmap 2024 | NXT2017 Christmas EditionHi big players around the world,
I wish you a merry christmas time.
Today I have a nice present for you: a new volume heatmap indicator for free using!
HISTORY
My first volume heatmap project got a lot of feedback and a big demand. You can find it here:
In this time pinescript version 4 was the newest one and I worked the first time with arrays.
Today we have pinescript version 5 and some new features. This is why I tried again with matrix function and the results are better than I expected.
HOW IT WORKS
The indicator calculates similar like the volume profile. It looks back and every volume where the close price is on the same row area, the volume will cumulated. How much rows the new chart view is showing, you can choose manually.
The mind behind this is to find high volume levels, where high volume catch the price in a range or get function as support/resistance line.
PICTURES
I hope it helps for your trading. You are welcome to give some comments.
Merry christmas and best regards
NXT2017

Bull Vs Bear Visible Range VP [Kioseff Trading]Hello!
This Script “Bull vs Bear Visible Range VP” Calculates Bull & Bear Volume Profiles for the Visible Range Alongside a Delta Ladder for the Visible Period!
Features
Volume Profile Anchored to Visible Range
Delta Ladder Anchored to Visible Range
Bull vs Bear Profiles!
Standard Poc and Value Area Lines, in Addition to Separated POCs and Value Area Lines for Bull Profiles and Bear Profiles
Configurable Value Area Target
Curved Profiles
Up to 9999 Profile Rows per Visible Range
Stylistic Options for Profiles
This Script Generates Bull vs. Bear Volume Profiles for the Visible Range!
Up to 9999 Volume Profile Levels (Price Levels) Can Be Calculated for Each Profile, Thanks to the New Polyline Feature, Allowing For Less Aggregation / More Precision of Volume at Price and Volume Delta.
Bull vs Bear Profiles
The Image Above Shows Primary Functionality!
Green Profiles = Buying Volume
Red Profiles = Selling Volume
Bullish & Bearish Pocs for the Visible Range Are Displayable!
Profiles Can Be Anchored on the Left Side for a More Traditional Look.
The indicator is robust enough to calculate on "small price periods", or for a price period spanning your entire chart fully zoomed out!
That’s About It :D
This Indicator Is Part of a Series Titled “Bull vs. Bear” - A Suite of Profile-Like Indicators I Will Be Releasing Over Coming Days. Thanks for Checking This Out!
If You Have Any Suggestions Please Feel Free to Share!

Zig-Zag Volume Profile (Bull vs. Bear) [Kioseff Trading]Hello!
Thank you @Pinecoders and @TradingView for putting polylines in production and making this viable!!
This script "Zig Zag Volume Profile" implements the polyline feature for Pine Script!
Features
Volume Profile anchored to zig zag trends
Bull vs Bear profiles!
Delta x price level
Standard POC and value area lines, in addition to separated POCs and value area lines for bull profiles and bear profiles
Up to 9999 profile rows per zigzag trend
Stylistic options for profiles
Configurable zig zag - profiles generated for small to large trends
Polylines!
This script generates Bull vs. Bear volume profiles for zig zag trends!
The zigzag indicator is configurable as normal; minor and major trend volume profiles are calculable. This indicator can be thought of as "Volume Profile/Delta for Trends''.
Up to 9999 volume profile levels (price levels) can be calculated for each profile, thanks to the new polyline feature, allowing for less aggregation / more precision of volume at price and volume delta.
Zig Zag Bull Vs Bear Profiles
The image above shows primary functionality!
Green profiles = buying volume
Red profiles = selling volume
Profiles are generated for each trend identified by the zigzag indicator.
The image above shows the indicator calculating volume delta for specific price blocks on the profile. Aggregate volume delta for the identified trend is displayed over the profile!
The image above shows Bull Profile POC lines and value area lines. Bear Profile POC lines and value area lines are also shown!
All colors and transparencies are configurable to the user's liking :D
Additionally, you can select to have the profiles drawn on contrasting sides. Bull Profile on left and Bear Profile on right.
For a more traditional look - you can select to draw the Bull & Bear profiles on the same x-point.
The indicator is robust enough to calculate on "long zig zags" and "short zig zags"; curved profiles can also be used!
The image above exemplifies usage of the indicator!
Bull & Bear volume profiles are calculated for trends on the 30-second timeframe.
The image above shows a more "utilitarian" presentation of the profiles. Once more, line and linefill colors/transparencies are all customizable; the indicator can look however you would like it to!
The image above shows key levels, the Bull vs. Bear profile, and volume delta for the current trend!
That's about it :D
This indicator is part of a series titled "Bull vs. Bear" - a suite of profile-like indicators I will be releasing over coming days. Thanks for checking this out!
Of course, a big thank you to @RicardoSantos for his MathOperator library that I use in every script.
If you have any suggestions please feel free to share!

Volume HeatMap With Profile [ChartPrime]The Volume Heatmap with Profile indicator is a tool designed to provide traders with a comprehensive view of market activity through customizable visualizations. This indicator goes beyond traditional volume analysis by offering a range of adjustable parameters and features that enhance analysis of volume and give a cleaner experience when analyzing it.
To get started click the start and end time for the profile.
Key Features:
Extended Calculation: This indicator extends its calculation to the last bar, ensuring that the user has insights into current market dynamics.
Point of Control (POC): Easily identify the price level at which the highest trading activity has occurred, helping the user pinpoint potential reversal points and significant support/resistance zones.
VWAP Point of Control: Display the Volume Weighted Average Price (VWAP) Point of Control, giving the user a clear reference for determining the average price traders are paying and potential price reversals.
Adjustable Colors for Heatmap: Change the heatmap colors to the users preference, allowing the user to match the indicator's appearance to their chart style and personal visual preferences.
Forecasted Zone: This feature allows traders to forecast areas of high activity by providing the option to adjust colors within this zone. This feature assists in identifying potential breakouts or areas where increased trading volume is anticipated.
Volume Profile: Customize the colors of the volume profile to make it distinct and easily distinguishable on the chart.
Adjustable Volume Levels: Specify the number volume levels that are most relevant to your trading strategy.
Adjustable Placement for Volume Profile: Position the volume profile on the chart. Whether the user prefers it on the left, right, or at the center of the chart, this indicator offers placement flexibility.
The ratio of bull vs bear volume is plotted on the outside of the range indicating how bullish or bearish price action is in a given range.
