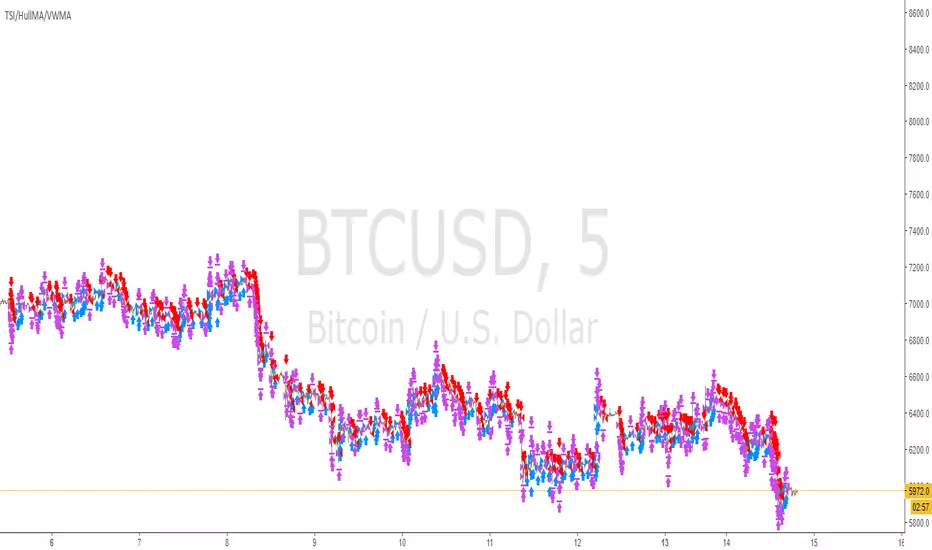
[feeble] TrenderEver wondered which way the price is trending?!
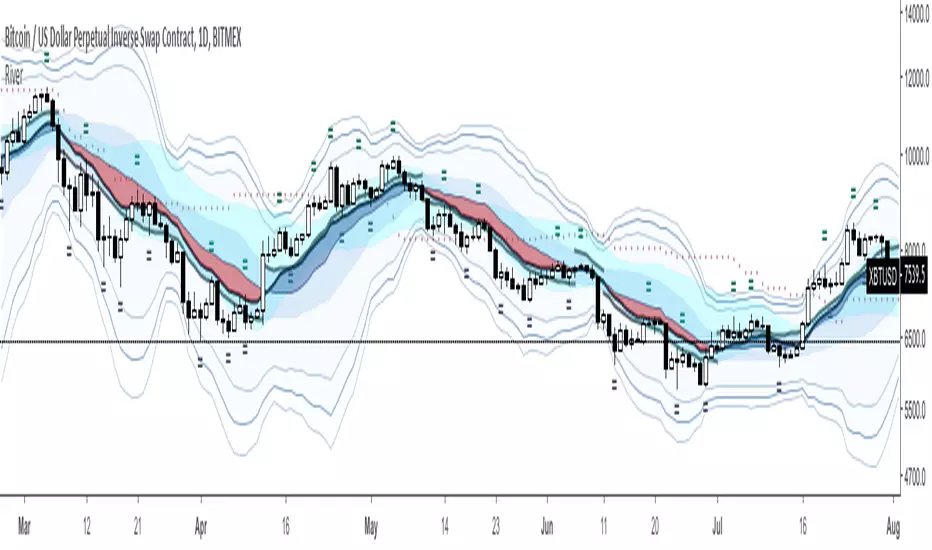
feeble Trender™ **BETA** shows the trend based on middle crossings in different timeframes, volume weighting and volatility (std Deviations)
--The indicator displays the same on any timeframe.
--Select a FROM and TO period
--Use DuPLiCaToR to make 12 copies - use values between 0.8-1.2
--Coloured bands go purple when price is below the volume-weighted mIdBaNd!
--Shows the trend on a few different scales!!
Indicateur Pine Script®