Relative Strength IndexEvery developer must create his own Relative Strength Index with midline and other features).
In addition to the midline, highlighting and levels customization I give you ability to play with non-standard sources like On Balance Volume.
If someone doesn't know what is this:
This indicator was originally developed by J. Welles Wilder and was described in his book "New Concepts in Technical Trading Systems" (1978). It is intended to measure the strength or weakness of an instrument for the specified period.
RSI is a momentum oscillator and can have a reading from 0 to 100. The values of 70 or above indicate that an instrument is becoming overbought or overvalued and may be primed for a trend reversal or corrective pullback in price. The values of 30 or below indicates an oversold or undervalued condition.
The other significant signals are divergences with price and middle line crossovers. RSI if one the most used indicators on the planet.
Enjoy and good luck!
Wilder

RSI ATR ChannelDraws a channel based on ATR (Average True Range) and RSI. Detects band touches and colors the background appropriately.

Heracles Original Wilder's ADX and DI +/- by ZekisOriginal Wilder's ADX and DI +/- (calculated with the 1978's original formula from Wilder's MA and not with the simple moving average, like almost all ADXs)
I changed the aspect for a nice and easy view
Black/yellow dashed line - threshold
Light blue line = ADX
Blue background - ADX above threshold
Yellow background - ADX bellow threshold
Green line - DI +
Red line - DI -
Green DI+/- background and green triangles - uptrend
Red DI +/- background and red triangles - downtrend
Candlesticks are colored according to the pattern
Possibility to enable or disable trend filter (threshold)
Alerts are added for entries and exits or longs or shorts
Green triangle - long/enter
Red triangle - short/exit
Yellow contaminated area - no certain trend
Green candles - uptrend
Red candles - downtrend
Yellow candles - no certain trend
Enjoy!
@ Zekis

Oscillators EqualizerAn oscillator of the oscillators. This is one of my private indicators that implements a quantitative approach: it collects readings from internal oscillators and calculates scores for the selected metric.
Features
46 well-known oscillators
6 metrics ( Bands Breakouts , Overbought/Oversold , Above/Below Middle Line , Middle Line Crossovers , Above/Below Signal Line , Signal Line Crossovers )
Oscillators customization
Implemented oscillators
Relative Strength Index (by J. Welles Wilder)
Chande Momentum Oscillator (by Tushar S. Chande)
Intraday Momentum Index (by Tushar S. Chande)
Stochastic RSI (by Tushar S. Chande and Stanley Kroll)
Aroon Oscillator (by Tushar S. Chande)
R-Squared Index (by Tushar S. Chande and Stanley Kroll)
Forecast Oscillator (by Tushar S. Chande)
Relative Momentum Index (by Roger Altman)
Moving Average Convergence/Divergence (by Gerald Appel)
Connors RSI (by Larry Connors)
Rapid RSI (by Ian Copsey)
Relative Spread Strength (by Ian Copsey)
Vortex Indicator (by Etienne Botes and Douglas Siepman)
Random Walk Index (by Michael Poulos)
True Strength Index (by William Blau)
Stochastic Momentum Index (by William Blau)
Ergodic Oscillator (by William Blau)
Smoothed Rate Of Change (by Fred G. Schutzman)
TRIX (by Jack Hutson)
Pretty Good Oscillator (by Mark Johnson)
Choppiness Index (by Bill Dreiss)
Tick Line Momentum Oscillator (by Daniel E. Downing)
Price Momentum Oscillator
Relative Volatility Index (by Donald Dorsey)
Trend Trigger Factor (by M. H. Pee)
Trend Intensity Index (by M. H. Pee)
Trend Detection Index (by M. H. Pee)
Trend Continuation Factor (by M. H. Pee)
Relative Vigor Index (by John F. Ehlers)
Fisher Transform (by John F. Ehlers)
CG Oscillator (by John F. Ehlers)
Stochastic CG Oscillator (by John F. Ehlers)
Laguerre RSI (by John F. Ehlers)
Rocket RSI (by John F. Ehlers)
Recursive Median Oscillator (by John F. Ehlers)
Super Passband Filter (by John F. Ehlers)
Roofing Filter (by John F. Ehlers)
Ehlers Stochastic (by John F. Ehlers)
Fisherized Deviation-Scaled Oscillator (by John F. Ehlers)
Bollinger Bands %B (by John Bollinger)
Williams %R (by Larry Williams)
Ultimate Oscillator (by Larry Williams)
Money Flow Index (by Gene Quong and Avrum Soudack)
Commodity Channel Index (by Donald Lambert)
Ease of Movement (by Richard W. Arms)
Chaikin Money Flow (by Marc Chaikin)

Average Directional Movement Index Rating ADXR by KIVANÇ fr3762Average Directional Movement Rating quantifies momentum change in the ADX . It is calculated by adding two values of ADX (the current value and a value n periods back), then dividing by two. This additional smoothing makes the ADXR slightly less responsive than ADX . The interpretation is the same as the ADX ; the higher the value, the stronger the trend.
The ADXR , being a smoothed version of ADX , and can be used similarly to the ADX in the three rule system discussed on the ADX section..
The ADXR is a measure of the spread between the Directional Indicators ( +DI and -DI ). When the ADXR is declining, it's not advised to use a trend following system. However, a rising ADXR signals that the dominant trend is likely to continue. A rising ADXR , with both the ADXR and DI+ above the D- indicates a strengthening bullish market. The scan syntax needed to represent this condition would be...
ADXR > DIMINUS AND DIPLUS > DIMINUS AND ADXR > ADXR .1
A rising ADXR , with both the ADXR and DI- above DI+ indicates a strengthening bearish trend . The scan syntax needed to represent this condition would be...
ADXR > DIPLUS AND DIMINUS > DIPLUS AND ADXR > ADXR .1
If the ADXR has been below both DI+ and DI- but has begun to rise a new market trend is emerging. The scan syntax needed to represent this condition would be...
ADXR < DIPLUS AND ADXR < DIMINUS AND ADXR > ADXR .1
IMPORTANT NOTICE: USERS CAN ADD ADX DI+ and DI- indicators by checking the box in the settings of the indicator.
Developed by J.Welles Wilder
ÖNEMLİ BİLGİ: KULLANICILAR ADX , DI- ve DI+ indikatörlerini de ayarlar bölümündeki kutucukları işaretleyerek sayfaya ekleyebilirler.

Wilder's RSIThe Wilder's RSI provides signals that tell investors to buy when the security or currency is oversold and to sell when it is overbought.
Best Setup -> 5M, 15M Charts used Level 20 (oversold) & 80 (overbought) , RSI Length at 20 and EMA Of RSI Length at 9
EnJoy ;)

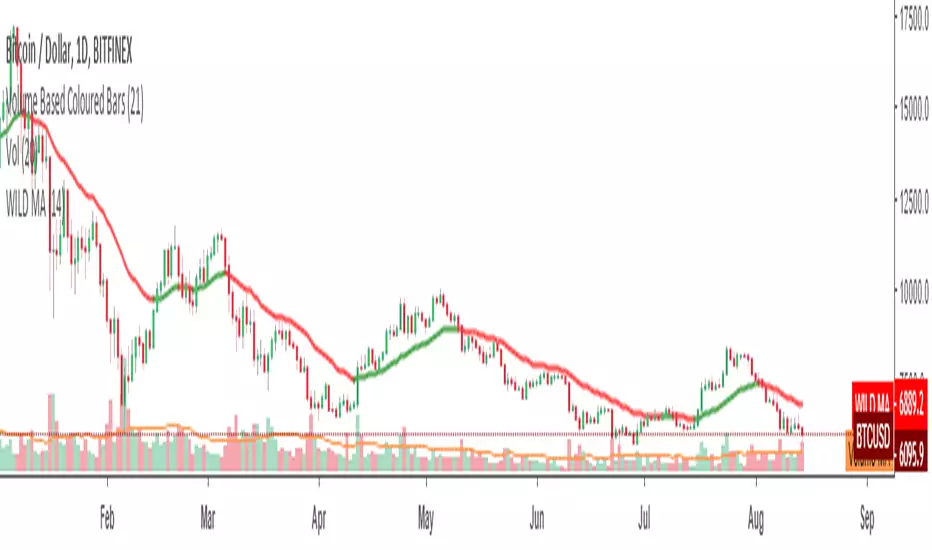
WILDER'S Moving Average by fr3762 KIVANCThe Wilder’s Moving Average indicator (Wilder’s Smoothed Moving Average ) was developed by Welles Wilder and introduced in his 1978 book, “New Concepts in Technical Trading Systems.” Mr. Wilder did not use the standard EMA formula; instead, the following formula is used: EMA = Input * K + EMA * (1-K), where K = 2 / (N+1). Then to find the Wilder’s Moving Average, the following calculation is performed: Input * K + EMA * (1-K), where K =1/N.
Type to use
Moving averages are commonly used to identify trends and reversals as well as identifying support and resistance levels. Moving averages such the WMA and EMA , which are more sensitive to recent prices (experience less lag with price) will turn before an SMA . They are therefore more suitable for dynamic trades, which are reactive to short term price movements. Moving averages such as the SMA move more slowly providing valuable information on the long dominant trend. They can however be prone to giving late signals causing the trader to miss significant parts of the price movement.
Trade Signals
Moving Average Crossovers: Moving average crossovers is a term applied when more than one moving average is used to generate a trade signal where traders will act when the shorter term moving average crosses the longer term moving average. A bullish crossover occurs when the shorter term moving average crosses above the longer term moving average (golden cross). A bearish crossover occurs where the shorter term moving average crosses below the longer term moving average (dead cross).
Price crossovers: A Price crossover is a term applied when a signal is generated where the price crosses a moving average. Bullish signals are given when the price moves above the moving average, bearish signals are given when the price moves below the moving average. Crossover trades are more likely to enjoy success when the moving average slopes are in the direction of the trade.
Support and Resistance: Moving averages can also act as a support level in an uptrend and resistance levels in a downtrend. If the average is widely followed orders in favour of the trend often cluster around the average. As markets are often driven by emotion and many players trade counter to the trend expect overshoots, to this extent the average should be used to identify support and resistance zones rather than exact levels.
from: mahifx.com
Developed by WELLES WILDER
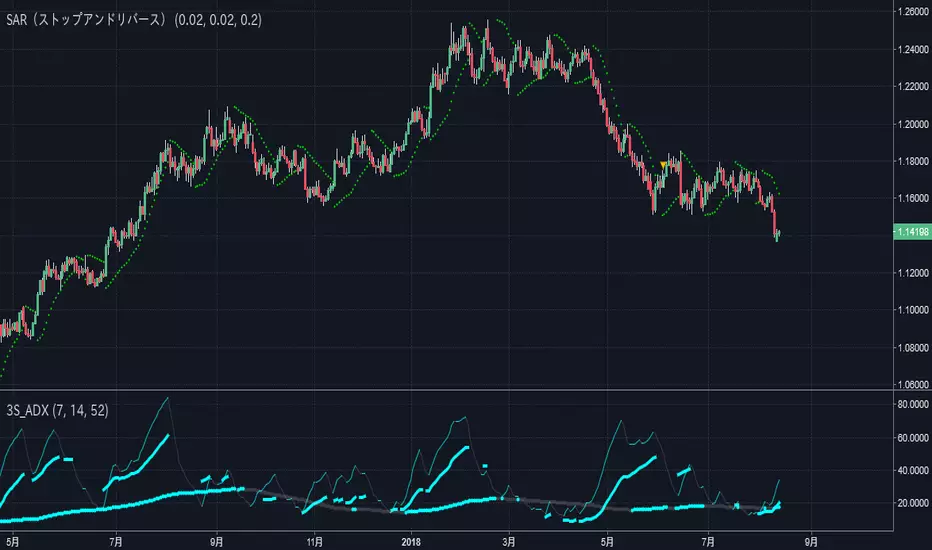
Triple Smoothed ADX==日本語説明も併記 // Japanese discription is following ==
■ Momentum index (Smoothed ADX triple display)
■ Effective assets: All
■Example of utilization
1) Trend generation is assumed at the timing when at least two lines including the blue thick line (14) are raised
2) Confirm the candlestick and if the price jumps out of the Bollinger band ± 1 σ, the trend toward that direction and recognition
3) If the closing price is confirmed within ± 1σ of the Bollinger band, close the position
■ Detailed explanation
Three Smoothed ADX with different parameters are displayed at the same time. As known as ADX included in DMI, it shows the strength of the trend.
It develops color in an upward phase to make it easy to recognize strengthening and weakening trends, and fades in a downward phase.
In addition, in accordance with the method of Wilder of the inventor in the calculation of ADX, a modified moving average (Smoothed Moving Average) is used instead of SMA.
Daily use is basic, but you can use it with the same parameters for other time feet.
The basic parameter (14) is set to a thick blue line for the most visibility.
Long-term parameters (52 * 26 is also acceptable) are indicated by blue circles as an auxiliary element for judging the rising margin of the basic line.
The short-term parameter (7) is displayed as a line as an auxiliary element for recognizing the peak out of the basic line in advance.
In some cases, changing the short term (7) to the very long term (100) allows you to recognize the major market price level once in several years.
Three periods The phrase "all lines" goes from "low position" to "rising together" is considered the strongest trend.
On the other hand, in the case where the short-term line rises backwards as the longer-term line goes down, it tends to end up with short-lived trends and failure to form trends.
Please note that there is no way to judge whether the trend suggested by this index rises or falls from this index, so it is necessary to confirm the main chart. (It is preferable to display parabolic SAR or Bollinger band)
■ Remarks
It is an index created assuming that it is used as Triple STD-ADX in combination with Triple Smoothed ADX(to be posted later).
■ About Triple STD-ADX
Triple Standard Deviation "and" Triple Smoothed ADX "are superimposed and displayed as" Screen (without scale) "to function as" Triple STD - ADX ".
The method of utilization is the same as Triple Standard Deviation and Triple Smoothed ADX, but by simultaneously displaying two momentum indicators with different calculation approaches with multiple parameters, we aim to mutually complement the cognitive power of trends.
STD (13, 26, 52, 100, 200) and ADX (7, 14, 26, 52, 100) correspond to reaction rates respectively.
By choosing different reaction rates you can expect to further increase reliability.
You can estimate the reliability of the trend most reliably in a situation where all six signals in total rise from low to high.
■Sample: STD-ADX Trade Signal
========================================================
モメンタム指標(Smoothed ADXの3連表示)
■ 有効アセット:すべて
■ 活用の一例
1)青の太線(14)を含む少なくとも2本のラインが上昇したタイミングでトレンド発生を想定
2)ローソク足を確認し、ボリンジャーバンド±1σの外に価格が飛び出している場合はその方向へのトレンドと認識
3)ボリンジャーバンド±1σ以内で終値が確定した場合にはポジションクローズ
■ 詳細説明
パラメーターの異なる3つのSmoothed ADXを同時に表示します。DMIに内包されるADXとして知られるように、トレンドの強度を示します。
トレンドの強化と弱化を認識しやすいように上昇局面で発色し、下降局面で退色します。
なお、ADXの計算において考案者ワイルダーの手法に倣い、SMAではなく修正移動平均(Smoothed Moving Average/ワイルダー移動平均)を使用しています。
活用は日足が基本ですが、他の時間足に対しても同一パラメーターで使用することができます。
基本パラメーター(14)は最も視認しやすいように青の太線にしています。
長期パラメーター(52※26も可)は基本線の上昇余力を判断するための補助要素として青色の丸点で表示しています。
短期パラメーター(7)は基本線のピークアウトを先行して認識するための補助要素としてラインで表示にしています。
場合によって、短期(7)を超長期(100)に変更することで数年に一度のレベルの大相場が認識できます。
3期間「全てのライン」が「低い位置」から「揃って上昇」する局面を最も強いトレンドと考えます。
一方、より長期のラインが低下する中、より短期のラインが逆行して上昇するケースでは、短命のトレンドやトレンド形成失敗に終わることが多くなります。
なお、本指標が示唆するトレンドが上昇か下降かは本指標からは判断する術はないため、必ずメインチャートを確認する必要があります。(パラボリックやボリンジャーバンドを表示すると好適)
■備考
先に掲載したTriple Standard Deviationと併用して、Triple STD-ADXとして使用することを想定して作成した指標です。
■Triple STD-ADXについて
「 Triple Standard Deviation 」と「Triple Smoothed ADX」を一方を「スクリーン(スケールなし)」として重ねて表示させることで「Triple STD-ADX」として機能します。
活用方法はTriple Standard DeviationやTriple Smoothed ADXと同じですが、算出アプローチの異なる2つのモメンタム指標を複数パラメーターで同時に表示させることで、トレンドの認識力を相互に補完する狙いがあります。
反応速度はそれぞれSTD(13,26,52,100,200)とADX(7,14,26,52,100)がほぼ対応します。
異なる反応速度を選択することで信頼度をさらに高めることを期待できます。
合計6本のシグナル全てが低い位置から揃って上昇する局面でトレンドの信頼性を最も高く見積もることができます。

[naoligo] Simple ADXI'm publishing this indicator just for study purposes, because the result is exactly the same as DMI without the smoothing factor. It is exactly the same as ADX Wilder from MT5.
I was looking for the algorithm all over and it was a pain to find the right formula, meaning: one that would match with the built-in ones. After several study and comparison, I still didn't find the algorithm that match with the MT5's built-in simple ADX ...
Enjoy!

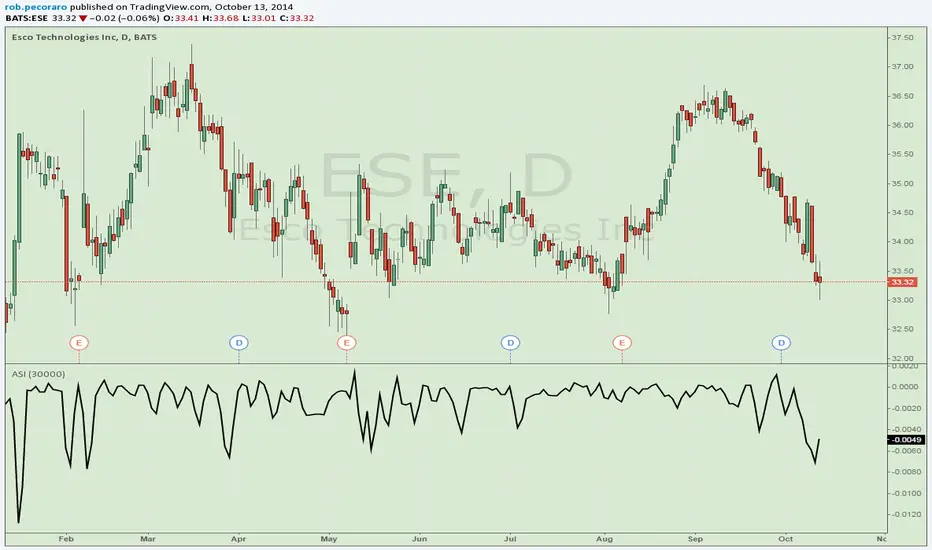
Accumulation Swing IndexPer Investopedia: The ASI is used to gage the long-term trend by comparing bars which contain its opening, closing, high and low prices throughout a period of time. It is a trend finding/confirming tool.