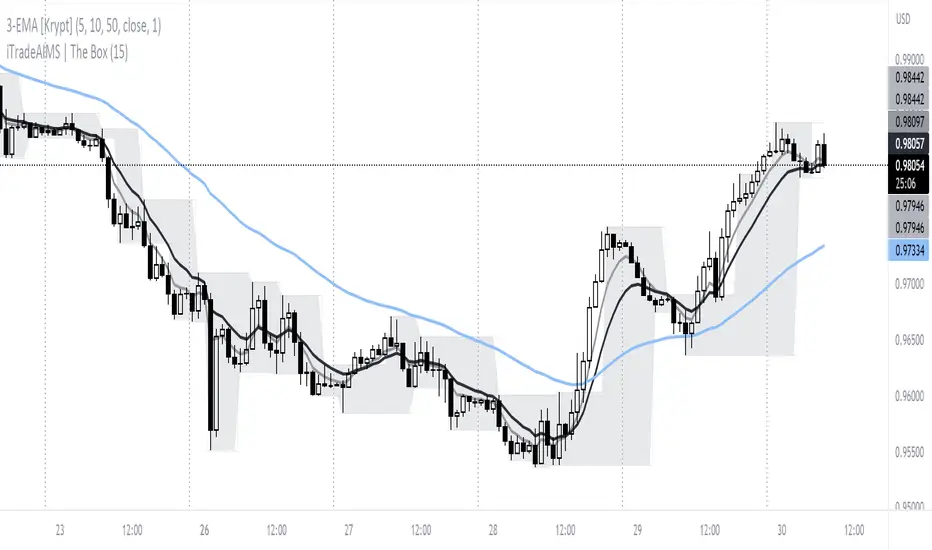
iTradeAIMS | The BOX IndicatorIntroduction to iTradeAIMS The Box Indicator
Here I will attempt to give a brief introduction to this amazing indicator that has revolutionised my trading since 2009.
Everything in the universe is energy and energy follows the path of least resistance. When it moves it heavily influenced by a structure.
When energy flows it reacts to the underlying structure. Electricity flows through copper wires easily compared to "my arm".
A river flows smoothly on flat plains of the land but becomes violent when flowing down a mountain. Why is this? Why does it change its behaviour?
The Science of Chaos Brings us here. Everything in the universe has an internal or underlying structure. That structure is often, but not always, hidden.
The Market has an underlying Unseen Structure. And it can be revealed by using this indicator. TSX:TSL
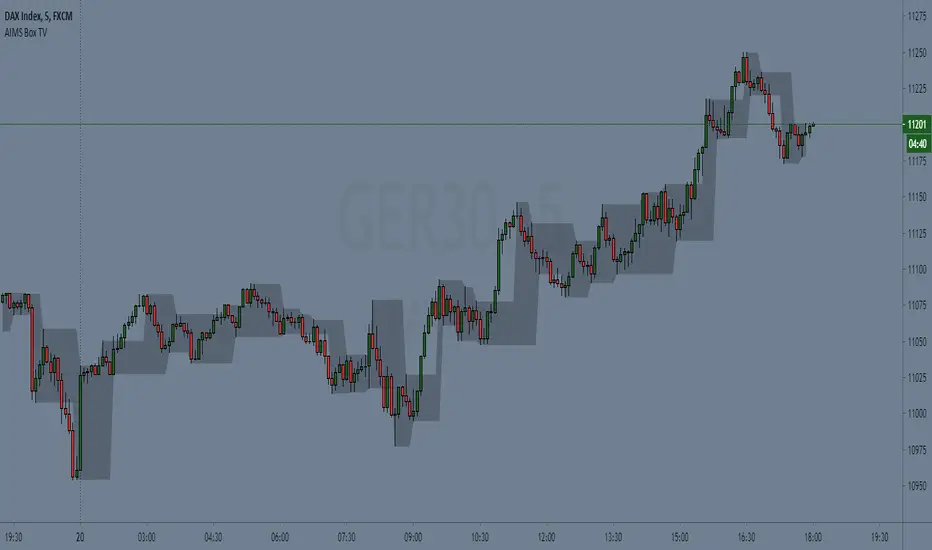
Anatomy of the Box
The iTradeAIMS Boxes are formed using the high and low of the fractals.
A new AIMS Box will be created whenever price makes a new high or low Fractal.
The bottom of the AIMS Box – the Lower AIMS Level - is created when a low Fractal is formed i.e. the low of a candle is lower than two candles to the left and two candles to the right.
What is the Underlying Structure of the Market?
The underlying structure of the Market is Elliott Wave .
And the Underlying Structure of the Elliott Wave is the Fractals.
This BOX is an indicator based on the Fractals.
The Upper and Lower Levels require a minimum of five bars with the top of the box being the upper Fractal; the bottom of the box, the lower Fractal
The AIMS Levels are the high and low of the AIMS Box – the upper and lower Fractals.
This indicator, by itself, provided the concept that revolutionised my trading.
What are the Benefits of Using AIMS iTradeAIMS The Box?
1. Identify Trend:
The Box will also help you identify Trending Markets.
The Stepping Up pattern it creases is an indication of UPTREND .
The Stepping Down pattern indicates DOWNTREND .
2. Identify Entry Points
The Box will help you identify Entry Points into the market.
There are two ways it helps you make entries into the market.
a) breakout entry
b) trend following entry
3. Identify Range-Bound Market
The Box helps identify a sideways range-bound market.
When the box is not creating either a stepping up or stepping down pattern, it usually indicates to a sideways or rangebound market on that time frame.
4. Help you Make Entries: Calculate Correct Positions Size and Risk Size
The BOX is the structure of the market that offers the best method of How to calculate Risk Per Trade based on the market generated information.
Calculate your Entry Level and Stop Loss level using the Box Levels on either side of the box.
Buying the Box:
Set a Buy Order a Point above the Box and Stop Loss a point below the Box Low.
Selling the Box
Set a Sell Order a Point Below the Box Low and Stop Loss a Point Above the Box High.
TSLA Entries and Exits for Tesla Stock
I took this trade on the box high of this stock OII
I shared the Idea on TradingView as a Buy Signal on OII
Check the BitCoin Entry Here
5. Stop Loss Trailing Mechanism to Lock in Profits
The box levels are used for Trailing Stops.
For Long (Buy) Orders use the box low as a stop loss level for trailing and locking-in profits.
For Shorts (Sell) Orders, use the Box High levels for trailing stop and lock in profits.
6. Support and Resistance
The Box Levels (upper and lower) clearly shows support and resistance – where price approached a level and could not go further, forcing it to retrace on itself.
Pay attention to how box levels create ranges and also indicate trends.
How to Use this Indicator with other Indicators?
This indicator is great on its own but even greater if used in conjunction with iTradeAIMS The Wave and The Gator and The Magic Purple (Script Available FREE to use on iTradeAIMS Profile)
> The market always creates an AIMS Box before it turns around.
> Every trend starts and ends with an AIMS Box.
> Entries are always taken on the breakout of the AIMS Box.
How to Get Access to This Script?
Enjoy and accept it as my gift to the TradingView Community from iTradeAIMS | This Indicator is now available to everyone for FREE.
Credits: I learned the method from Bill Williams of Profitunity.com All credits, thanks, gratitude, positive vibes, and prayers goes to Dr Williams 🥇 (RIP) and his family ❤.
Fractale de Williams
Confirmation candleConfirmation candle include 2 price action patterns to confirm reversal.
First one is clasic engulf.
Second one is 3 candles patter that shows failed auciton.
Patterns are confirmation for trend setups, not reversal.

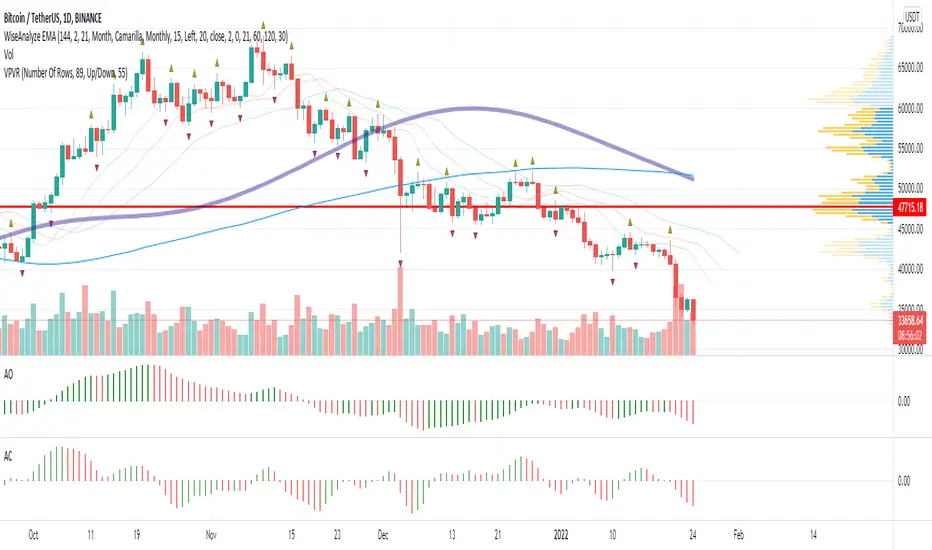
WiseAnalyze EMA + fractalsCombination of exponential moving averages allow to spot the trend reversal and expansion, Bill Williams fractals and support resistance zones allow to trade without drawing anything. Just follow the trend.
Study your chart. Note which EMA act as support and bounce most of tests. Most often I use 21/34 EMA for new entries.
Most powerful trend indicator is MAWV. Don't try to trade against it. If price above go long. If below - short.
Stops should be placed behind fractals. Breakout entries on price crossing fractals.
Obbar
in case you don’t know what fractal is fractal is a way of a trading by finding critical price levels those critical price levels formed every five candle The middle candle is the critical one, The high or low of this candle is considered support or resistant at the current moment.
The current implementation of fractals indicators across many platforms, tradingview one of them not that Great although it undefined the fractals however at least the hard bar for your brain to process you need to link these factors together to form a trend line , has no directions for the trend and for sure it doesn’t show you the trigger candle.
I have been working for the best three years in a new way to trade fractals A new ecosystem that has it all, support and resistance level showing the trend and also show you the trigger candle where are you can but your buy or sell order. and I call it Obbar.
Identifying the trade:
now let’s see how you can trade this indicator, first let’s identify the trend because you know trend is your friend, and since fractal does not tell you the trend, Will use OBV for this task by applying fractals concepts to OBV we can easily see in which level buyer or seller appeal, since that level is important we should also see a huge volume on those levels, and by applying this concepts we have three area bluish The green one where you should only look for buy signal, a bearish area the red one where you should only look for sell signal, indecision area the blue where are you should just ignore the market.
The trigger candle:
it’s yellow when it’s buying signal don’t forget the trend of course so if the trend is bluish and you have yellow candle The trigger candle will be buying candle.
it’s red when it’s a sell signal added to the trend you should only sell when the trend is bearish of course.
hope this indicator improve your fractal trading, have fun

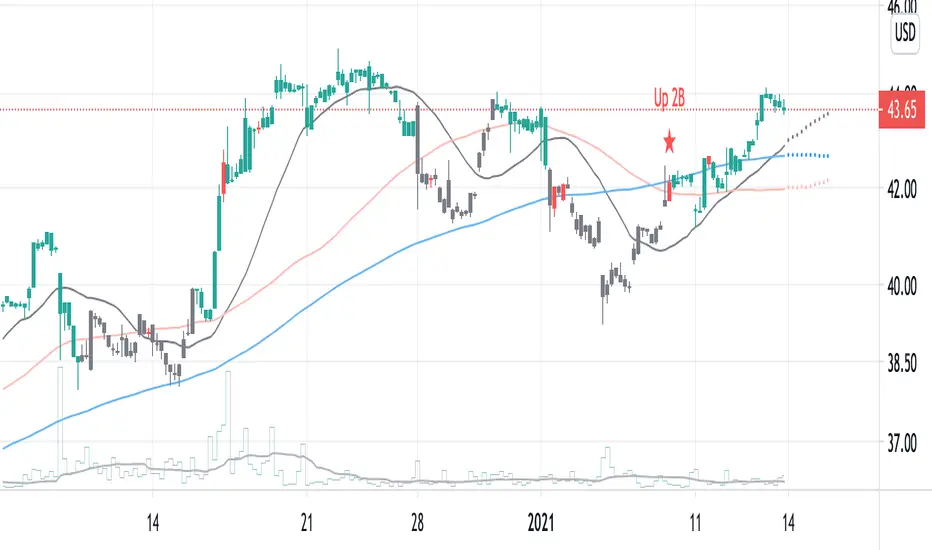
2B detector betaIdentifying a trend reversal is practically tricky, given that price movement is somewhat unpredictable and mostly obeys a power law. In which the price difference is primarily out of normal distribution. According to Benoit Mandelbrot, the price distribution follows an alpha-stable distribution with α equal to 1.7.
Real data observation suggests that stock prices do not follow the Random Walk Hypothesis or Brownian motion. Instead, they follow a fractal pattern. Fractals exhibit similar patterns at different scales called self-similarity. Using this character, one can develop fractal patterns to identify local highs and local lows.
This indicator identifies the reversal signal so-called 2B base on the following logic:
1. Identify local highs and local lows with fractals
2. Define relative positions of those local highs and lows (ABC and 2B)
3. Define the local range of ABC and B
Disclaimer: This indicator is only for research purposes. Please do not take it as investing or trading advice.
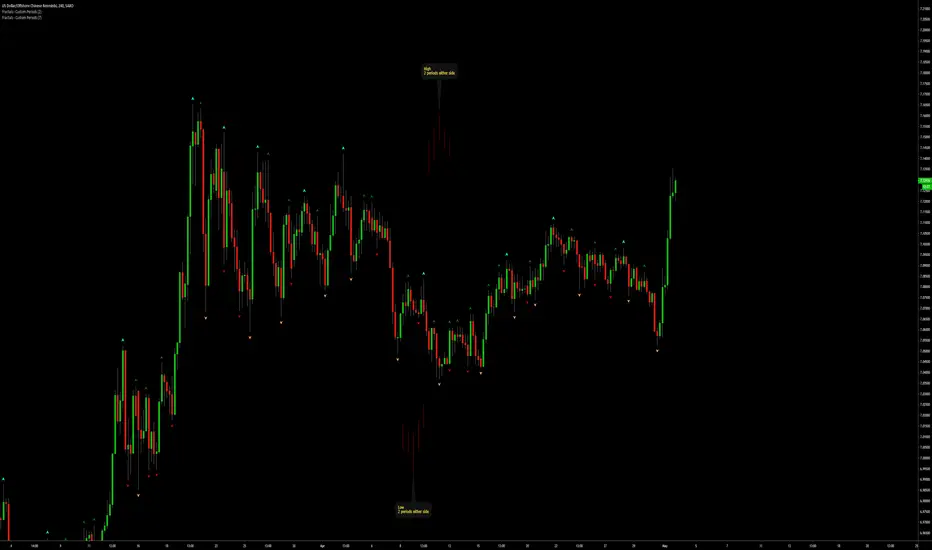
Fractals (Expo)
Fractals (Expo) make use of fractals to identify trends and reversals. The indicator is designed to adapt smoothly and quickly to significant price moves in order to identify trend reversals as well as filtering out noise in an established trend. The indicator is simple to use and understand therefore valuable to all trading styles.
The user has the ability to enable a custom input source which gives the user great flexibility and full control over what the calculations should be based on. The default input source is fractals from the swing points of the market.
Real-Time Trend Alerts
No Repainting
Works on any market and in any timeframe
HOW TO USE
Use the indicator to gain insights into trends and trend reversals.
Identify Trends
Identify Trend reversals
Use it as a Trend filter
INDICATOR IN ACTION
Daily Chart
I hope you find this indicator useful , and please comment or contact me if you like the script or have any questions/suggestions for future improvements. Thanks!
I will continually work on this indicator, so please share your experience and feedback as it will enable me to make even better improvements. Thanks to everyone that has already contacted me regarding my scripts. Your feedback is valuable for future developments!
-----------------
Disclaimer
Copyright by Zeiierman.
The information contained in my scripts/indicators/ideas does not constitute financial advice or a solicitation to buy or sell any securities of any type. I will not accept liability for any loss or damage, including without limitation any loss of profit, which may arise directly or indirectly from the use of or reliance on such information.
All investments involve risk, and the past performance of a security, industry, sector, market, financial product, trading strategy, or individual’s trading does not guarantee future results or returns. Investors are fully responsible for any investment decisions they make. Such decisions should be based solely on an evaluation of their financial circumstances, investment objectives, risk tolerance, and liquidity needs.
My scripts/indicators/strategies/ideas are only for educational purposes!
ACCESS THE INDICATOR
• Contact me on TradingView or use the links below

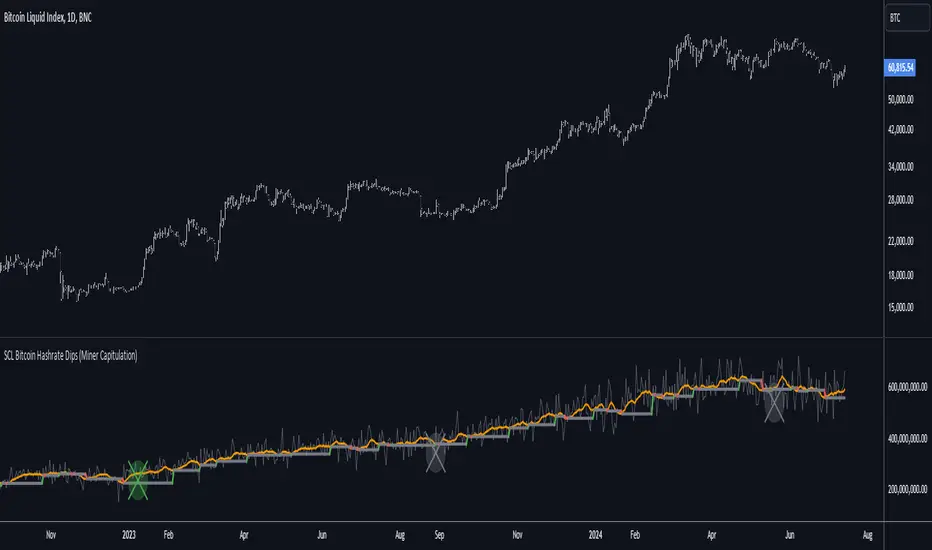
[SCL] Bitcoin Hashrate Dips (Miner Capitulation)Gives long-term buy signals for Bitcoin from dips and recoveries in the hashrate (the "miner capitulation" theory). It has an overlay and a standalone mode and is fully configurable. It uses Williams Lows and ATR instead of moving averages.
Features that might be interesting for Pinescripters:
+ Automatic (as far as is possible currently) adjustment of plots for overlay and standalone display modes.
+ A neat label function for debugging floats
+ Fully commented
+ The debug that I used to overcome problems in developing it is left in
+ Ideas for how to deal with a wildly oscillating and exponentially increasing data source
You need to run this indicator on the Bitcoin daily chart for it to make any sense. The best is a BTC/USD chart with a long history, such as BNC:BLX.
Trend LineBasic Trend Line base on fractals (v0.1)
Can not draw a line on the future X axis, So just a line segment but not a ray.
I don't have a better idea to upgrade...

Williams Fractals with Alerts by MrTuanDoanCustom William Fractals for alerts and educational purpose.
Added custom alerts for Williams Fractals.
Also added filter to show less fractals on chart.
The simple idea how I use fractals in Binary Option is to determine temporary resistance and support.
Simple strategy:
- Mark Resistance/Support on higher time frame (e.g. 5M)
- Set an alert for new fractal
- Whenever a new fractal that appears close to your marked Resistance/Support, go to lower time frame (e.g. 1M)
- Wait for rejection at the level that lower than new down fractal (or higher than new up fractal).
- Enter with the same expiry of lower time frame.
Good luck and happy trading. :-)

Williams Fractals, A simpler scriptA simpler script to filter fractals and support large range parameter.

Deep_Fractal_Signals_and_Rubber_Band_TradesThis indicator is based on Williams Fractals and the TopDog Trading "Rubber Band Trade"
The Deep Fractal Signals are triangles that indicate the price is forming a pattern of decreasing lows in a down trend (orange) or, increasing highs in an up trend (green).
The triangles are placed above or below the last bar of the pattern, unlike Fractals which are drawn 2 candles prior to the current candle, and are re-painted on the chart.
When the triangle is indicated above the moving average in a down trend (blue), or below the moving average in an up trend (yellow), this is a Rubber Band Trade.
When the slope of the moving average is less than the Gain set by the user, or are counter-trend, the triangles are plotted in silver.
When used in conjunction with the Power Analyzer indicator, a signal to the long side should be taken when the Power Analyzer momentum indicator is at a cycle low. Similarly, a signal to the short side should be taken when the indicator is at a cycle high.
The first, second or third signal in a new trend have the highest probability of a follow through.
The indicator sometimes gives a false signal at the very end of the trend, just before the market reverses. This is an attempt by the Market Makers to persuade traders that the trend will continue.
Please leave a comment and "Like" this indicator if you find it useful.
FX Engineering

MarketStructureBreakThe Script is called a MSB/MarketStructureBreak
This script is meant to teach you on how the 2 candles are responsible for the breakout and shows you patience
The best way to use this indicator is by putting the "SMA 50 SMA 200" settings helps filter out the false calls
As well, if you use this in a bigger time frame like 1 HOUR, 4 HOUR, Daily, and Weekly it will call the best buy and sell Signals

DarvasBox Breakout [@TradersVenue]I have decided that, its time to give back something to trading community so that channel/group members benefit from it. As usual, its without any commercial interests and hence published it publicly for free (without source code because its my own effort and don't want to share the source code to all).
This is complete non-repaint version of my #DarvasBox trading strategy. For best results keep the default settings. Dont keep the Will not be able to share the code. I have done back testing till 1990 and results are fantastic. Strategy works well with 25/75/125+ time frame. I have majorly tested it in #Nifty and #BankNifty. You may test it with other scripts and trade if you want.

Price Action ScalperThis strategy is H1 timeframe only. No indicators used. No volumes, just price action. The trend is determined by a candlestick pattern, entry points are fractals.
Takeprofit is ATR(14), stoploss is 3*ATR(14) (yess, bad maths, we can discuss if you want) but you can use only entries and close when you want.
This is my second script here, so I didn't tested for kinda repainting. If you see repainting, please write in comments, I will try to fix it.

Fractal SL OverlayThis Fractal Stop-Loss Overlay sets a trailing fractal top and bottom to help identify the support and resistances for the current candle.
Use the link below to obtain access to this indicator

AIMS Box TV [ Trade in line with the Structure of the Market] Introduction to AIMS Box
The Market has an underlying Unseen Structure that can be revealed by using this indicator.
The underlying structure of the Market is Elliott Wave. And the Underlying Structure of Elliott Wave is the Fractals. This BOX is based on the Fractals.
The AIMS Box is created using the fractals. The Upper and Lower Levels require a minimum of five bars with the top of the box being the upper Fractal; the bottom of the box, the lower Fractal
The AIMS Levels are the high and low of the AIMS Box – the upper and lower Fractals.
This indicator, by itself, provided the concept that revolutionised my trading.
AIMS Box can be used for
1. Calculating Risk Per Trade
2. To Find the Trend of the Market i.e. Stepping Up is Uptrend and Stepping Down is Down Trend.
3. The box lower levels are used for Trailing Stops for Buy Orders and Box High levels are used for Trailing Stop for Sell Trades.
Anatomy of the AIMS Box and the AIMS Levels
As mentioned earlier, the AIMS Boxes are formed using high and low Fractals. A new AIMS Box will be created whenever price makes a new high or low Fractal.
The bottom of the AIMS Box – the Lower AIMS Level - is created when a low Fractal is formed i.e. the low of a candle is lower than two candles to the left and two candles to the right.
The AIMS Level clearly shows support and resistance – where price approached a level and could not go further, forcing it to retrace on itself.
Pending Sell Order is set 1 pip below the lower AIMS Level (provided it’s a correct Setup).
The top of the AIMS Box – the Upper AIMS Level - is created when a high Fractal is formed i.e. the high of a candle is higher than two candles to the left and two candles to the right.
Pending Buy Order is set 1 pip + spread above the AIMS Box (provided it’s a correct Setup).
Benefits of this Indicator:
Objective information generated by the AIMS Box and its Levels
Crystal clear entry levels.
Stop-loss levels – clear support and resistance levels.
Money management information.
Position/lot size information.
Trailing stop-loss mechanism.
AIMS Box also generates the following additional information about the market:
The market always creates an AIMS Box before it turns around.
Every trend starts and ends with an AIMS Level.
Entries are always taken on the breakout of the AIMS Box.
We don’t take entries inside the AIMS Box on the timeframe that produced the Setup.
When price is inside the grey shaded zone, it is inside the AIMS Box; it is within the AIMS
How to Get Access to This Script?
Contact me using the link below to gain access.
Fractals | Swing Points | Highs & Lows | Custom PeriodsSimple script which marks out key swing highs & lows.
One of the only indicators I have on the chart most days
- perfect for naked charting
- quickly helps you to visually identify key areas of interest
An extension of Bill Williams fractals
- aka short term swing points
Allows you to filter for only the most prominent swing points
- you can even overlay multiple swingpoint filters in different colours (as per example chart)
The number (Fractal Periods) is simply:
- the number of less prominent points either side of your swing high/low
- example shown on the chart
Otherwise make a fist
- look at your 5 knuckles
- swing high is your middle knuckle
- 2 lower points either side
Bill Williams Original Fractal:
Fractal Periods = 2
Your Fractal Period for Filtering:
3, 4, 5, 30, 365, etc
Simple, easy, shared to enjoy =)
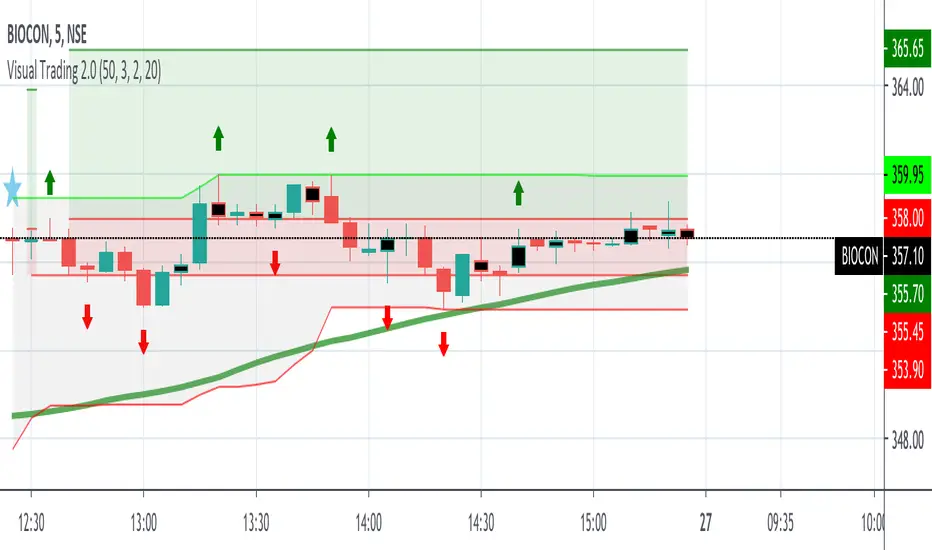
VT SMA 50 DC with FractalsBuying or Selling levels are identified with SMA 50 along with Fractals for breakouts and reversals.
SMA will be green when the trend is Bullish
SMA will be red when the trend is Bearish
The color is set GREEN and RED for Bullish and Bearish trend
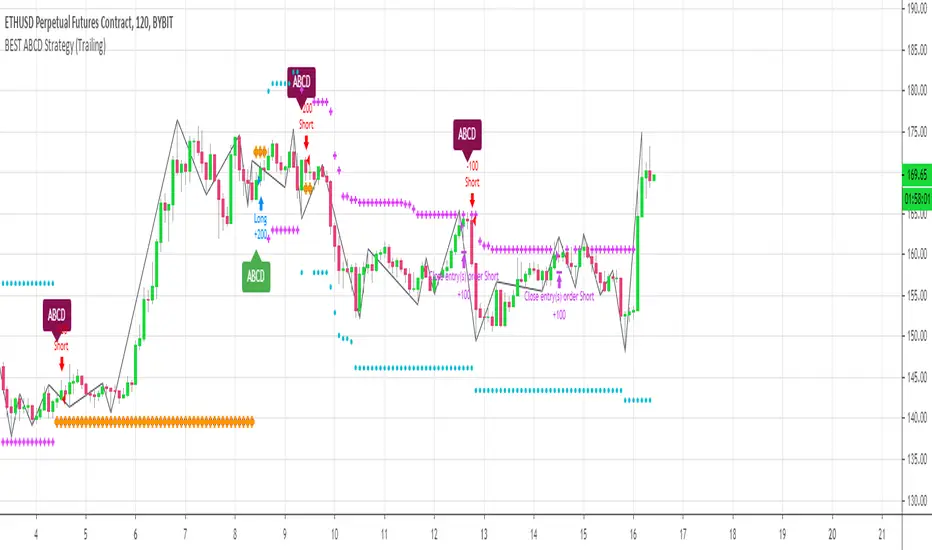
[Daveatt] BEST ABCD Pattern Strategy (Trailing SL + TP)Hello traders
This is the strategy version of my ABCD pattern. I added the Trailing Stop and Trailing Profit upon a follower request
I - Concept
I present to you, ladies and gentlemen, the first screener for harmonic patterns .
Starting with an ACBD pattern screener this time!!
I used the calculations from Ricardo Santo's script
In short, he's using fractals (regular or Bill Williams ) for the pattern calculations. A masterpiece !!!
II - Definitions
The ABCD pattern ( AB=CD ) is one of the classic chart patterns which is repeated over and over again.
The ABCD pattern shows perfect harmony between price and time.
The Williams Fractal is an indicator, developed by Bill Williams , that aims to detect reversal points (highs and lows) and marks them with arrows.
Up fractals and down fractals have specific shapes. The Williams Fractal indicator helps users determine in which direction price will develop
💎Strategy filters💎
I included some cool backtest filters:
- Trailing stop with trigger concept coming from this Trailing Stop Strategy
- Trailing profit with trigger coming from this Trailing Profit Strategy
Last words
It works for all asset classes (Forex, crypto, indices, etc...) and does not repaint
All the BEST
Dave
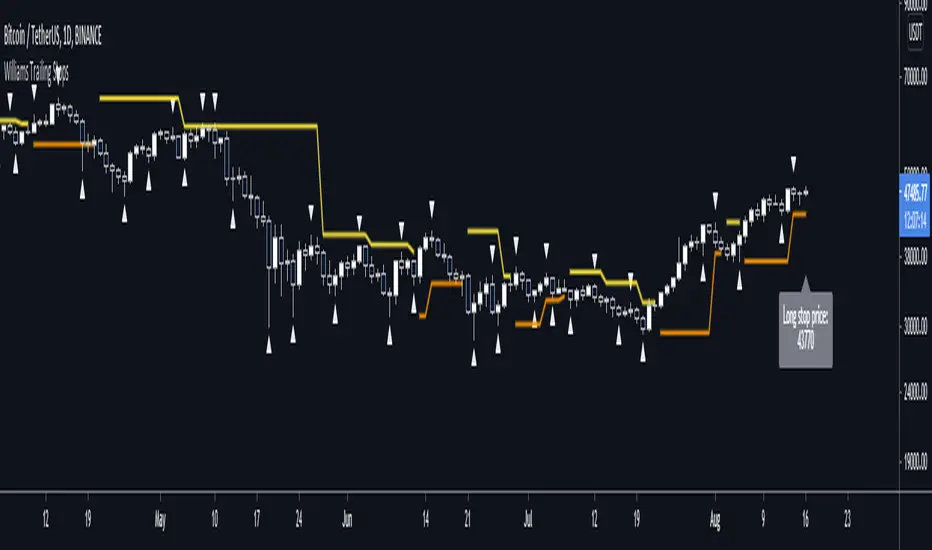
Williams Fractal Trailing StopsUnlike the built-in version, you can configure how many bars it takes to confirm a fractal. This indicator plots all Williams high and low fractals, and a stop line that trails the fractals up and down. Includes long and short stop alerts. You can choose whether the trail flips long-short based on the price being exceeded within a candle or on candle close. This indicator deals only with fractals and doesn't get into the Alligator or anything else.
I've commented it extensively, so that it might be useful for people learning Pinescript. Enjoy!


BEST ABCD Pattern StrategyHello traders
This is the strategy version of this script
I - Concept
I present to you, ladies and gentlemen, the first screener for harmonic patterns.
Starting with an ACBD pattern screener this time!!
I used the calculations from Ricardo Santo's script
In short, he's using fractals (regular or Bill Williams ) for the pattern calculations. A masterpiece !!!
II - Definitions
The ABCD pattern ( AB=CD ) is one of the classic chart patterns which is repeated over and over again.
The ABCD pattern shows perfect harmony between price and time.
The Williams Fractal is an indicator, developed by Bill Williams, that aims to detect reversal points (highs and lows) and marks them with arrows.
Up fractals and down fractals have specific shapes. The Williams Fractal indicator helps users determine in which direction price will develop
💎Strategy filters💎
I included some cool backtest filters:
- flexible take profit in USD value (plotted in blue)
- flexible stop loss in USD value (plotted in red)
The take profit and stop loss should work with Forex/FX pairs as well
All the BEST
Dave
