ADX ColorO ADX avalia tendências de alta e baixa, buscando mostrar um movimento direcional.
O indicador é composto por três linhas: DI+, DI- e ADX;
Onde o ADX representa o índice das médias do movimento direcional.
O DI+ ocorre quando o valor do preço máximo do candle for maior que o do candle anterior, assim, temos um movimento direcional positivo.
DI+ = Máx(c) – Máx(c – 1)
E o DI- representa o movimento direcional negativo, ele ocorre quando a mínima do candle for menor que a mínima do candle anterior.
DI- = Mín(c) – Mín(c-1)
Dessa forma, se o ADX e o DI- estiverem acima do DI+ e com ADX subindo acima de 25, será o melhor momento para estar vendido, e que a tendência de baixa é forte.
E quando as médias ficam se cruzando entre si, significará que o ativo pode apenas estar em congestão, ou seja sem tendência.
ADX

ADX and DI With Coloured Histogram BUY/SELLWe display here the ADX has a colored histogram, which is
- green when ADX and DI+ are higher then DI-, while the ADX is increasing, meaning that we are in a potential uptrend--> we should rather be long (only buy if you have other concordant signals !)
- red when ADX and DI- are higher then DI+, while the ADX is increasing, meaning that we are in a potential downtrend --> we should rather be short (only sell if you have other concordant signals !)
- not visible if none of these conditions are met, meaning that the indicator do not show a potential trend --> don't use this indicator to buy or sell at this stage

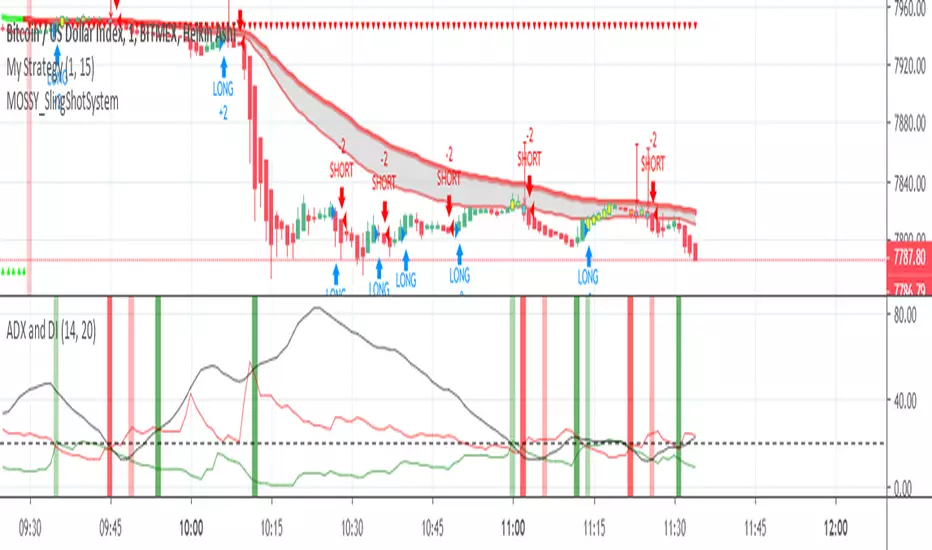
Mossy ADX and DI with Buy/Sell SignalsBasic ADX DI with colored bars to show buy and sell signals , made for 1min but shows general signals of strong or weak buy and sell signals.
Dark Red = Heavy Signal
Light Red = weak signal
Green = buy signal
Dark Green = Heavy Signal
Colors are to confirm or warn, Buy/Sell points are where to enter and exit.
Mossy ADX DI colored bars for quick scalping, works best with Heikin Ashi, confirm with other indicators, Mossy Pop is one shown and works well to confirm.


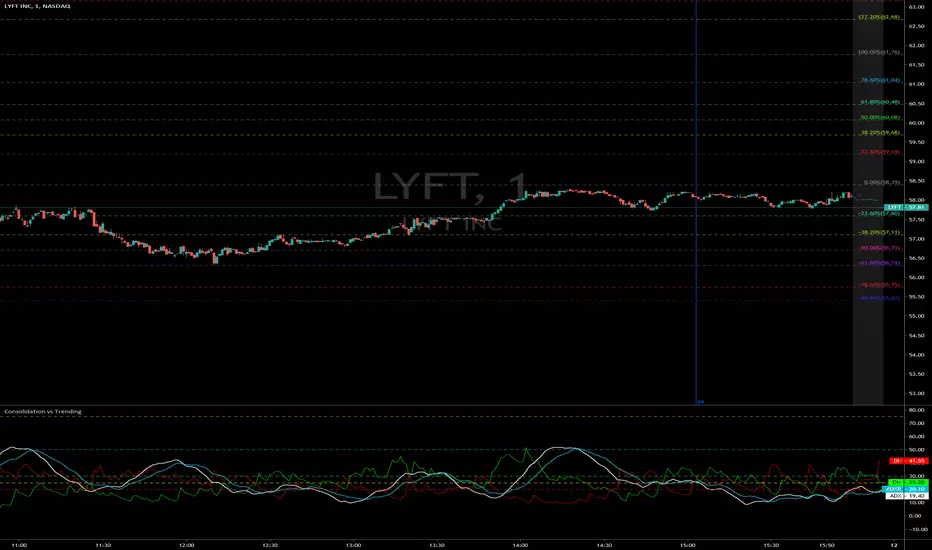
Consolidation vs Trending
ADX is used to quantify trend strength. ADX calculations are based on a moving average of price range expansion over a given period of time. The default setting is 14 bars, although other time periods can be used. ADX can be used on any trading vehicle such as stocks, mutual funds, exchange-traded funds and futures.
ADX is plotted as a single line with values ranging from a low of zero to a high of 100. ADX is non-directional; it registers trend strength whether price is trending up or down. The indicator is usually plotted in the same window as the two directional movement indicator (DMI) lines, from which ADX is derived.
When the +DMI is above the -DMI, prices are moving up, and ADX measures the strength of the uptrend. When the -DMI is above the +DMI, prices are moving down, and ADX measures the strength of the downtrend.
ADX values help traders identify the strongest and most profitable trends to trade. The values are also important for distinguishing between trending and non-trending conditions. Many traders will use ADX readings above 25 to suggest that the trend is strong enough for trend-trading strategies. Conversely, when ADX is below 25, many will avoid trend-trading strategies.
ADX Value Trend Strength
0-25 Absent or Weak Trend
25-50 Strong Trend
50-75 Very Strong Trend
75-100 Extremely Strong Trend
Mossy ADX and DIBasic ADX DI with colored bars to show buy and sell signals , made for 1min but shows general signals of strong or weak buy and sell signals.
Dark Red = Heavy Signal
Light Red = weak signal
green = buy signal
Hashharvest - ADX Indicator v1This is an ADX indicator with a kick. Also shows DM+ and DM-. Allows you to turn off these indicators. This also has horizontal indicators that tell with the trend maybe trendless (20), gaining (25), and trending (30). These indicators can change to accommodate your trading.

RePaNoCHa [Alerts]Script for automatic trading with Alerts (Use Backtest to customize your own settings)
All timeframes but good results on 2H.
LG --> Long
ST --> Short
TS --> Trailing Stop
xL --> Close Long Position
xS --> Close Short Position
SL --> Stop Loss
The trailing stop closes the trade if the price changes direction by a specified percentage or offset. There is no ideal distance because markets and price are always changing and we know that is impossible to exit on the top or bottom. This script interpolate the trailing Stop Offset with profit, higher profit -- > higher Trailing Stop Offset. Despite this, it's difficult to catch the price. If someone comes up with a good idea, comment, I'm happy to learn.
No security() function so no repaint but has time() and can appear a warning for it.
Alerts:
'Once per bar' More profit but not confirmed alerts (10-20% fake alerts)... I like risk
'Once per bar close' Confirmed alerts (0% fake alerts)... You will sleep better
Some settings:
XBTUSD (BITMEX)
Timeframe = 2H
Position Side = BOTH
Source = hlc3
T3 Length = 5
T3 Volume Factor = 0.9
Sampling Period = 16
Range Multiplier = 1.3
ADX lenght = 10
ADX Threshold = 20
SAR start = 0.07
SAR inc = 0.02
SAR max = 0.15
Pyramiding = 10
Trailing Stop Activation % = 0.5
Trailing Stop Offset % (when profit=0.5 %) = 0.35
Trailing Stop Offset % (when profit=10 %) = 1.5
Stop Loss = 3.5
Tics/Pips Correction = 10
Initial Capital = 1000
Quantity = 100 %
Commission value = 0.075 %
ETHUSD (BITMEX)
Timeframe = 2H
Position Side = BOTH
Source = hlc3
T3 Length = 5
T3 Volume Factor = 0.7
Sampling Period = 13
Range Multiplier = 0.9
ADX lenght = 11
ADX Threshold = 19
SAR start = 0.06
SAR inc = 0.03
SAR max = 0.15
Pyramiding = 10
Trailing Stop Activation % = 0.5
Trailing Stop Offset % (when profit=0.5 %) = 0.35
Trailing Stop Offset % (when profit=10 %) = 1.5
Stop Loss = 4
Tics/Pips Correction = 100
Initial Capital = 1000
Quantity = 100 %
Commission value = 0.075 %
BNBUSDT (BINANCE)
Timeframe = 2H
Position Side = LONG
Source = hlc3
T3 Length = 3
T3 Volume Factor = 1.6
Sampling Period = 17
Range Multiplier = 1.3
ADX lenght = 5
ADX Threshold = 18
SAR start = 0.04
SAR inc = 0.03
SAR max = 0.25
Pyramiding = 10
Trailing Stop Activation % = 0.5
Trailing Stop Offset % (when profit=0.5 %) = 0.4
Trailing Stop Offset % (when profit=10 %) = 1.5
Stop Loss == false
Tics/Pips Correction = 10000
Initial Capital = 1000
Quantity = 100 %
Commission value = 0.075 %
LTCUSDT (BINANCE)
Timeframe = 2H
Position Side = LONG
Source = hlc3
T3 Length = 3
T3 Volume Factor = 1.6
Sampling Period = 11
Range Multiplier = 1.1
ADX lenght = 6
ADX Threshold = 22
SAR start = 0.07
SAR inc = 0.04
SAR max = 0.15
Pyramiding = 10
Trailing Stop Activation % = 0.5
Trailing Stop Offset % (when profit=0.5 %) = 0.4
Trailing Stop Offset % (when profit=10 %) = 1.5
Stop Loss == false
Tics/Pips Correction = 100
Initial Capital = 1000
Quantity = 100 %
Commission value = 0.075 %
TRXUSDT (BINANCE)
Timeframe = 2H
Position Side = LONG
Source = hlc3
T3 Length = 3
T3 Volume Factor = 0.9
Sampling Period = 8
Range Multiplier = 1.2
ADX lenght = 4
ADX Threshold = 22
SAR start = 0.07
SAR inc = 0.04
SAR max = 0.15
Pyramiding = 10
Trailing Stop Activation % = 0.5
Trailing Stop Offset % (when profit=0.5 %) = 0.4
Trailing Stop Offset % (when profit=10 %) = 1.5
Stop Loss == false
Tics/Pips Correction = 100000
Initial Capital = 1000
Quantity = 100 %
Commission value = 0.075 %
NAS100 (OANDA)
Timeframe = 2H
Position Side = BOTH
Source = hlc3
T3 Length = 3
T3 Volume Factor = 1
Sampling Period = 12
Range Multiplier = 1.3
ADX lenght = 18
ADX Threshold = 21
SAR start = 0.08
SAR inc = 0.06
SAR max = 0.25
Pyramiding = 10
Trailing Stop Activation % = 0.2
Trailing Stop Offset % (when profit=0.5 %) = 0.15
Trailing Stop Offset % (when profit=10 %) = 1
Stop Loss = 1.8
Tics/Pips Correction = 10
Initial Capital = 1000
Quantity = 3 contracts
Commission value = 0.2 USD per contract
NATGAS(OANDA)
Timeframe = 2H
Position Side = BOTH
Source = hlc3
T3 Length = 3
T3 Volume Factor = 1
Sampling Period = 18
Range Multiplier = 1.1
ADX lenght = 10
ADX Threshold = 17
SAR start = 0.1
SAR inc = 0.04
SAR max = 0.35
Pyramiding = 10
Trailing Stop Activation % = 0.2
Trailing Stop Offset % (when profit=0.5 %) = 0.15
Trailing Stop Offset % (when profit=10 %) = 1
Stop Loss = 1.6
Tics/Pips Correction = 1000
Initial Capital = 1000
Quantity = 4500 contracts
Commission value = 0.002 USD per contract
SPX500 (OANDA)
Timeframe = 2H
Position Side = BOTH
Source = hlc3
T3 Length = 3
T3 Volume Factor = 0.6
Sampling Period = 14
Range Multiplier = 1.3
ADX lenght = 12
ADX Threshold = 17
SAR start = 0.23
SAR inc = 0.05
SAR max = 0.2
Pyramiding = 10
Trailing Stop Activation % = 0.15
Trailing Stop Offset % (when profit=0.5 %) = 0.1
Trailing Stop Offset % (when profit=10 %) = 0.75
Stop Loss = 1.5
Tics/Pips Correction = 10
Initial Capital = 1000
Quantity = 8 contracts
Commission value = 0.2 USD per contract
US30 (OANDA)
Timeframe = 2H
Position Side = BOTH
Source = hlc3
T3 Length = 4
T3 Volume Factor = 0.9
Sampling Period = 11
Range Multiplier = 1.1
ADX lenght = 16
ADX Threshold = 24
SAR start = 0.08
SAR inc = 0.03
SAR max = 0.05
Pyramiding = 10
Trailing Stop Activation % = 0.15
Trailing Stop Offset % (when profit=0.5 %) = 0.1
Trailing Stop Offset % (when profit=10 %) = 0.75
Stop Loss = 1.5
Tics/Pips Correction = 10
Initial Capital = 1000
Quantity = 1 contracts
Commission value = 1.5 USD per contract
WHEAT (OANDA)
Timeframe = 2H
Position Side = BOTH
Source = hlc3
T3 Length = 3
T3 Volume Factor = 1.1
Sampling Period = 12
Range Multiplier = 1
ADX lenght = 13
ADX Threshold = 21
SAR start = 0.07
SAR inc = 0.05
SAR max = 0.15
Pyramiding = 10
Trailing Stop Activation % = 0.2
Trailing Stop Offset % (when profit=0.5 %) = 0.15
Trailing Stop Offset % (when profit=10 %) = 1
Stop Loss = 2.5
Tics/Pips Correction = 1000
Initial Capital = 1000
Quantity = 2500 contracts
Commission value = 0.003 USD per contract

DMI ADXThis is the combination of ADX and DMI.
It will tell you about the trend strength.
In easy language Green is for bullish , red is for bearish ,and third line which is of blue and yellow will tell you about the trend strength doesn't matter in which direction. Blue will tell you that trend is getting strength and vice versa for yellow.
Keep an eye at crossovers.
New scripts r ready just doing some last testing will be out soon just wait for some more time :)
all the Scripts here will be free and always will be.
For my Indian friends a special surpriszzz is coming soon ;)
Hope you got my point.
Happy trading :)
15min Chart
1Hr chart

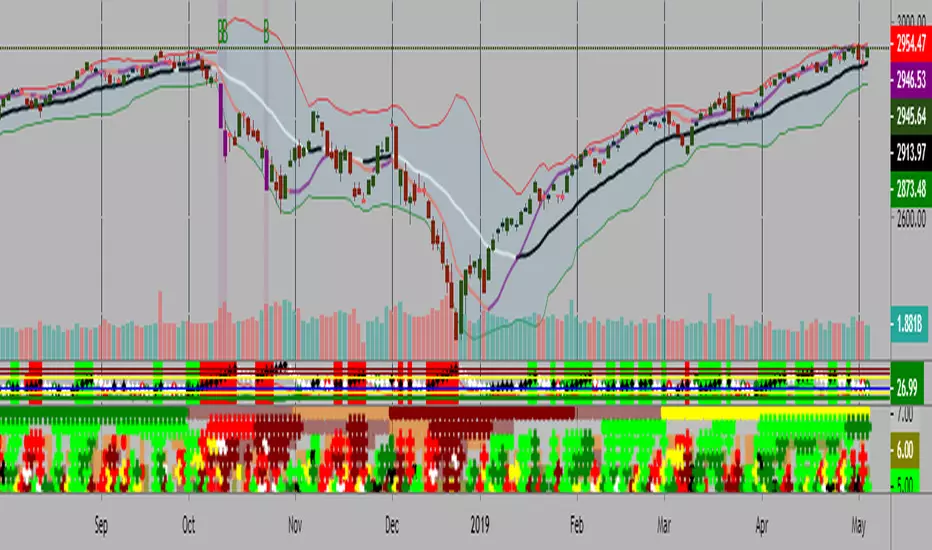
Kal’s MTF ADX Rangoli RollerKaly MTF ADX Rangoli Roller is a method/study for finding trending stocks, indexes and cryptocurrencies using two different data periods (10, 5) of ADX Overlap over different time-frames (10m, 1H, 4H, 1D, 1W, 1M). In the study, I used 5-Period ADX for all mentioned time-frames. You may use 10-Period ADX for lower time-frames especially 10m and 1H.
Sample Image of the pinescript code(at the end of this post) in Tradingview looks as follows:
Note: Kal's MTF ADX Rangoli Roller is the lower Plot. The upper plot is KAL’s ADX Overlap Technical Study with MACD Filter( )
Description:
----------------
In the study plot, the lowest row is 10m, row above is 1H, row above is 4H, then 1D, then 1W and highest row is 1M
Lime(Bright Green) dot implies Trending Uptrend for that time-frame (first phase)
Green dot implies Trending Uptrend for that time-frame (second phase near exhaustion)
Red dot implies Trending Downward for that time-frame (first phase)
Maroon dot implies Trending Downward for that time-frame (second phase near exhaustion)
Lime cross implies Strong Trending Uptrend for that time-frame (first phase)
Green cross implies Strong Trending Uptrend for that time-frame (second phase near exhaustion)
Red cross implies Trending Strong Downward for that time-frame (first phase)
Maroon cross implies Trending Strong Downward for that time-frame (second phase near exhaustion)
Yellow is ‘Squeeze On’ setting. During the squeeze period, the ADX signals are almost always ineffective. One may wait and watch over during this time. Once the Squeeze is released (i.e. no longer yellow), the trend corresponds to the color of the dots and crosses.
Black is CRSI Overbought condition for that time-frame. It’s best to wait and research for possibility of trend reversal because
1. Profit-booking/trimming happens after CRSI Overbought condition.
2. Large Short-sellers may take huge positions during this time pushing the stock prices up.
White is CRSI Oversold condition for that time-frame. It’s best to wait and research for possibility of trend reversal because
1. Profit-booking/trimming happens after CRSI Oversold conditions.
2. Large buyers may take huge positions during this time pushing the stock prices down.
I am a disabled man. Therefore, I am not able to write in detail here today. More Details will follow as time permits. Please let me know if I am missing anything…
Legal Disclaimer: I published here so I get replies from fellow viewers to educate myself and for my daily expenses. Hence, if anyone uses this script for making their decisions, I am not responsible for any failures incurred.
Safe Trading!
Kal Gandikota
PS: If you found this script interesting and edifying please follow and upvote.
PS2: Please kindly donate for my daily expenses (atleast as you would on streets) at the following addresses:
BTC Wallet: 1NeDC1GvpFa49DFLuT1v28ohFjqtoWXNQ5
ETH Wallet: 0x35e557F39A998e7d35dD27c6720C3553e1c65053
NEO Wallet: AUdiNJDW7boeUyYYNhX86p2T8eWwuELSGr
PS3: For more information on ADX and CRSI, please 'Google' or search here yourself.
PS4: This study is intended for research in creating automated Python Trading Systems using Pandas( steemit.com ).
Screenshots of the pinescript code looks as follows:
10minute Screenshot of Kal's MTF ADX Rangoli Roller (Above)
1 Hour Screenshot of Kal's MTF ADX Rangoli Roller (Above)
4 Hour Screenshot of Kal's MTF ADX Rangoli Roller (Above)
1 Day Screenshot of Kal's MTF ADX Rangoli Roller (Above)
1 Week Screenshot of Kal's MTF ADX Rangoli Roller (Above)
1 Month Screenshot of Kal's MTF ADX Rangoli Roller (Above)
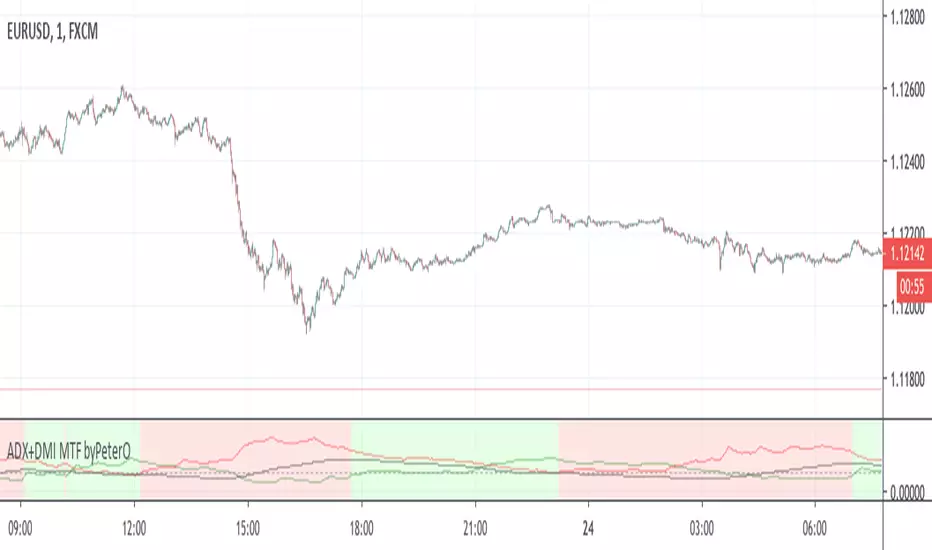
ADX+DMI MTF byPeterOThe goal of this study was to use ADX from Higher Timeframe - to determine trend direction
Why? Because ADX is very sensitive, able to show trend ending without any delay, but not in the middle of it.
Being able to see such immediate trend change on higher timeframe, is a great indicator of trend direction.
Adding just security() calls to 'highest', 'lowest' and 'close' didn't seem right, because it produced some ugly ADX, D+ and D- plotlines.
I wanted to see plotlines, which look exactly like those on actual higher timeframe. Therefore I modified the calculations.
You can read more about my take on (not) using security() calls in my other source code indicator RSI MTF: link in comments.
On top of all that, I added interpretation of DMI readings, because it is not as simple as plus>minus + ADXrising = uptrend.
So GREEN background means higher timeframe uptrend and RED background means downtrend.
ADX-DI Multi-TimeframePlots the multiple time frame version of the classic ADX-DI indicoator.
ADX
DI+ and DI-
ADX Threshold
DI Histogram difference with 2 threshold lookback values
For a similar multiple time frame indicator see the following scripts. They both use the historical + projection approach to yield non-repainting indicators.
Fisher Transform Multi-Timeframe
Laguerre RSI Multi-Timeframe

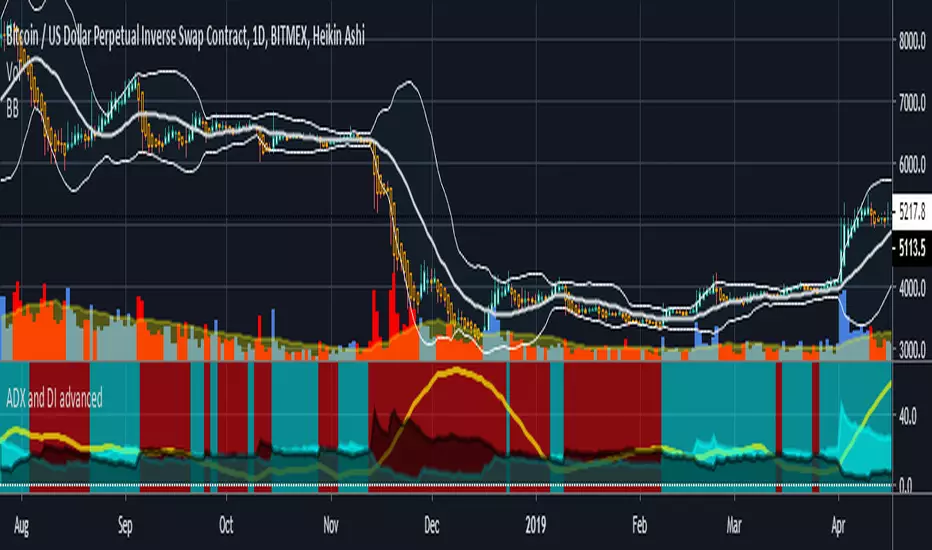
ADX and DI advancedThis is a special ADX and DI which includes the following additional functions:
cr1- allows you to set alerts based on if DI+ and DI- crossover each other leading to a new trend
cr2- shows a constant background highlight of a trend.
ADX threshold- you can set a threshold value so that any readings below that are ignored and the indicator paints a blank black area instead.
cr3 and cr4 are experimental- would not reccommend using yet (they were part of a test I did)
For a detailed video on how I use this indicator please go here
youtu.be
The article version was published here originally
bitcointradingtoday.com
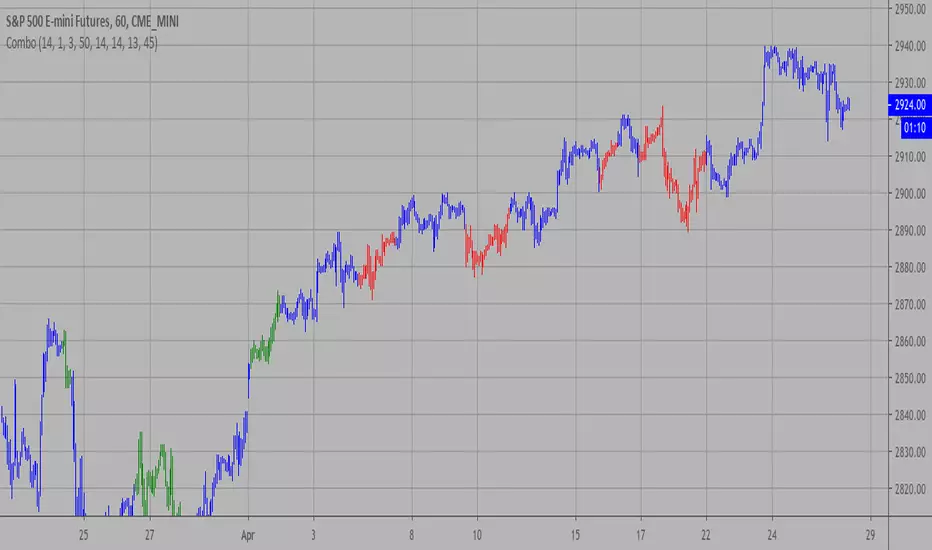
Combo Strategy 123 Reversal and ADXR This is combo strategies for get
a cumulative signal. Result signal will return 1 if two strategies
is long, -1 if all strategies is short and 0 if signals of strategies is not equal.
First strategy
This System was created from the Book "How I Tripled My Money In The
Futures Market" by Ulf Jensen, Page 183. This is reverse type of strategies.
The strategy buys at market, if close price is higher than the previous close
during 2 days and the meaning of 9-days Stochastic Slow Oscillator is lower than 50.
The strategy sells at market, if close price is lower than the previous close price
during 2 days and the meaning of 9-days Stochastic Fast Oscillator is higher than 50.
Secon strategy
The Average Directional Movement Index Rating (ADXR) measures the strength
of the Average Directional Movement Index (ADX). It's calculated by taking
the average of the current ADX and the ADX from one time period before
(time periods can vary, but the most typical period used is 14 days).
Like the ADX, the ADXR ranges from values of 0 to 100 and reflects strengthening
and weakening trends. However, because it represents an average of ADX, values
don't fluctuate as dramatically and some analysts believe the indicator helps
better display trends in volatile markets.
WARNING:
- For purpose educate only
- This script to change bars colors.
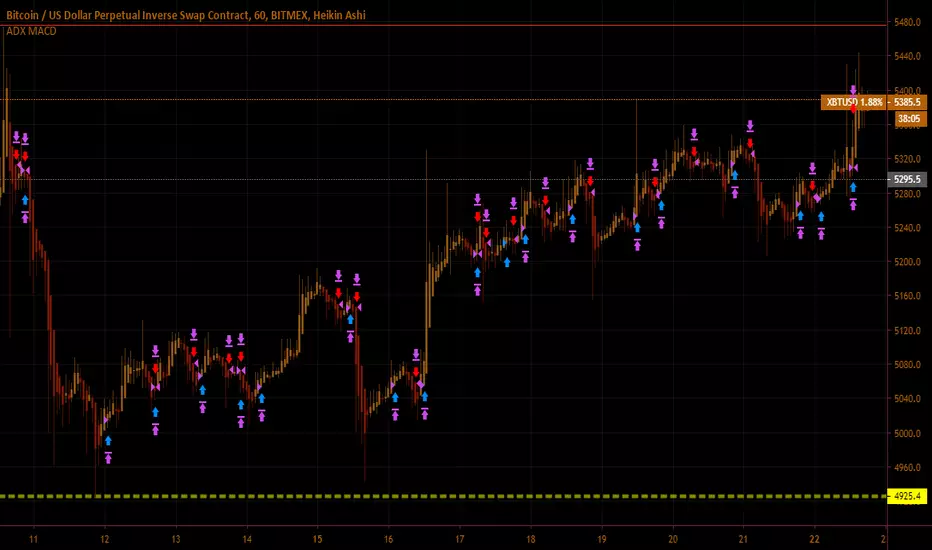
E-Z's Slither Maker Strategy v0.01This is a strategy I built based on custom MACD and ADX/DMI settings.
Works best for scalping the one hour.
If you run into any issues let me know.
If this script makes you money and feel thankful for all my hard work, you can donate to the addresses below <3
BTC: 3CS6VqDrCf7XRn46bqcXMUZQecbQJ7TKfs
BCC/BCH: bitcoincash:qqrca9z7w2gl2wevjvry6uv7quhcn7kaycx43r34tf
DOGE: AC9tZB6NMoWpvMZmmtop5yXsv7GhHYAxWd
LTC: 34HajDFE3aDWgs1etG3851CLvqNV9pg5Te
ADX & Strength Line 23That line show me if the trend have strength.-
Aveaverage directional index plus 23 Strength Line.

Absolute Strength MTF IndicatorIntroduction
The non-signal version of the absolute strength indicator from fxcodebase.com requested by ernie76 . This indicator originally from mt4 aim to estimate the bullish/bearish force of the market by using various methods.
The Indicator
Two lines are plotted, a bull line (blue) representing the bullish/buying force and a bear one (red) representing the bearish/selling force, when the bull line is greater than the bear line the market is considered to be strongly bullish, else strongly bearish.
The indicator use various method, Rsi, stochastic, adx. The Rsi method is the one by default.
The stochastic method is less reactive but smoother
The Adx method is way different, while the other two methods make the bull and bear lines somewhat uncorrelated, the adx method focus more on the overall market strength than individual buyer/seller strength.
The smoothing method use 3 different filters, SMA, EMA and LSMA, LSMA is more reactive than the two previous one while EMA is just more computer efficient.
It is possible to use price data of different time frames for the calculation of the indicator.
Stochastic method with 4 hour price close as source.
Conclusion
A classic indicator who can be derived into a lot of ways using a more adaptive architecture or recursion. Hope you find it a use :)
A big thanks to ernie76 for the request and the support/testing of the indicator
Feel free to pm me for any request.

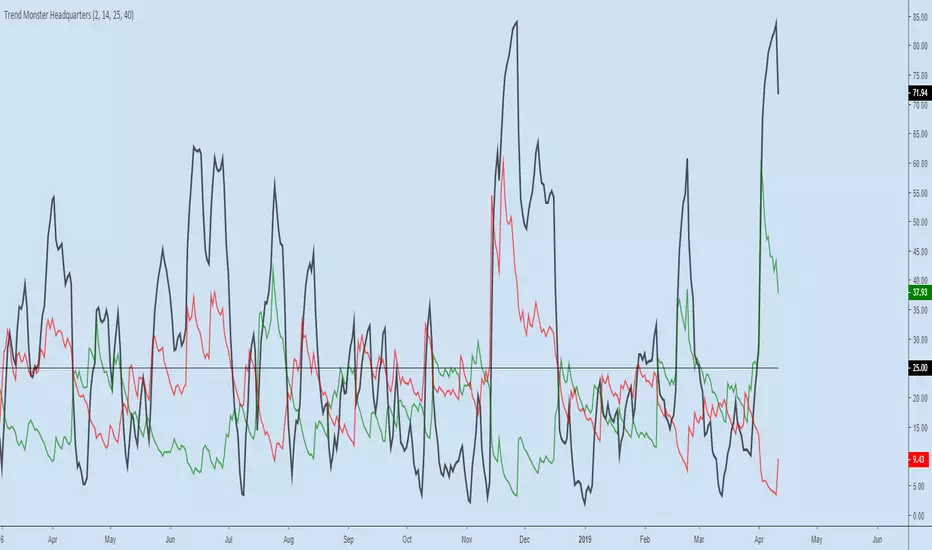
Trend Monster HeadquartersADX-DMI enhanced & modified for faster reaction
ADX (black line) above 80 = mega-trend peaked, reversal imminent, rare case scenario
ADX (black line) above 60 = trend topping out, reversal possible, depending on other indicators
ADX (black line) above 25 threshold = trend strenghening
DMI- (red line) - above 25 - bear trend strenghening
DMI+ (green line) - above 25 - bull trend strenghening
DMI- (red line) - coming off the bottom - bull trend weakening
DMI+ (green line) - coming off the bottom - bear trend weakening
[Long/Short] Range Filter-ADX-SAR [BACKTEST]Backtest of the same previous script with alerts.
Range Filter + ADX + SAR + Trailing Stop + Take Profit

Hucklekiwi Pip - HLHB Trend-Catcher SystemThe strategy was authored by Hucklekiwi Pip back in 2015 and is still being updated today. She says that the system was designed to simply catch short-term forex trends. At its heart, the system is a simple EMA crossover strategy with a couple of other indicators used for confirming entries.
Strategy Rules
See her original post here:
www.babypips.com
Be sure to check out the updates and tweaks over the years!
HOW TO USE
For full information on how to use this strategy and how to correctly set the exit time, see this post:
backtest-rookies.com


