Trader Set - Volume CandleThis is a candlestick system but not on price. These candles are drawn based on the volume movement. This is one of those professional charting systems that big industries use every day. Remember, the key to find what smart money is doing, is always VOLUME. Any new way that you can track new aspects of volume will help determining what the market will do, BEFORE it starts doing it !
There are total of Seven moving averages that you can ...:
1- Set their period separately
2- Set their type separately
3- Turn on/off separately
The averaging types that are supported, remember you have options PER moving average :
- SMA
- EMA
- RMA
- WMA
- HMA
- KAMA
- MAMA
- FAMA
This script IS FOR SALE , you can buy it with crypto currencies, or webmoney or perfect money. THE PRICE is 55$. for life time license.
You can find all the crypto wallet addresses plus webmoney and perfect money accounts in the link below. Please send the correct amount PLUS the transaction fee. After the transaction is confirmed, contact me with the info of the transaction for granting access.
AَِDDRESSES FOR WALLETS : justpaste.it
Average

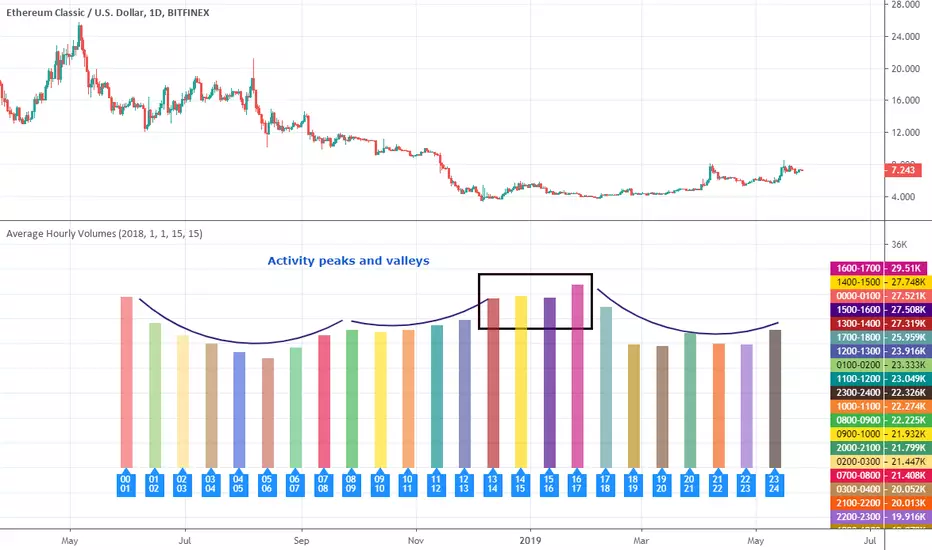
Average Hourly VolumesHello traders!
This indicator shows you the average hourly volumes across the instrument history.
It can help you to find time frames with the highest and the lowest activity of traders. Thus, you will know when to jump into the train and when to jump out.
What is included
An option to include/exclude weekends from calculation
An option to start calculations from specific date
An option to hide zero volumes
It works on ANY instrument that has available volume data.
It works on all resolutions
I attached some screenshots to show you how it works with other instruments.
Good luck and happy trading!
Multiple Security Average VolumeCame up with an idea to show an average volume of up to 6 securities together. Helps when looking at Bitcoin with its multiple exchanges.

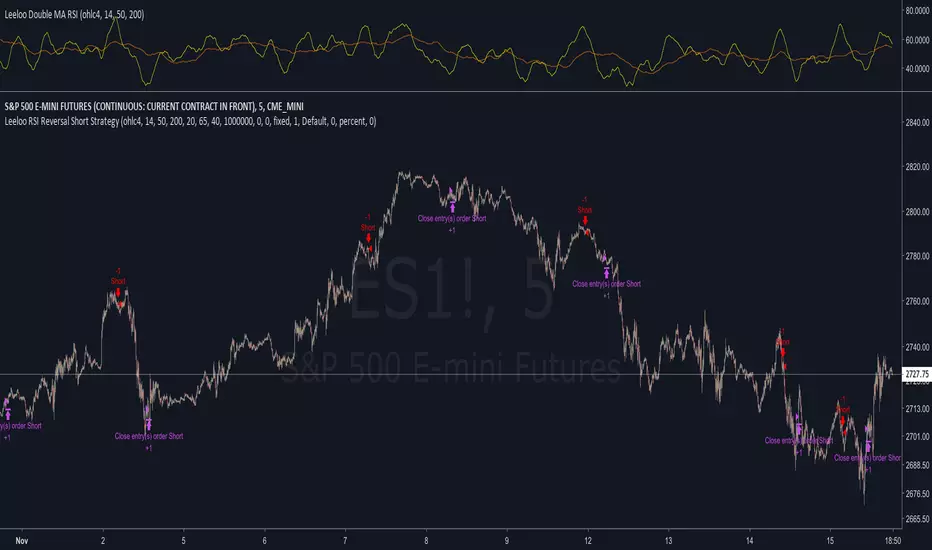
Leeloo RSI Reversal Short StrategyThis strategy is based on applying two moving averages to RSI and then opening a short position when the short-length average is above the slow-length average, has recently changed direction within the last n bars, and is in overbought territory.
Default settings work best on short intervals (5min)
Don't be afraid to use extended hours
Everything is based on last complete bar; once something shows up it is good to go
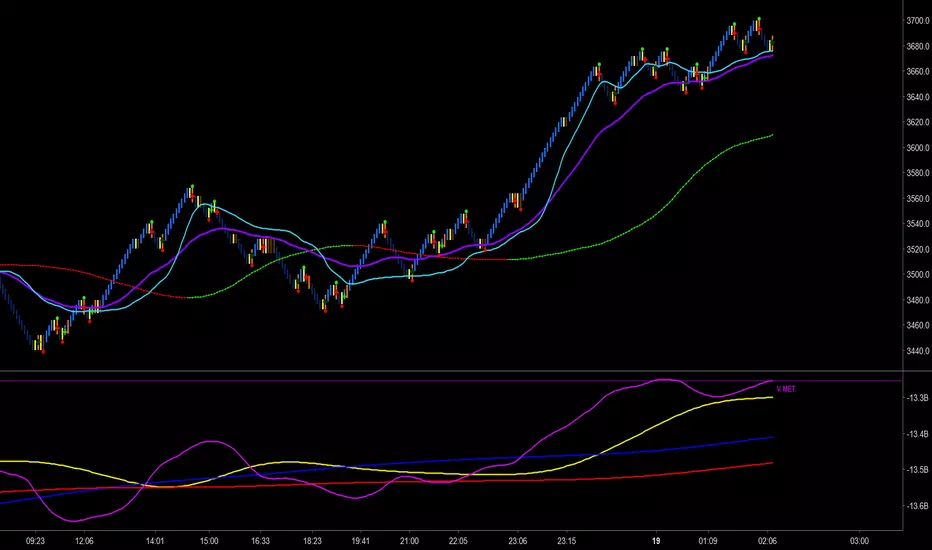
Trader Set - Volume MetricThe last tool in my methodology set, another one of those tools that has unique unpublished formulas, this one purely for following volume and reading smart money's hand, YES it's possible. This indicator has few Alerts built in that you can use, will update the rest of the scripts for additional alerts. You can easily set the alert to play a sound that is not disturbing in long run and check mark open ending and have easy time being alerted when some crossings are happening.
Please, don't ask for access, only my students from my classes will have access to this indicator. The English version of the website and learning material is under development and the moment they get ready I will announce it under each related script.
Triple guppy w/ up/down colours - squattterThe trend is your friend.
Works well on 2hr TF which shows 30+60 ema from 8hr and Daily TFs.
Use a higher TF momentum indicator such as TRIX to confirm.

Auto-Line With DriftA variation on the Auto-Line indicator, we allow it to get closer to the price thanks to a drift , this also allow the line to be more directional .
This indicator can be used with moving averages using crosses as signals or as a band indicator by ploting a + dev as the upper band and a - dev as the lower one.
For any help or suggestions feel free to send a message :)

Multi Z Score [DW]This is an experimental study using z scores of multiple sampling periods to analyze price trends.
Z score measures the number of standard deviations price is from its mean.
In this study, z scores are calculated over a Fibonacci sequence of sampling periods from 3 to 4181.
The scores are then averaged with equal weighting, resulting in a display of long term trend with short term sensitivity.
Custom bar colors are included. The color scheme is based on the perceived trend from the average z score.

Earnings Support and Resistance Levels [NeoButane]Inspired by @LazyBear's/@timwest's script:
Usage: support and resistance levels based on averaging price around earnings and quarterly opens.
What it is plotting:
1. A horizontal level whenever earnings occur. If actual earnings is higher than estimated, the line turns green, else red.
2. A horizontal level every quarterly open, colored black.
3. An average between the two mentioned above, colored orange.
4. 5% moves away from 3M open and earnings
5. Misc: 5% move away from that 5% move away, then 10% move away from the 2nd 5% move away.
By default, 4 and 5 are off to reduce visual noise.
Idea: Traders panic around certain dates that always happen, and traders always panic in the wrong direction. The market is composed of traders trading in the wrong direction at the same time, all the time. That means price will bounce back and forth as the gambling dens colloquially known as 'forex brokerages' or 'stock exchanges' take your money in the form of fees, time, and liquidations. So I put two lines on the chart and put one right in between, because it always goes back. I hope you can find it useful!
Note: This was a part of the old fundamental data indicators and is not officially for use, so while it should work on most U.S. stocks and a couple of other exchanges, it is not perfect.

Ehlers Distance Coefficient FilterThis indicator was described by John F. Ehlers in his book "Rocket Science for Traders" (2001, Chapter 18: Ehlers Filters).
15minMAThis script lets you plot a simple or exponential moving average from a specific time frame that you can select. For example, if you always want the Daily 50MA on your chart, regardless of what resolution your chart is on, this will do it. It's also color coded to show if it's rising or falling.

Moving Average 6xDisplays up to six moving averages at a time in one indicator.
Default: 5, 10, 20, 50, 100, 200


Average Directional Index-BuschiA simple modification of the built-in "Average Directional Index":
To identify wether there is an uptrend or a downtrend, the function color is conditional:
no trend: black
small uptrend (weak threshold): light green
big uptrend (strong threshold): green
small downtrend (weak threshold): light red
big downtrend (strong threshold): red

Ehlers FilterThis is the Adaptive Ehlers Filter.
I had to unroll the for loops and array because TV is missing crucial data structures and data conversions (Arrays and series to integer conversion for values).
I'm in the process of releasing some scripts. This is a very old script I had. This contains volatility ranges and can be used as trading signals. You can also see how the EF moves up or down, the direction, when price is sideways, and use price breaks up and down as signals from the line.
Have fun, because I didn't making this script hahaha
NOTE : There is an issue with the script where at certain time frames it positions itself below or above. I think its due to calculations. If anyone knows the fix before I get the chance to take a look at it, please let me know.
books.google.com

Octal EMA + SMAThis script gives the most required moving averages in one indicator.
Designed in a better way to make traders experience easier in tradingview.
Gives the traders to find the support and resistance.
Offers better flexibility to the traders to choose their preferred moving averages.
Traders can choose EMA or SMA for every moving average separately.
Hope you like my indicator. Keep trading. Gain profits.
Kindly support me with your likes.

Easy ma cross strategyEasy ma cross strategy.
Works fine in sideways or bullish market.
Don't forget to use a stop-loss!

5 Moving Average Exponential 7-15-30-50-2005 Moving Average Exponential. Crypto EMA. 7 is a fast support or resistance, 15 confirmation support or resistance. 30 Important support and resistance. 50 institutional support or resistance. 200 general trend, support and resistance.

Average DownThis strategy has been published for a Pyramiding tutorial on the Backtest Rookies website.
For a full overview of the code and an introduction to Pyramiding check out our site.
Summary
The code example will create a simple script that allows us to average down whenever our portfolio is down x%. The idea will be to bring our average cost down so that we can still exit with a profit when conditions improve. With this in mind, the strategy shall also have a simple take profit exit at x% above our average price.
Inputs
Target Loss to Average Down (%) : This is the target percentage level will trigger us to average down. In other words, if we have a close below this level from our average buying price, we will average down.
Target Take Profit : A standard take profit percentage level. Use this to set how much profit you will target.
% Of Current Holdings to Buy : Is the number of shares/contracts we will aim to buy when we average down. 50 will mean we buy 50% of our current holdings. So if we have 100 shares, then we buy 50 when we average down.
SMA Period : Defines our SMA lookback period. Our strategy will enter the first/initial position when we have a close above our SMA level.
