Kaufman Adaptive Moving Average (day)The KAMA will not change when the interval changes from day to something like 5 minutes or 30 minutes. Allows for more precise trading with the same indicator on a different interval.
Average
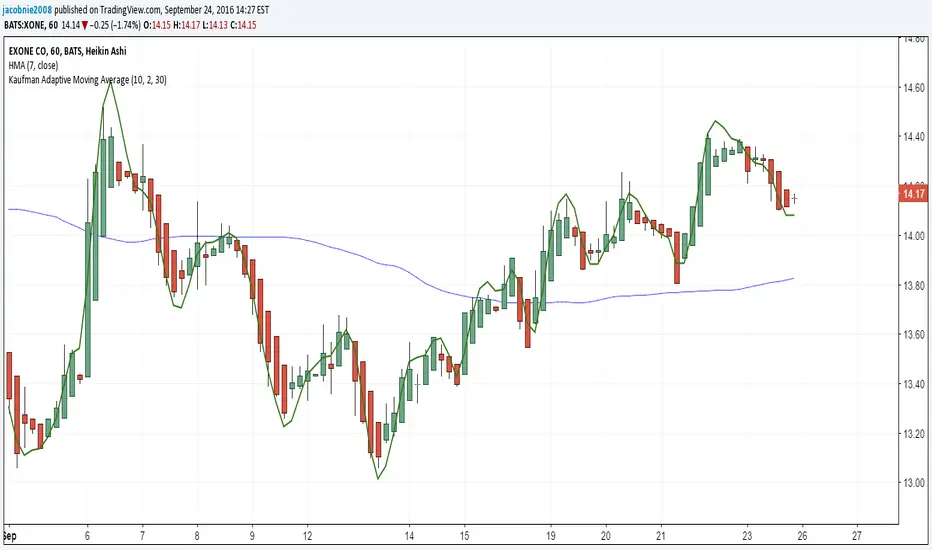
Kaufman Adaptive Moving AverageFrom Stockcharts.com:
"Developed by Perry Kaufman, Kaufman's Adaptive Moving Average (KAMA) is a moving average designed to account for market noise or volatility. KAMA will closely follow prices when the price swings are relatively small and the noise is low. KAMA will adjust when the price swings widen and follow prices from a greater distance. This trend-following indicator can be used to identify the overall trend, time turning points and filter price movements."
This is different from other users' KAMA's because it allows the user to adjust more parameters that can adjust the indicator in more precise ways without needing to change the source code.

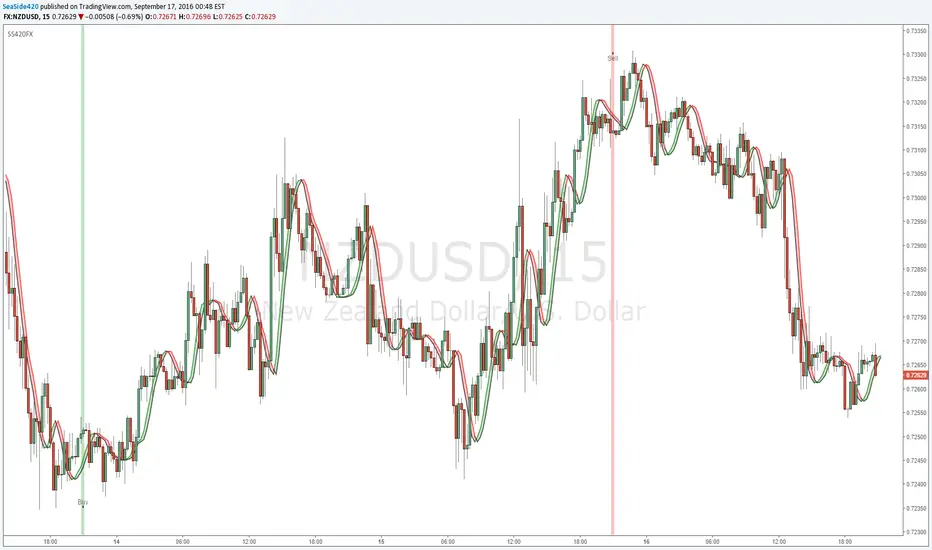
SS420FXTwo Moving_Average cross's & Daily_Candle cross
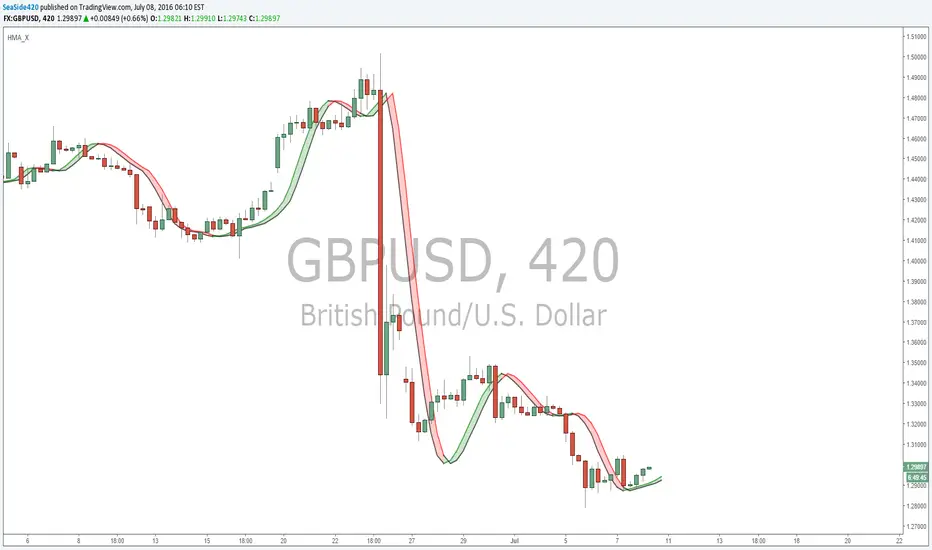
Based on Hull_MA
Developed by Alan Hull, it is an indicator, that solves the problem with making a moving average more reactive to current price activity. The Hull Moving Average almost eliminates lag and manages to improve smoothing.
The HMA manages to stick to rapid changes in price activity, as it has superior smoothing over a Simple Moving Average of the same period. The HMA employs Weighted Moving Averages (WMA) and dampens the smoothing effect. It can be calculated as follows:
HMA(n) = WMA(2*WMA(n/2) – WMA(n)), sqrt(n))
SS420FXTwo Moving_Average cross's & Daily_Candle cross
Based on Hull_MA
Developed by Alan Hull, it is an indicator, that solves the problem with making a moving average more reactive to current price activity. The Hull Moving Average almost eliminates lag and manages to improve smoothing.
The HMA manages to stick to rapid changes in price activity, as it has superior smoothing over a Simple Moving Average of the same period. The HMA employs Weighted Moving Averages (WMA) and dampens the smoothing effect. It can be calculated as follows:
HMA(n) = WMA(2*WMA(n/2) – WMA(n)), sqrt(n))

Ichimoku + Daily-Candle_X + HULL-MA_X + MacDIchimoku_cloud + Daily-Candle_cross(DT) + HuLL-MovingAverage_cross + MacD
any timeframe, all indicators settings adjustable for fine tuning to pair/timeframe
Target Point and Stop Loss settings
set SL low to reduce repaint

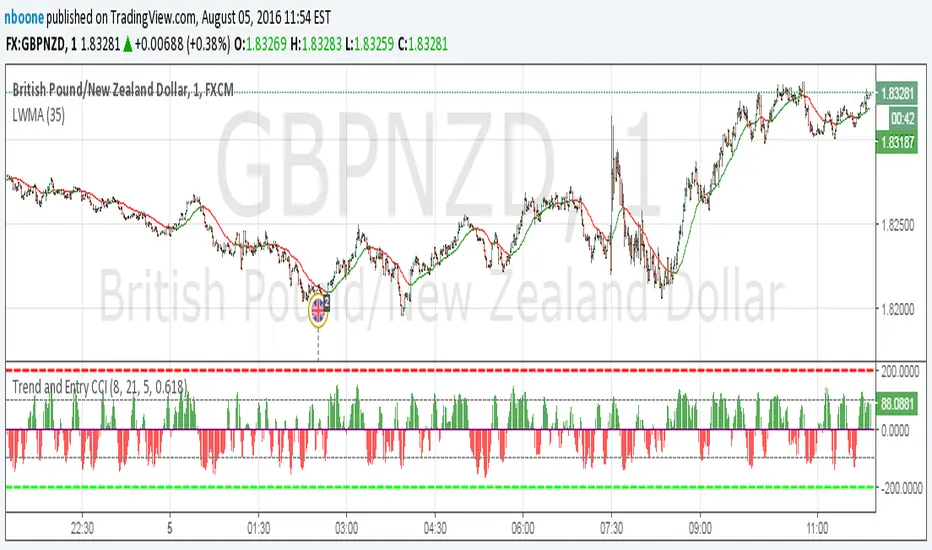
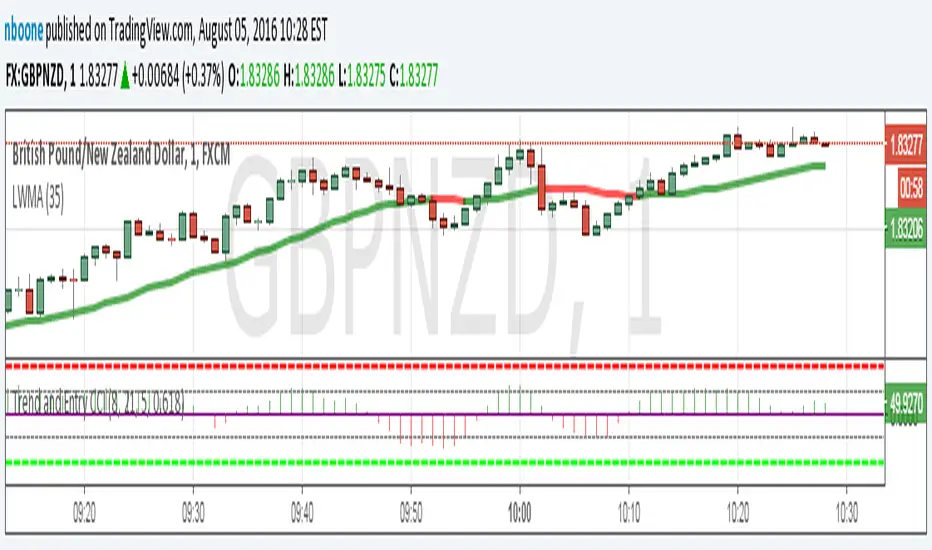
LWMA w/ Color ChangeLinear Weighted MA that changes colors based on slope.
Green = slope up from last bar
Yellow = slope is 0 from last bar
Red = slope down from last bar
This time with the ability to change the period.
LWMA w/ Color ChangeLinear Weighted MA that changes colors based on slope.
Green = slope up from last bar
Yellow = slope is 0 from last bar
Red = slope down from last bar
Triple Guppy CrossGUPPY MULTIPLE ESTIMATED MOVING AVERAGE (EMA) is for Trend Trading. This script uses three sets of crosses to give us an indicator of possible trend reversal. Red cross is the first alert, followed by blue and black. Black cross being the strongest, red cross weakest.
More information about Guppy Trading can be found in the link below

Trend MA 20Simple to use for anyone trading a 20 length moving average.
Crossover is signaled once 20 MA crosses 1 MA at close of selected time interval.

WJA double EMASimple indicator with two exponential moving averages and crossover alert.
Why didn't this exist already?

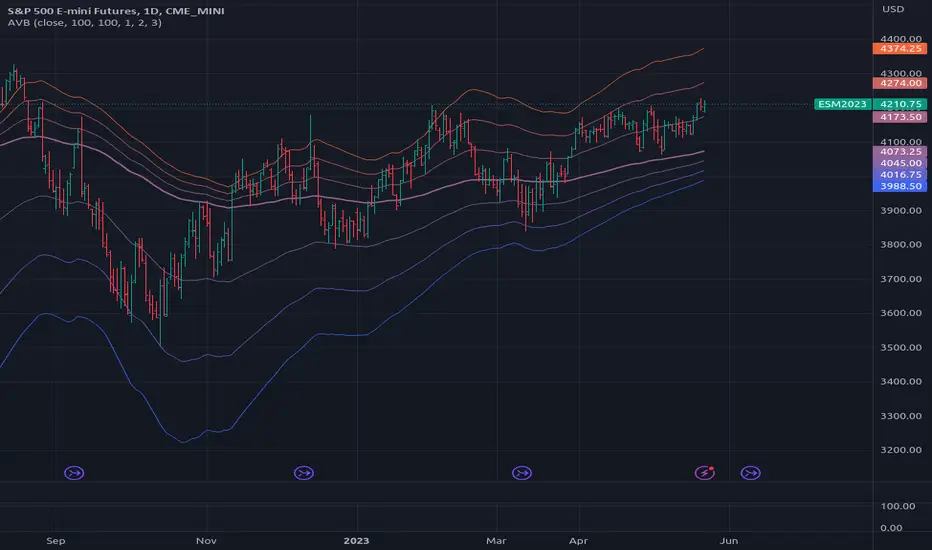
[RS]Average Variation Bands V1optional method for cumulative averaging of the range variation.
optional length for averaging range variation.


Chauvenet RadiusThe Chauvenet criterion is a well-known criterion of selection and rejection of the data used by the Physics. It establishes that in an experiment is well to discard the data whose distance from the average is greater than a certain number of the delta.
In the stock market if prices move away from the average with a volatility too high are suspect. This principle is embodied in the Chauvenet floor with the definition of two asymptotes and two data areas rejection.
The Chauvenet Radius is the quadratic sum of the delta (distance from average) and sigmoid (volatility) and is therefore an obvious market stability index. In fact the moments when price strongly moves away from the average with high volatility coincide with the moments of high instability of the market.
It can be considered an evolution of John Bollinger method introduced during the '80.
Source: www.performancetrading.it
Fractal Adaptive Moving Average (real one)Ignore the other one (it contains some errors).
On this FRAMA you can play with length, SC and FC.
Just read on below links to understand more about this super useful moving average:
etfhq.com
etfhq.com
www.quantshare.com

Golden Cross KAMAThe usage is very easy. When the line is green you can open long position, when the line is red you can open short position and when it's black just check by yourself.
Usually I use it with RSI and Bollinger Bands , in order to determine when the signal is strong or weak.
Just play with fastest and slowest SC to adjust the smoothness.

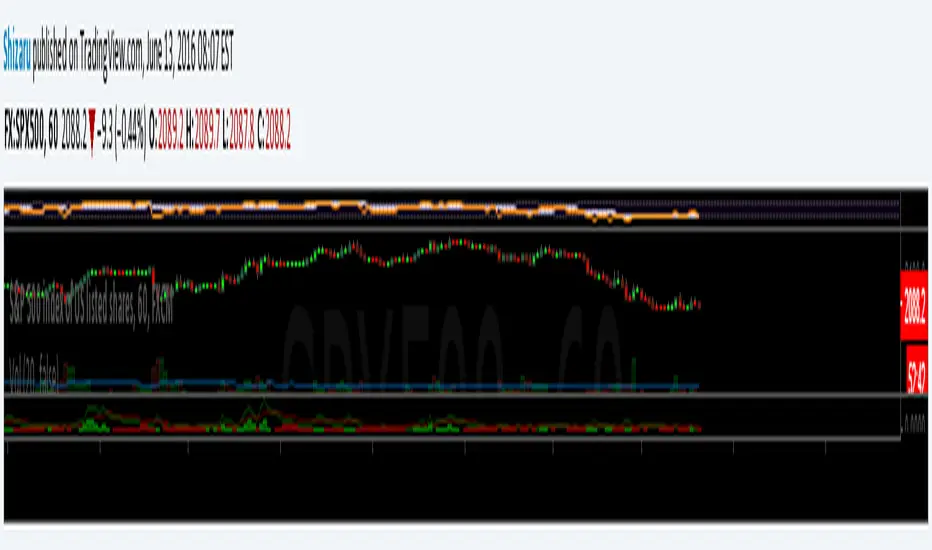
Fractal Adaptive Moving AverageSettings:
FRAMA: blue line, SC = 252, FC = 40, length = 252
EMA: orange line, length = 50
FRAMA seems to be the evolution of the current and much-used EMA. The basic strategy is simple: long if the price crosses up the line, short or exit if vice versa.
The main difference between EMA and FRAMA is that the first one seems to lag much more than the first one, as we can see from the chart below (crude oil daily chart)
FYI
etfhq.com
quantstrattrader.wordpress.com

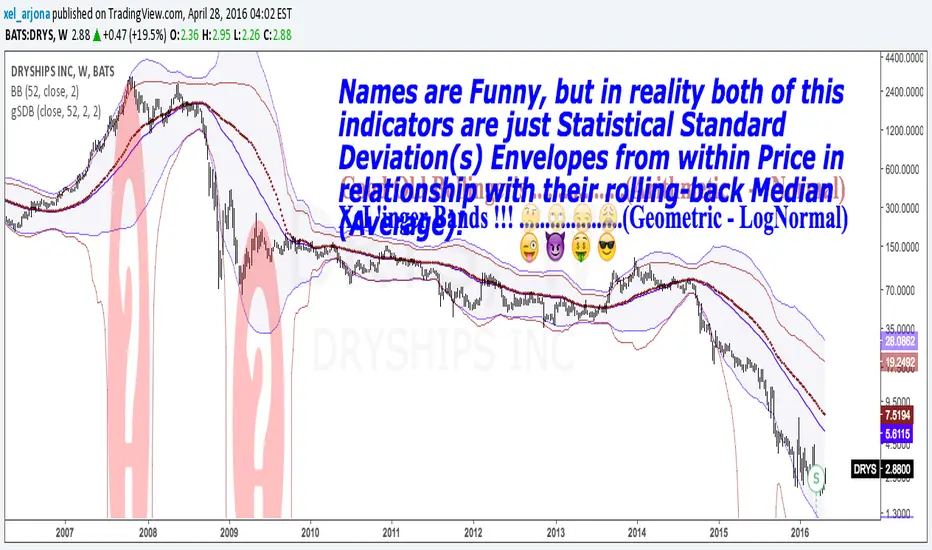
GEOMETRIC STANDARD DEVIATION BANDS v1 by @XeL_ArjonaGEOMETRIC STANDARD DEVIATION BANDS
Ver.1 By Ricardo M Arjona @XeL_Arjona
DISCLAIMER:
The Following indicator/code IS NOT intended to be a formal investment advice or recommendation by the author, nor should be construed as such. Users will be fully responsible by their use regarding their own trading vehicles/assets.
The embedded code and ideas within this work are FREELY AND PUBLICLY available on the Web for NON LUCRATIVE ACTIVITIES and must remain as is.
WHAT'S THIS?
This IS NOT the wheel "Re-Invention"... This is exactly what the name says: A pair of Envelope Bands to measure "volatility", constructed at statistical relation from within price series and their Rolling back MEAN (Simple Moving Average). YES, What Mr. Bollinger did and put it's name to this simple, cleaver and popular formula.
This time, I took the time to make another simple mod, but seems to me to be quite functional in REAL VOLATILE assets like in the example chart: TO USE THEIR GEOMETRIC MODE!!
Cheers!
Any feedback or public modification(s) are quite welcome to the community....!
@XeL_Arjona
Apr 28 2016

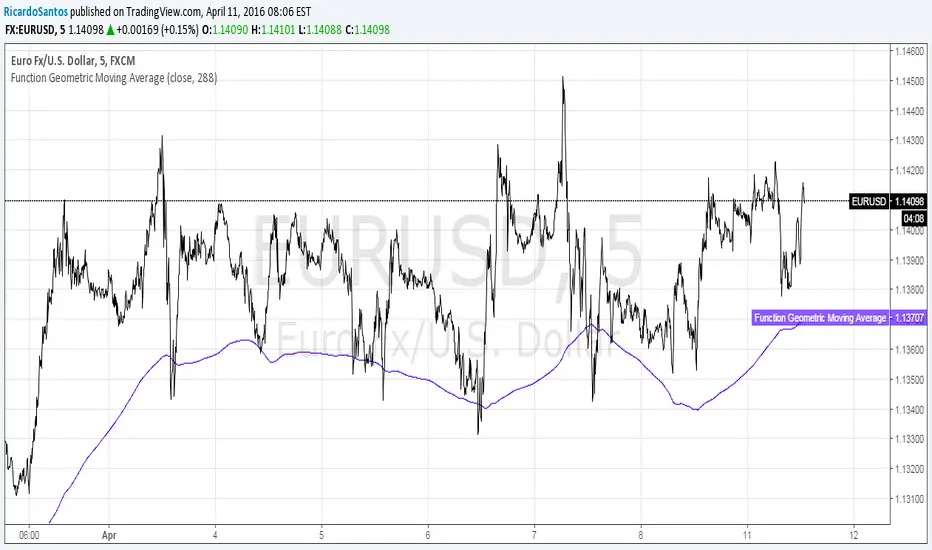
Function Geometric Moving AverageUsing a formula that is generally used for calculating investment over time to check gains on a commodity.
Geometric mean as described here: www.investopedia.com