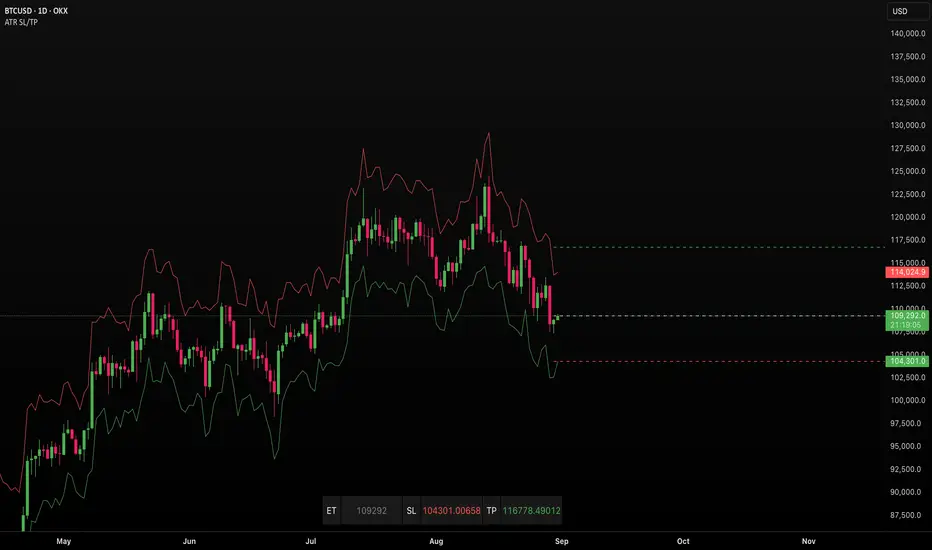
Turtle Trading with LayeringCrafted professional write-up for TradingView indicator publication.
Turtle Trading with Layering System
A complete implementation of the famous turtle trading strategy with proper position layering/pyramiding for manual trading.
Features
Core Turtle System:
20-day breakout entries (primary signals)
55-day breakout entries (backup after losses)
10-day reverse breakout exits
ATR-based stop losses and position sizing
Position Layering:
Build positions gradually as trends develop
Add up to 4 units per position
Each unit added every 0.5 ATR in your favor
Single stop loss protects entire position
Gamme réelle moyenne (ATR)

LBM-Strategy Engine Pro: The Ultimate Confluence IndicatorOverview
Welcome to the Strategy Engine Pro , the ultimate confluence indicator designed for traders who demand precision and full control over their trading signals. This is not just an indicator; it is a complete, customizable strategy-building framework.
It seamlessly integrates three powerful concepts into a single, intuitive tool:
Advanced Moving Average Trend Analysis to define the market context.
An intelligent Support & Resistance Cycle Engine to identify key price levels.
A flexible 10-rule Strategy Builder that lets you design, test, and refine your own entry signals with surgical precision.
Core Features
1. Advanced Moving Average Trend Analysis
The indicator plots 5 fully configurable Moving Averages (MAs). You can choose the Period and Type (SMA, EMA, WMA, HMA, RMA) for each one. But its true power lies in its unique color-coding system, which analyzes the slope and momentum of each MA, not just its price.
MA Color Code:
Green: The MA is in a strong, confirmed uptrend.
Red: The MA is in a strong, confirmed downtrend.
Yellow: The MA is flat or in a transitional (sideways) phase.
This provides an instant visual snapshot of the market trend across five different timeframes.
2. Support & Resistance Cycle Engine
Forget simple pivot points. This indicator incorporates a sophisticated engine that identifies and plots significant "Master Cycle" levels on your chart.
Anchored Levels: These S/R lines are persistent and intelligent. When a key resistance level is broken, it automatically "flips" and becomes the new anchored support level, and vice-versa. This accurately maps out the market's structural progression.
The Strategy Builder: Your Personal Trading Lab
This is the heart of the indicator. You have 10 sequential rules that allow you to define the exact conditions for a Buy signal. The Sell signal is generated as the logical, symmetrical opposite.
For each rule, you can configure:
Source A & Source B: Choose from a wide range of data points:
Price values: Close, Open, High, Low.
Previous candle values: Close Before, Open Before, etc.
Moving Average values: MA 1 through MA 5.
MA Trend Colors: MA 1 Color, MA 2 Color Before, etc.
Operator: Define the comparison logic:
Standard: >, <, >=, <=
Events: Crossover, Crossunder
Color Logic: Is Color, Is NOT Color, Turned Color, Ceased to be Color
Important Note on Sell Signals: Sell conditions are designed to be the symmetrical opposite of the buy conditions you create.
If Buy is Close > MA 1, Sell will be Close < MA 1.
If Buy is MA 1 Color Is Green, Sell will be MA 1 Color Is Red.
If Buy is MA 1 Color Turned Green, Sell will be MA 1 Color Turned Red.
This ensures your sell strategy mirrors the logic of your buy strategy, preventing the "inverse problem" of getting sell signals on every candle that isn't a buy signal.
Mastering the Connectors: ( ) AND and ( ) OR
The true power of the Strategy Builder lies in its connectors, which allow you to create complex, multi-layered logic. The connector on a rule defines how it connects to the next active rule.
AND & OR: These work as you'd expect, creating a continuous chain of conditions.
Rule 1 (AND) & Rule 2 is evaluated as (R1 AND R2).
( ) OR (The Group Separator): This is your most powerful tool. It acts like closing a parenthesis in an equation. It finalizes the current group of rules and connects it to the
next group with a big "OR".
Example: (R1 AND R2) OR (R3 AND R4)
This creates two possible paths for a signal.
- Rule 1: Condition R1, Connector AND
- Rule 2: Condition R2, Connector ( ) OR <-- This closes the first group and links to the next with OR.
- Rule 3: Condition R3, Connector AND
- Rule 4: Condition R4
( ) AND (The Super-Filter): This allows you to create a "master" condition that must be true in addition to other complex conditions.
Example: (R1 OR R2) AND (R3 OR R4)
This requires a condition from the first group and a condition from the second group to be true.
- Rule 1: Condition R1, Connector OR
- Rule 2: Condition R2, Connector ( ) AND <-- This closes the first OR group and links to the next with AND.
- Rule 3: Condition R3, Connector OR
- Rule 4: Condition R4
By strategically combining these connectors, you can build any logical trading scenario you can imagine. We look forward to seeing the powerful strategies the community creates with this engine.

Composite Time ProfileComposite Time Profile Overlay (CTPO) - Market Profile Compositing Tool
Automatically composite multiple time periods to identify key areas of balance and market structure
What is the Composite Time Profile Overlay?
The Composite Time Profile Overlay (CTPO) is a Pine Script indicator that automatically composites multiple time periods to identify key areas of balance and market structure. It's designed for traders who use market profile concepts and need to quickly identify where price is likely to find support or resistance.
The indicator analyzes TPO (Time Price Opportunity) data across different timeframes and merges overlapping profiles to create composite levels that represent the most significant areas of balance. This helps you spot where institutional traders are likely to make decisions based on accumulated price action.
Why Use CTPO for Market Profile Trading?
Eliminate Manual Compositing Work
Instead of manually drawing and compositing profiles across different timeframes, CTPO does this automatically. You get instant access to composite levels without spending time analyzing each individual period.
Spot Areas of Balance Quickly
The indicator highlights the most significant areas of balance by compositing overlapping profiles. These areas often act as support and resistance levels because they represent where the most trading activity occurred across multiple time periods.
Focus on What Matters
Rather than getting lost in individual session profiles, CTPO shows you the composite levels that have been validated across multiple timeframes. This helps you focus on the levels that are most likely to hold.
How CTPO Works for Market Profile Traders
Automatic Profile Compositing
CTPO uses a proprietary algorithm that:
- Identifies period boundaries based on your selected timeframe (sessions, daily, weekly, monthly, or auto-detection)
- Calculates TPO profiles for each period using the C2M (Composite 2 Method) row sizing calculation
- Merges overlapping profiles using configurable overlap thresholds (default 50% overlap required)
- Updates composite levels as new price action develops in real-time
Key Levels for Market Profile Analysis
The indicator displays:
- Value Area High (VAH) and Value Area Low (VAL) levels calculated from composite TPO data
- Point of Control (POC) levels where most trading occurred across all composited periods
- Composite zones representing areas of balance with configurable transparency
- 1.618 Fibonacci extensions for breakout targets based on composite range
Multiple Timeframe Support
- Sessions: For intraday market profile analysis
- Daily: For swing trading with daily profiles
- Weekly: For position trading with weekly structure
- Monthly: For long-term market profile analysis
- Auto: Automatically selects timeframe based on your chart
Trading Applications for Market Profile Users
Support and Resistance Trading
Use composite levels as dynamic support and resistance zones. These levels often hold because they represent areas where significant trading decisions were made across multiple timeframes.
Breakout Trading
When composite levels break, they often lead to significant moves. The indicator calculates 1.618 Fibonacci extensions to give you clear targets for breakout trades.
Mean Reversion Strategies
Value Area levels represent the price range where most trading activity occurred. These levels often act as magnets, drawing price back when it moves too far from the mean.
Institutional Level Analysis
Composite levels represent areas where institutional traders have made significant decisions. These levels often hold more weight than traditional technical analysis levels because they're based on actual trading activity.
Key Features for Market Profile Traders
Smart Compositing Logic
- Automatic overlap detection using price range intersection algorithms
- Configurable overlap thresholds (minimum 50% overlap required for merging)
- Dead composite identification (profiles that become engulfed by newer composites)
- Real-time updates as new price action develops using barstate.islast optimization
Visual Customization
- Customizable colors for active, broken, and dead composites
- Adjustable transparency levels for each composite state
- Premium/Discount zone highlighting based on current price vs composite range
- TPO aggression coloring using TPO distribution analysis to identify buying/selling pressure
- Fibonacci level extensions with 1.618 target calculations based on composite range
Clean Chart Presentation
- Only shows the most relevant composite levels (maximum 10 active composites)
- Eliminates clutter from individual session profiles
- Focuses on areas of balance that matter most to current price action
Real-World Trading Examples
Day Trading with Session Composites
Use session-based composites to identify intraday areas of balance. The VAH and VAL levels often act as natural profit targets and stop-loss levels for scalping strategies.
Swing Trading with Daily Composites
Daily composites provide excellent swing trading levels. Look for price reactions at composite zones and use the 1.618 extensions for profit targets.
Position Trading with Weekly Composites
Weekly composites help identify major trend changes and long-term areas of balance. These levels often hold for months or even years.
Risk Management
Composite levels provide natural stop-loss levels. If a composite level breaks, it often signals a significant shift in market sentiment, making it an ideal place to exit losing positions.
Why Composite Levels Work
Composite levels work because they represent areas where significant trading decisions were made across multiple timeframes. When price returns to these levels, traders often remember the previous price action and make similar decisions, creating self-fulfilling prophecies.
The compositing process uses a proprietary algorithm that ensures only levels validated across multiple time periods are displayed. This means you're looking at levels that have proven their significance through actual market behavior, not just random technical levels.
Technical Foundation
The indicator uses TPO (Time Price Opportunity) data combined with price action analysis to identify areas of balance. The C2M row sizing method ensures accurate profile calculations, while the overlap detection algorithm (minimum 50% price range intersection) ensures only truly significant composites are displayed. The algorithm calculates row size based on ATR (Average True Range) divided by 10, then converts to tick size for precise level calculations.
How the Code Actually Works
1. Period Detection and ATR Calculation
The code first determines the appropriate timeframe based on your chart:
- 1m-5m charts: Session-based profiles
- 15m-2h charts: Daily profiles
- 4h charts: Weekly profiles
- 1D charts: Monthly profiles
For each period type, it calculates the number of bars needed for ATR calculation:
- Sessions: 540 minutes divided by chart timeframe
- Daily: 1440 minutes divided by chart timeframe
- Weekly: 7 days worth of minutes divided by chart timeframe
- Monthly: 30 days worth of minutes divided by chart timeframe
2. C2M Row Size Calculation
The code calculates True Range for each bar in the determined period:
- True Range = max(high-low, |high-prevClose|, |low-prevClose|)
- Averages all True Range values to get ATR
- Row Size = (ATR / 10) converted to tick size
- This ensures each TPO row represents a meaningful price movement
3. TPO Profile Generation
For each period, the code:
- Creates price levels from lowest to highest price in the range
- Each level is separated by the calculated row size
- Counts how many bars touch each price level (TPO count)
- Finds the level with highest count = Point of Control (POC)
- Calculates Value Area by expanding from POC until 68.27% of total TPO blocks are included
4. Overlap Detection Algorithm
When a new profile is created, the code checks if it overlaps with existing composites:
- Calculates overlap range = min(currentVAH, prevVAH) - max(currentVAL, prevVAL)
- Calculates current profile range = currentVAH - currentVAL
- Overlap percentage = (overlap range / current profile range) * 100
- If overlap >= 50%, profiles are merged into a composite
5. Composite Merging Logic
When profiles overlap, the code creates a new composite by:
- Taking the earliest start bar and latest end bar
- Using the wider VAH/VAL range (max of both profiles)
- Keeping the POC from the profile with more TPO blocks
- Marking the composite as "active" until price breaks through
6. Real-Time Updates
The code uses barstate.islast to optimize performance:
- Only recalculates on the last bar of each period
- Updates active composite with live price action if enabled
- Cleans up old composites to prevent memory issues
- Redraws all visual elements from scratch each bar
7. Visual Rendering System
The code uses arrays to manage drawing objects:
- Clears all lines/boxes arrays on every bar
- Iterates through composites array to redraw everything
- Uses different colors for active, broken, and dead composites
- Calculates 1.618 Fibonacci extensions for broken composites
Getting Started with CTPO
Step 1: Choose Your Timeframe
Select the period type that matches your trading style:
- Use "Sessions" for day trading
- Use "Daily" for swing trading
- Use "Weekly" for position trading
- Use "Auto" to let the indicator choose based on your chart timeframe
Step 2: Customize the Display
Adjust colors, transparency, and display options to match your charting preferences. The indicator offers extensive customization options to ensure it fits seamlessly into your existing analysis.
Step 3: Identify Key Levels
Look for:
- Composite zones (blue boxes) - major areas of balance
- VAH/VAL lines - value area boundaries
- POC lines - areas of highest trading activity
- 1.618 extension lines - breakout targets
Step 4: Develop Your Strategy
Use these levels to:
- Set entry points near composite zones
- Place stop losses beyond composite levels
- Take profits at 1.618 extension levels
- Identify trend changes when major composites break
Perfect for Market Profile Traders
If you're already using market profile concepts in your trading, CTPO eliminates the manual work of compositing profiles across different timeframes. Instead of spending time analyzing each individual period, you get instant access to the composite levels that matter most.
The indicator's automated compositing process ensures you're always looking at the most relevant areas of balance, while its real-time updates keep you informed of changes as they happen. Whether you're a day trader looking for intraday levels or a position trader analyzing long-term structure, CTPO provides the market profile intelligence you need to succeed.
Streamline Your Market Profile Analysis
Stop wasting time on manual compositing. Let CTPO do the heavy lifting while you focus on executing profitable trades based on areas of balance that actually matter.
Ready to Streamline Your Market Profile Trading?
Add the Composite Time Profile Overlay to your charts today and experience the difference that automated profile compositing can make in your trading performance.

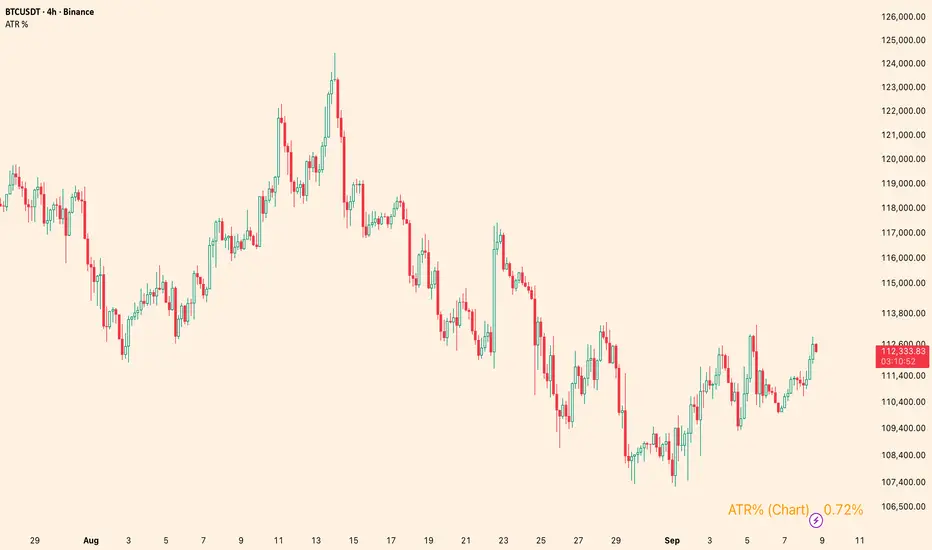
ATR %Overview
Shows the Average True Range (ATR) as a percentage of a chosen price basis. Useful for a quick, apples-to-apples view of current volatility across symbols and timeframes. The value is displayed in a clean table at the bottom-right of the chart.
What it shows
Basis can be: Close, EMA(len), SMA(len), or VWAP.
Data timeframe can be the Chart timeframe or a Daily aggregation.
Inputs
ATR length (len) – ATR lookback.
Percent basis – Close / EMA / SMA / VWAP.
Data timeframe – Chart (uses the current chart TF) or Daily (computes ATR and basis from daily data).
Decimals – number of decimal places to display.
Text / Background / Frame colors – customize the table appearance.
Notes
In Daily mode, ATR and basis are taken from daily data and update on daily close.
VWAP is available only in Chart mode (Daily + VWAP will show n/a by design).
The script overlays the chart but does not plot lines—only a compact info box.
Use cases
Compare volatility across coins/stocks quickly using ATR% instead of raw ATR.
Switch basis to match your style (e.g., EMA for trend-aware scaling, VWAP for intraday context).
Set Daily to track higher-timeframe volatility while trading lower TFs.
Disclaimer
For educational purposes only. Not financial advice. Trading involves risk.
Deadband Hysteresis Supertrend [BackQuant]Deadband Hysteresis Supertrend
A two-stage trend tool that first filters price with a deadband baseline, then runs a Supertrend around that baseline with optional flip hysteresis and ATR-based adverse exits.
What this is
A hybrid of two ideas:
Deadband Hysteresis Baseline that only advances when price pulls far enough from the baseline to matter. This suppresses micro noise and gives you a stable centerline.
Supertrend bands wrapped around that baseline instead of raw price. Flips are further gated by an extra margin so side changes are more deliberate.
The goal is fewer whipsaws in chop and clearer regime identification during trends.
How it works (high level)
Deadband step — compute a per-bar “deadband” size from one of four modes: ATR, Percent of price, Ticks, or Points. If price deviates from the baseline by more than this amount, move the baseline forward by a fraction of the excess. If not, hold the line.
Centered Supertrend — build upper and lower bands around the baseline using ATR and a user factor. Track the usual trailing logic that tightens a band while price moves in its favor.
Flip hysteresis — require price to exceed the active band by an extra flip offset × ATR before switching sides. This adds stickiness at the boundary.
Adverse exit — once a side is taken, trigger an exit if price moves against the entry by K × ATR .
If you would like to check out the filter by itself:
What it plots
DBHF baseline (optional) as a smooth centerline.
DBHF Supertrend as the active trailing band.
Candle coloring by trend side for quick read.
Signal markers 𝕃 and 𝕊 at flips plus ✖ on adverse exits.
Inputs that matter
Price Source — series being filtered. Close is typical. HL2 or HLC3 can be steadier.
Deadband mode — ATR, Percent, Ticks, or Points. This defines the “it’s big enough to matter” zone.
ATR Length / Mult (DBHF) — only used when mode = ATR. Larger values widen the do-nothing zone.
Percent / Ticks / Points — alternatives to ATR; pick what fits your market’s convention.
Enter Mult — scales the deadband you must clear before the baseline moves. Increase to filter more noise.
Response — fraction of the excess applied to baseline movement. Higher responds faster; lower is smoother.
Supertrend ATR Period & Factor — traditional band size controls; higher factor widens and flips less often.
Flip Offset ATR — extra ATR buffer required to flip. Useful in choppy regimes.
Adverse Stop K·ATR — per-trade danger brake that forces an exit if price moves K×ATR against entry.
UI — toggle baseline, supertrend, signals, and bar painting; choose long and short colors.
How to read it
Green regime — candles painted long and the Supertrend running below price. Pullbacks toward the baseline that fail to breach the opposite band often resume higher.
Red regime — candles painted short and the Supertrend running above price. Rallies that cannot reclaim the band may roll over.
Frequent side swaps — reduce sensitivity by increasing Enter Mult, using ATR mode, raising the Supertrend factor, or adding Flip Offset ATR.
Use cases
Bias filter — allow entries only in the direction of the current side. Use your preferred triggers inside that bias.
Trailing logic — treat the active band as a dynamic stop. If the side flips or an adverse K·ATR exit prints, reduce or close exposure.
Regime map — on higher timeframes, the combination baseline + band produces a clean up vs down template for allocation decisions.
Tuning guidance
Fast markets — ATR deadband, modest Enter Mult (0.8–1.2), response 0.2–0.35, Supertrend factor 1.7–2.2, small Flip Offset (0.2–0.5 ATR).
Choppy ranges — widen deadband or raise Enter Mult, lower response, and add more Flip Offset so flips require stronger evidence.
Slow trends — longer ATR periods and higher Supertrend factor to keep you on side longer; use a conservative adverse K.
Included alerts
DBHF ST Long — side flips to long.
DBHF ST Short — side flips to short.
Adverse Exit Long / Short — K·ATR stop triggers against the current side.
Strengths
Deadbanded baseline reduces micro whipsaws before Supertrend logic even begins.
Flip hysteresis adds a second layer of confirmation at the boundary.
Optional adverse ATR stop provides a uniform risk cut across assets and regimes.
Clear visuals and minimal parameters to adjust for symbol behavior.
Putting it together
Think of this tool as two decisions layered into one view. The deadband baseline answers “does this move even count,” then the Supertrend wrapped around that baseline answers “if it counts, which side should I be on and where do I flip.” When both parts agree you tend to stay on the correct side of a trend for longer, and when they disagree you get an early warning that conditions are changing.
When the baseline bends and price cannot reclaim the opposite band , momentum is usually continuing. Pullbacks into the baseline that stall before the far band often resolve in trend.
When the baseline flattens and the bands compress , expect indecision. Use the Flip Offset ATR to avoid reacting to the first feint. Wait for a clean band breach with follow through.
When an adverse K·ATR exit prints while the side has not flipped , treat it as a risk event rather than a full regime change. Many users cut size, re-enter only if the side reasserts, and let the next flip confirm a new trend.
Final thoughts
Deadband Hysteresis Supertrend is best read as a regime lens. The baseline defines your tolerance for noise, the bands define your trailing structure, and the flip offset plus adverse ATR stop define how forgiving or strict you want to be at the boundary. On strong trends it helps you hold through shallow shakeouts. In choppy conditions it encourages patience until price does something meaningful. Start with settings that reflect the cadence of your market, observe how often flips occur, then nudge the deadband and flip offset until the tool spends most of its time describing the move you care about rather than the noise in between.

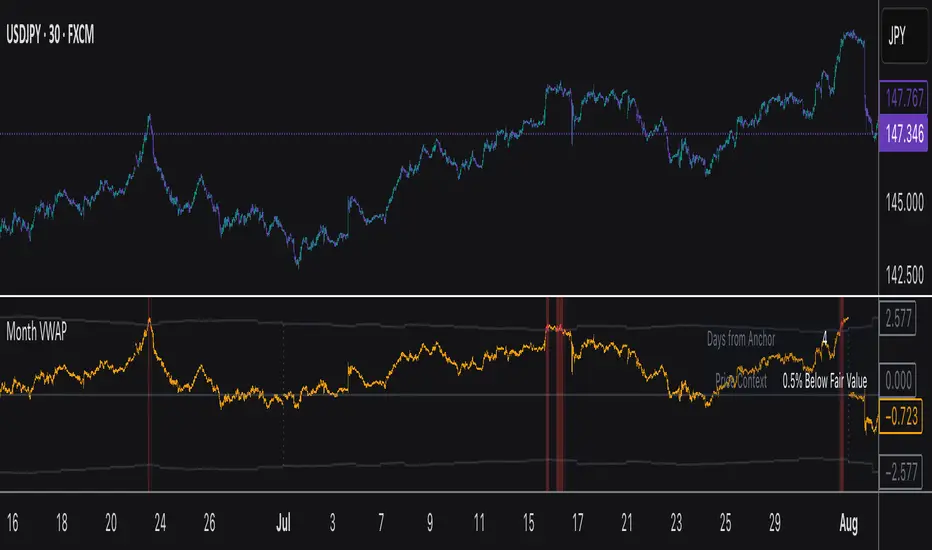
Monthly VWAPDescription
This indicator identifies potential mean reversion opportunities by tracking price deviations from monthly VWAP with dynamic volatility-adjusted thresholds.
Core Logic:
The indicator monitors when price moves significantly away from monthly VWAP and looks for potential reversal opportunities. It uses ATR-based dynamic thresholds that adapt to current market volatility, combined with volume confirmation to filter out weak signals.
Key Features:
Adaptive Thresholds: ATR-based bands that adjust to market volatility
Volume Confirmation: Requires average volume spike to validate signals
Monthly Reset: VWAP anchors reset each month for fresh reference levels
Visual Clarity: Color-coded deviation line with background highlights for active signals
Info Panel: Shows days from anchor and current price context vs fair value
Signal Generation:
Buy Signal: Price below monthly VWAP by threshold amount with elevated volume
Sell Signal: Price above monthly VWAP by threshold amount with elevated volume
Neutral: Price within threshold range or insufficient volume
Best Used For:
Mean reversion strategies in ranging markets
Identifying potential oversold/overbought conditions
Understanding price position relative to monthly fair value
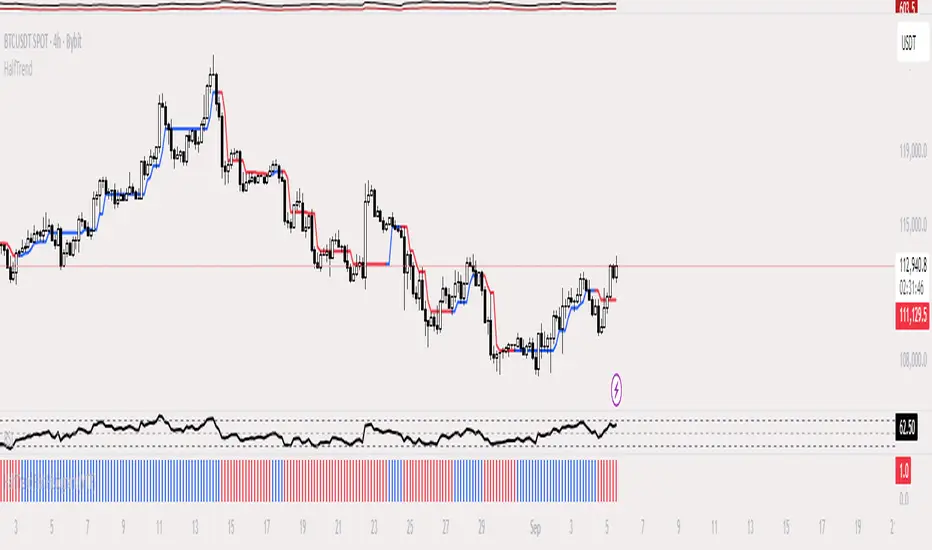
HalfTrend Histogram (MTF)This indicator shows the halftrend on a histogram (rather than a line on the chart) and has an option for Multi timeframe (MTF).
It uses the logic of the original halftrend coded by Everget.
The halftrend is a trend-following indicator that uses volatility to to determine change in bias.
Double Median ATR Bands | MisinkoMasterThe Double Median ATR Bands is a version of the SuperTrend that is designed to be smoother, more accurate while maintaining a good speed by combining the HMA smoothing technique and the median source.
How does it work?
Very simple!
1. Get user defined inputs:
=> Set them up however you want, for the result you want!
2. Calculate the Median of the source and the ATR
=> Very simple
3. Smooth the median with √length (for example if median length = 9, it would be smoothed over the length of 3 since 3x3 = 9)
4. Add ATR bands like so:
Upper = median + (atr*multiplier)
Lower = median - (atr*multiplier)
Trend Logic:
Source crossing over the upper band = uptrend
Source crossing below the lower band = downtrend
Enjoy G´s!

2ATR / Close %Certainly. Here is the English version of the indicator description you requested.
---
### **2ATR Stop-Loss Ratio**
This indicator provides a straightforward calculation of **what percentage a 2ATR (Average True Range) move represents relative to the current price**. It's a specialized tool designed to help traders set dynamic, volatility-based stop-loss levels.
---
### **Purpose of the Indicator**
Many traders use a **2ATR** as their standard for setting a stop-loss, believing it's a good measure of a stock's typical movement. However, it can be difficult to quickly determine the exact percentage a 2ATR drop represents from the current price. This indicator solves that problem by giving you a clear, single number that shows the **anticipated percentage loss before you even enter a position**.
---
### **How It Works**
The indicator is calculated using a simple formula:
**(2 * ATR(20) / Current Price) * 100**
* `ATR(20)`: The Average True Range over the last 20 periods. This period can be customized in the indicator's settings.
* `Current Price`: The closing price at the time of calculation.
---
### **How to Use It**
* **Assess Risk**: A higher number on the indicator means greater volatility, indicating a wider stop-loss range.
* **Set a Stop-Loss**: If the indicator shows **3%**, it means a 2ATR move is roughly a 3% change from the current price. This gives you a clear understanding of the potential loss.
* **Adjust Position Size**: If the potential percentage loss is larger than you're comfortable with, you can use this information to reduce your position size, effectively managing your risk.
This tool is especially useful for trading highly volatile stocks, as it helps you establish a clear and effective risk management strategy.

NY Anchored VWAP and Auto SMANY Anchored VWAP and Auto SMA
This script is a versatile trading indicator for the TradingView platform that combines two powerful components: a New York-anchored Volume-Weighted Average Price (VWAP) and a dynamic Simple Moving Average (SMA). Designed for traders who utilize VWAP for intraday trend analysis, this tool provides a clear visual representation of average price and volatility-adjusted moving averages, generating automated alerts for key crossover signals.
Indicator Components
1. NY Anchored VWAP
The VWAP is a crucial tool that represents the average price of a security adjusted for volume. This version is "anchored" to the start of the New York trading session, resetting at the beginning of each new session. This provides a clean, session-specific anchor point to gauge market sentiment and trend. The VWAP line changes color to reflect its slope:
Green: When the VWAP is trending upwards, indicating a bullish bias.
Red: When the VWAP is trending downwards, indicating a bearish bias.
2. Auto SMA
The Auto SMA is a moving average with a unique twist: its lookback period is not fixed. Instead, it dynamically adjusts based on market volatility. The script measures volatility using the Average True Range (ATR) and a Z-Score calculation.
When volatility is expanding, the SMA's length shortens, making it more sensitive to recent price changes.
When volatility is contracting, the SMA's length lengthens, smoothing out the price action to filter out noise.
This adaptive approach allows the SMA to react appropriately to different market conditions.
Suggested Trading Strategy
This indicator is particularly effective when used on a one-minute chart for identifying high-probability trade entries. The core of the strategy is to trade the crossover between the VWAP and the Auto SMA, with confirmation from a candle close.
The strategy works best when the entry signal aligns with the overall bias of the higher timeframe market structure. For example, if the daily or 4-hour chart is in an uptrend, you would look for bullish signals on the one-minute chart.
Bullish Entry Signal: A potential entry is signaled when the VWAP crosses above the Auto SMA, and is confirmed when the one-minute candle closes above both the VWAP and the SMA. This indicates a potential continuation of the bullish momentum.
Bearish Entry Signal: A potential entry is signaled when the VWAP crosses below the Auto SMA, and is confirmed when the one-minute candle closes below both the VWAP and the SMA. This indicates a potential continuation of the bearish momentum.
The built-in alerts for these crossovers allow you to receive notifications without having to constantly monitor the charts, ensuring you don't miss a potential setup.

Triple Tap Sniper Triple Tap Sniper v3 – EMA Retest Precision System
Triple Tap Sniper is a precision trading tool built around the 21, 34, and 55 EMAs, designed to capture high-probability retests after EMA crosses. Instead of chasing the first breakout candle, the system waits for the first pullback into the EMA21 after a trend-confirming cross — the spot where professional traders often enter.
🔑 Core Logic
EMA Alignment → Trend defined by EMA21 > EMA34 > EMA55 (bullish) or EMA21 < EMA34 < EMA55 (bearish).
Cross Detection → Signals are only armed after a fresh EMA cross.
Retest Entry → Buy/Sell signals fire only on the first retest of EMA21, with trend still intact.
Pro Filters →
📊 Higher Timeframe Confirmation: Aligns signals with larger trend.
📈 ATR Volatility Filter: Blocks weak signals in low-vol chop.
📏 EMA Spread Filter: Ignores tiny “fake crosses.”
🕯️ Price Action Filter: Requires a proper wick rejection for valid entries.
🚀 Why Use Triple Tap Sniper?
✅ Filters out most false signals from sideways markets.
✅ Focuses only on clean trend continuations after pullbacks.
✅ Beginner-friendly visuals (Buy/Sell labels) + alert-ready for automation.
✅ Flexible: works across multiple timeframes & asset classes (stocks, crypto, forex).
⚠️ Notes
This is a signal indicator, not a full strategy. For backtesting and optimization, convert to a strategy and adjust filters per market/timeframe.
No indicator guarantees profits — use with sound risk management.

Perfect Price-Anchored % Fib Grid This indicator generates support and resistance levels anchored to a fixed price of your choice.
You can also specify a percentage for the indicator to calculate potential highs and lows.
Commonly used values are 3.5% or 7%, as well as smaller decimal versions like 0.35% or 0.7%, depending on the volatility you expect.
In addition, the indicator can highlight potential stop-run levels in multiples of 27 — ranging from 0 up to 243. This automatically places the 243 GB range directly onto your chart.
The tool is versatile and can be applied not only to equities, but also to ES futures and Forex markets.

Sentinel 5 — OHL daybreak signals [KedArc Quant]Overview
Sentinel 5 plots the first-bar high/low of each trading session and gives clean, rules-based signals in two ways:
1) OHL Setups at the close of the first bar (Open equals/near High for potential short; Open equals/near Low for potential long).
2) Breakout Signals later in the session when price breaks the first-bar High/Low, with optional body/penetration filters.
Basic workflow
1. Wait for the first session bar to finish.
*If O≈H (optionally by proximity) → short setup. •
*If O≈L → long setup. • If neither happens, optionally allow later breakouts.
2. Optional: Act only on breakouts that penetrate a minimum % of that bar’s range/body.
3. Skip the day automatically if the first bar is abnormally large (marubozu-like / extreme ATR / outsized vs yesterday).
Signals & Markers
Markers on the chart:
▲ O=L (exact) / O near L (proximity) – long setup at first-bar close.
▼ O=H (exact) / O near H (proximity) – short setup at first-bar close.
▲ Breakout Long – later bar breaks above first-bar High meeting your penetration rule.
▼ Breakout Short – later bar breaks below first-bar Low meeting your penetration rule.

ATR% | Volatility NormalizerThis indicator measures true volatility by expressing the Average True Range (ATR) as a percentage of price. Unlike basic ATR plots, which show raw values, this version normalizes volatility to make it directly comparable across instruments and timeframes.
How it works:
Uses True Range (High–Low plus gaps) to capture actual market movement.
Normalizes by dividing ATR by the chosen price base (default: Close).
Multiplies by 100 to output a clean ATR% line.
Smoothing is flexible: choose from RMA, SMA, EMA, or WMA.
Optional Feature:
For comparison, you can toggle an auxiliary line showing the average absolute close-to-close % move, highlighting the difference between simplified and true volatility.
Why use it:
Track regime shifts: identify when volatility expands or contracts in % terms.
Compare volatility across different markets (equities, crypto, forex, commodities).
Integrate into risk management: position sizing, stop placement, or volatility filters for entries.
Interpretation:
Rising ATR% → expanding volatility, potential breakouts or unstable ranges.
Falling ATR% → contracting volatility, possible consolidation or range-bound conditions.
Sudden spikes → market “shocks” worth paying attention to.

Dynamic Chandelier Exit Trader [KedArc Quant])Dynamic Chandelier Exit Trader (DCET)
The Dynamic Chandelier Exit Trader (DCET) builds upon the classical Chandelier Exit indicator by combining volatility-based stop placement with risk-reward exit logic. It is designed to provide clear buy/sell flip signals, making it adaptable across multiple trading environments.
Market Suitability
The DCET is most effective under the following market conditions:
1. Trending Markets (Upward or Downward)
- Strong performance when price is in a clear directional trend.
- Buy signals align with uptrends, sell signals align with downtrends.
- Works well on stocks, forex pairs, and crypto during trending phases.
2. Breakout Environments:
- Captures moves when price breaks out of consolidations.
- ATR-based stop dynamically adjusts to volatility expansion.
- Effective for traders who like catching the first move after breakouts.
3. Sideways / Range-Bound Markets:
- DCET tends to generate more frequent flip signals in sideways conditions.
- May lead to whipsaws, but can still be used with reduced ATR length or by combining with a trend filter (e.g., moving average direction).
4. All Markets (with Adjustments):
- Works universally but requires tuning.
- In highly volatile markets (e.g., crypto), a higher ATR multiplier may reduce false signals.
- In stable, slower-moving markets (e.g., large-cap equities), smaller ATR multipliers improve responsiveness.
ATR Extension from Moving Average, with Robust Sigma Bands
# ATR Extension from Moving Average, with Robust Sigma Bands
**What it does**
This indicator measures how far price is from a selected moving average, expressed in **ATR multiples**, then overlays **robust sigma bands** around the long run central tendency of that extension. Positive values mean price is extended above the MA, negative values mean price is extended below the MA. The signal adapts to volatility through ATR, which makes comparisons consistent across symbols and regimes.
**Why it can help**
* Normalizes distance to an MA by ATR, which controls for changing volatility
* Uses the **bar’s extreme** against the MA, not just the close, so it captures true stretch
* Computes a **median** and **standard deviation** of the extension over a multi-year window, which yields simple, intuitive bands for trend and mean-reversion decisions
---
## Inputs
* **MA length**: default 50, options 200, 64, 50, 20, 9, 4, 3
* **MA timeframe**: Daily or Weekly. The MA is computed on the chosen higher timeframe through `request.security`.
* **MA type**: EMA or SMA
* **Years lookback**: 1 to 10 years, default 5. This sets the sample for the median and sigma calculation, `years * 365` bars.
* **Line width**: visual width of the plotted extension series
* **Table**: optional on-chart table that displays the current long run **median** and **sigma** of the extension, with selectable text size
**Fixed parameters in this release**
* **ATR length**: 20 on the daily timeframe
* **ATR type**: classic ATR. ADR percent is not enabled in this version.
---
## Plots and colors
* **Main plot**: “Extension from 50d EMA” by default. Value is in **ATR multiples**.
* **Reference lines**:
* `median` line, black dashed
* +2σ orange, +3σ red
* −2σ blue, −3σ green
---
## How it is calculated
1. **Moving average** on the selected higher timeframe: EMA or SMA of `close`.
2. **Extreme-based distance** from MA, as a percent of price:
* If `close > MA`, use `(high − MA) / close * 100`
* Else, use `(low − MA) / close * 100`
3. **ATR percent** on the daily timeframe: `ATR(20) / close * 100`
4. **ATR multiples**: extension percent divided by ATR percent
5. **Robust center and spread** over the chosen lookback window:
* Center: **median** of the ATR-multiple series
* Spread: **standard deviation** of that series
* Bands: center ± 1σ, 2σ, 3σ, with 2σ and 3σ drawn
This design yields an intuitive unit scale. A value of **+2.0** means price is about 2 ATR above the selected MA by the most stretched side of the current bar. A value of **−3.0** means roughly 3 ATR below.
---
## Practical use
* **Trend continuation**
* Sustained readings near or above **+1σ** together with a rising MA often signal healthy momentum.
* **Mean reversion**
* Spikes into **±2σ** or **±3σ** can identify stretched conditions for fade setups in range or late-trend environments.
* **Regime awareness**
* The **median** moves slowly. When median drifts positive for many months, the market spends more time extended above the MA, which often marks bullish regimes. The opposite applies in bearish regimes.
**Notes**
* The MA can be set to Weekly while ATR remains Daily. This is deliberate, it keeps the normalization stable for most symbols.
* On very short intraday charts, the extension remains meaningful since it references the session’s extreme against a higher-timeframe MA and a daily ATR.
* Symbols with short histories may not fill the lookback window. Bands will adapt as data accrues.
---
## Table overlay
Enable **Table → Show** to see:
* “ATR from \”
* Current **median** and **sigma** of the extension series for your lookback
---
## Recommended settings
* **Swing equities**: 50 EMA on Daily, 5 to 7 years
* **Index trend work**: 200 EMA on Daily, 10 years
* **Position trading**: 20 or 50 EMA on Weekly MA, 5 to 10 years
---
## Interpretation examples
* Reading **+2.7** with price above a rising 50 EMA, near prior highs
* Strong trend extension, consider pyramiding in trend systems or waiting for a pullback if you are a mean-reverter.
* Reading **−2.2** into multi-month support with flattening MA
* Stretch to the downside that often mean-reverts, size entries based on your system rules.
---
## Credits
The concept of measuring stretch from a moving average in ATR units has a rich community history. This implementation and its presentation draw on ideas popularized by **Jeff Sun**, **SugarTrader**, and **Steve D Jacobs**. Thanks to each for their contributions to ATR-based extension thinking.
---
## License
This script and description are distributed under **MPL-2.0**, consistent with the header in the source code.
---
## Changelog
* **v1.0**: Initial public release. Daily ATR normalization, EMA or SMA on D or W timeframe, robust median and sigma bands, optional table.
---
## Disclaimer
This tool is for educational use only. It is not financial advice. Always test on your own data and strategies, then manage risk accordingly.

ATR SL/TPStop Loss Finder ATR
A Stop Loss Finder ATR indicator is a dynamic risk management tool leveraging the Average True Range (ATR) to identify and track optimal stop-loss levels based on current market volatility.
A stop hunt indicator is a technical tool designed to identify potential instances where large market participants, often referred to as "smart money," deliberately move the price to trigger a large number of stop-loss orders, creating a temporary price distortion before reversing the trend. These indicators aim to help traders detect these events to either avoid being stopped out or to enter trades in the direction of the anticipated reversal.
For example, a long wick below support with high volume may signal a bullish stop-hunt , indicating that the price has been driven down to trigger sell-stop orders before reversing upward. Conversely, a long wick above resistance with high volume may signal a bearish stop-hunt , suggesting the price was pushed up to trigger buy-stop orders before reversing downward. The presence of such wicks is often associated with candlestick patterns like hammers or shooting stars.
Unlike fixed stop-losses, this indicator adapts its distance from the current price using a customizable ATR multiplier, ensuring that stop-loss levels are neither too tight (prone to being triggered by normal market noise) nor too wide (exposing capital to excessive risk) . The core function calculates the true range—considering the current high-low range, gaps up, and gaps down—over a user-defined period (typically 14 bars), then applies a multiplier to generate a volatility-adjusted stop-loss distance . This approach allows the indicator to dynamically widen stops during high-volatility periods and tighten them during calm markets, providing a more responsive and context-aware exit strategy.
EMA多空趋势信号The EMA multi-period moving average combination retains the Fibonacci sequence 144 for moving support and resistance. It also integrates 1ATR to facilitate users to set take-profit and stop-loss.
Range TableThe Range Table indicator calculates and displays the Daily Average True Range (ATR), the current day's True Range (TR), and two customizable ATR percentage values in a clean table format. It provides values in ticks, points, and USD, helping traders set stop-loss buffers based on market volatility.
**Features:**
- Displays the Daily ATR (14-period) and current day's True Range (TR) with its percentage of the Daily ATR.
- Includes two customizable ATR percentages (default: 75% and 10%, with the second disabled by default).
- Shows values in ticks, points, and USD based on the symbol's tick size and point value.
- Customizable table position, background color, text color, and font size.
- Toggle visibility for the table and percentage rows via input settings.
**How to Use:**
1. Add the indicator to your chart.
2. Adjust the table position, colors, and font size in the input settings.
3. Enable or disable the 75% and 10% ATR rows or customize their percentages.
4. Use the displayed values to set stop-loss or take-profit levels based on volatility.
**Ideal For:**
- Day traders and swing traders looking to set volatility-based stop-losses.
- Users analyzing tick, point, and USD-based risk metrics.
**Notes:**
- Ensure your chart is set to a timeframe that aligns with the daily ATR calculations.
- USD values are approximate if `syminfo.pointvalue` is unavailable.
Developed by FlyingSeaHorse.

[Top] Simple ATR TP/SLSimple TP/SL from ATR (Locked per Bar) - Advanced Position Management Tool
What This Indicator Does:
Automatically calculates and displays Take Profit (TP) and Stop Loss (SL) levels based on Average True Range (ATR)
Locks ATR values and direction signals at the start of each bar to prevent repainting and provide consistent levels
Offers multiple direction detection modes including real-time candle-based positioning for dynamic trading approaches
Displays entry, TP, and SL levels as clean horizontal lines that extend from the current bar
Original Features That Make This Script Unique:
Bar-Locked ATR System: ATR values are captured and frozen at bar open, ensuring levels remain stable throughout the bar's progression
Multi-Modal Direction Detection: Four distinct modes for determining TP/SL positioning - Trend Following (EMA-based), Bullish Only, Bearish Only, and real-time Candle Based
Real-Time Candle Flipping: In Candle Based mode, TP/SL levels flip immediately when the current candle changes from bullish to bearish or vice versa
Persistent Line Management: Uses efficient line object management to prevent ghost lines and maintain clean visual presentation
Flexible Base Price Selection: Choose between Open (static), Close (dynamic), or midpoint (H+L)/2 for entry level calculation
How The Algorithm Works:
ATR Calculation: Captures ATR value at each bar open using specified length parameter, maintaining consistency throughout the bar
Direction Determination: Uses different methods based on selected mode - EMA crossover for trend following, or real-time candle color for dynamic positioning
Level Calculation: TP level = Base Price + (Direction × TP Multiplier × ATR), SL level = Base Price - (Direction × SL Multiplier × ATR)
Visual Management: Creates persistent line objects once, then updates their positions every bar for optimal performance
Direction Modes Explained:
Trend Following: Uses 5-period and 12-period EMA relationship to determine trend direction (locked at bar open)
Bullish Only: Always places TP above and SL below entry (traditional long setup)
Bearish Only: Always places TP below and SL above entry (traditional short setup)
Candle Based: Dynamically adjusts based on current candle direction - flips in real-time as candle develops
Key Input Parameters:
ATR Length: Period for ATR calculation (default 14) - longer periods provide smoother volatility measurement
TP Multiplier: Take profit distance as multiple of ATR (default 1.0) - higher values target larger profits
SL Multiplier: Stop loss distance as multiple of ATR (default 1.0) - higher values allow more room for price movement
Base Price: Reference point for level calculations - Open for static entry, Close for dynamic tracking
Direction Mode: Method for determining whether TP goes above or below entry level
How To Use This Indicator:
For Position Sizing: Use the displayed SL distance to calculate appropriate position size based on your risk tolerance
For Entry Timing: Wait for price to approach the entry level before taking positions
For Risk Management: Set your actual stop loss orders at or near the displayed SL level
For Profit Taking: Use the TP level as initial profit target, consider scaling out at this level
Mode Selection: Choose Candle Based for scalping and quick reversals, Trend Following for swing trading
Visual Style Customization:
Line Colors: Customize TP line color (default teal) and SL line color (default orange) for easy identification
Line Widths: Adjust TP/SL line thickness (1-5) and entry line thickness (1-3) for visibility preferences
Clean Display: Lines extend 3 bars forward from current bar and update position dynamically
Best Practices:
Use on clean charts without multiple overlapping indicators for clearest visual interpretation
Combine with volume analysis and key support/resistance levels for enhanced decision making
Adjust ATR length based on your trading timeframe - shorter for scalping, longer for position trading
Test different TP/SL multipliers based on the volatility characteristics of your chosen instruments
Consider using Trend Following mode during strong trending periods and Candle Based during ranging markets

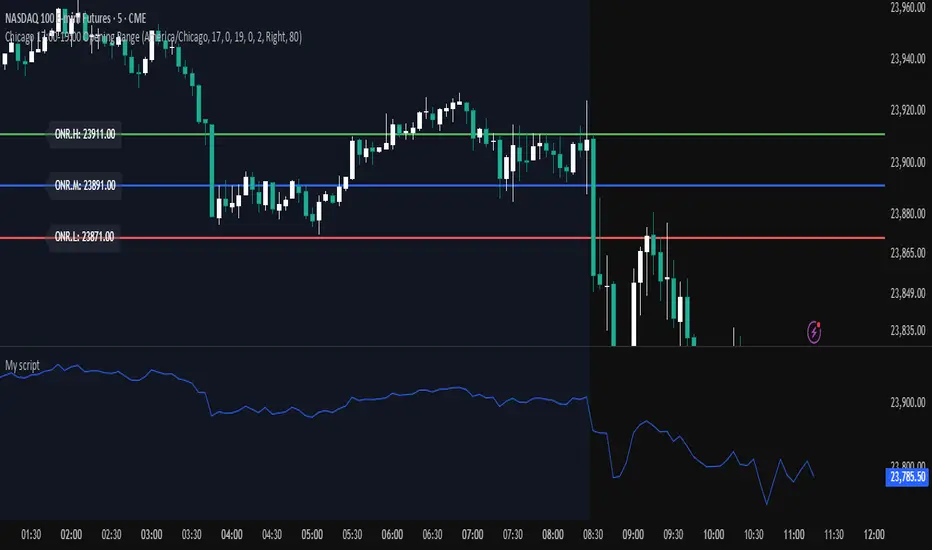
Chicago 17:00-19:00 Overnight RangeThis indicator will map out range high and range low of previous 17:00 - 19:00 of the chart. It can also display mid range if needed
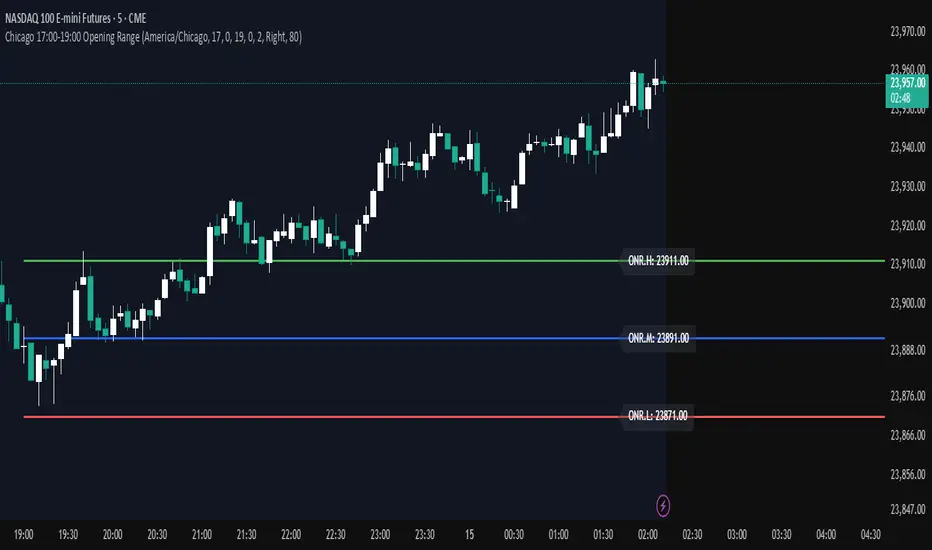
Opening Range — Chicago 17:00-19:00 (Customizable)Maps opening 2 hour range of Chicago timezone with the range high range low and medium zone. It can be customized to fit your needs
ATR x2 AUTODescription:
This indicator automatically plots ATR-based horizontal levels for each of the most recent candles, helping traders visualize potential stop-loss hunting zones, breakout areas, or price reaction points.
It works by taking the Average True Range (ATR) over a customizable period and multiplying it by a user-defined factor (default: ×2). For each of the last N candles (default: 5), it calculates and draws:
Below green candles (bullish) → A horizontal line placed ATR × multiplier below the candle’s low.
Above red candles (bearish) → A horizontal line placed ATR × multiplier above the candle’s high.
Doji candles → No line is drawn.
Each line extends to the right indefinitely, allowing traders to monitor how price reacts when returning to these ATR-based levels. This makes the tool useful for:
Identifying likely stop-loss clusters below bullish candles or above bearish candles.
Anticipating liquidity sweeps and fakeouts.
Supporting breakout or reversal strategies.
Key Features:
Customizable ATR length, multiplier, number of recent candles, and line thickness.
Separate colors for bullish and bearish candle levels.
Automatic real-time updates for each new bar.
Clean overlay on the main price chart.
Inputs:
ATR Length → Period used for ATR calculation.
Multiplier → Factor applied to the ATR distance.
Number of Candles → How many recent candles to track.
Line Thickness and Colors → Full visual customization.
Usage Tip:
These levels can be combined with key market structure points such as support/resistance, trendlines, or the 200 EMA to anticipate high-probability price reactions.
