Dynamic EnvelopeA dynamic envelope is designed to build an actual envelope that consider the volatility of a trading instrument.
A dynamic envelope is an ideal counter-trend indicator, it takes into account the nature of the movement of the instrument. At the same time, it does not require adjustment of parameters over time, it adjusts itself to volatility.
The indicator can be effectively used on any markets and instruments.
Динамический конверт предназначен для построения актуального конверта, который учитывает волатильность торгового инструмента.
Динамический конверт - это идеальный контртрендовый индикатор, он учитывает характер движения инструмента. При этом он не требует подгонки параметров со временем, он сам подстраивается под волатильность.
Индикатор можно эффективно использовать на любых рынках и инструментах.
Dynamic

WMA DynamicDemonstration of a new feature that allows to change lookback period dynamically, used with WMAs. Rather than WMA any one can be used here (SMA, Alma,...) as long as its second argument supports dynamic change. If not, you have to use your own implementation of MA.

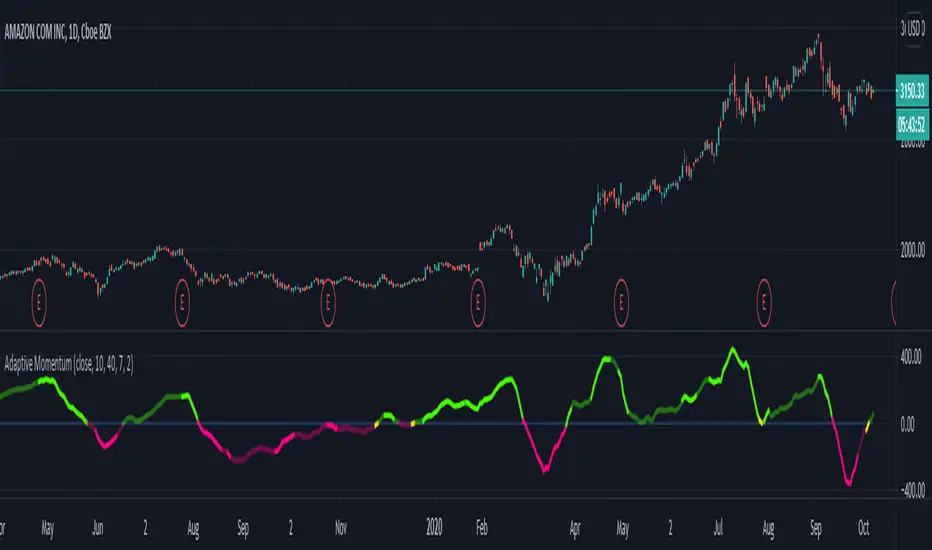
Adaptive MomentumAdaptive momentum indicator that uses the NEW Dynamic Length Arguments! Shows how to use volatility to shorten or lengthen the momentum period.
Based on pinescript blog example but with my own modifications.
Bright Green: Sharp movement above zero line
Bright Red: Sharp movement below zero line
Light Green: Slower movement above zero line
Light Red: Slower movement below zero line.
Yellow: Reversal might occur (near the zero line either side).
Thumb rule: Below zero line - SELL. Above zero line - BUY
McGinley Dynamic (Improved) - John R. McGinley, Jr.For all the McGinley enthusiasts out there, this is my improved version of the "McGinley Dynamic", originally formulated and publicized in 1990 by John R. McGinley, Jr. Prior to this release, I recently had an encounter with a member request regarding the reliability and stability of the general algorithm. Years ago, I attempted to discover the root of it's inconsistency, but success was not possible until now. Being no stranger to a good old fashioned computational crisis, I revisited it with considerable contemplation.
I discovered a lack of constraints in the formulation that either caused the algorithm to implode to near zero and zero OR it could explosively enlarge to near infinite values during unusual price action volatility conditions, occurring on different time frames. A numeric E-notation in a moving average doesn't mean a stock just shot up in excess of a few quintillion in value from just "10ish" moments ago. Anyone experienced with the usual McGinley Dynamic, has probably encountered this with dynamically dramatic surprises in their chart, destroying it's usability.
Well, I believe I have found an answer to this dilemma of 'susceptibility to miscalculation', to provide what is most likely McGinley's whole hearted intention. It required upgrading the formulation with two constraints applied to it using min/max() functions. Let me explain why below.
When using base numbers with an exponent to the power of four, some miniature numbers smaller than one can numerically collapse to near 0 values, or even 0.0 itself. A denominator of zero will always give any computational device a horribly bad day, not to mention the developer. Let this be an EASY lesson in computational division, I often entertainingly express to others. You have heard the terminology "$#|T happens!🙂" right? In the programming realm, "AnyNumber/0.0 CAN happen!🤪" too, and it happens "A LOT" unexpectedly, even when it's highly improbable. On the other hand, numbers a bit larger than 2 with the power of four can tremendously expand rapidly to the numeric limits of 64-bit processing, generating ginormous spikes on a chart.
The ephemeral presence of one OR both of those potentials now has a combined satisfactory remedy, AND you as TV members now have it, endowed with the ever evolving "Power of Pine". Oh yeah, this one plots from bar_index==0 too. It also has experimental settings tweaks to play with, that may reveal untapped potential of this formulation. This function now has gain of function capabilities, NOT to be confused with viral gain of function enhancements from reckless BSL-4 leaking laboratories that need to be eternally abolished from this planet. Although, I do have hopes this imd() function has the potential to go viral. I believe this improved function may have utility in the future by developers of the TradingView community. You have the source, and use it wisely...
I included an generic ema() plot for a basic comparison, ultimately unveiling some of this algorithm's unique characteristics differing on a variety of time frames. Also another unconstrained function is included to display some the disparities of having no limitations on a divisor in the calculation. I strongly advise against the use of umd() in any published script. There is simply just no reason to even ponder using it. I also included notes in the script to warn against this. It's funny now, but some folks don't always read/understand my advisories... You have been warned!
NOTICE: You have absolute freedom to use this source code any way you see fit within your new Pine projects, and that includes TV themselves. You don't have to ask for my permission to reuse this improved function in your published scripts, simply because I have better things to do than answer requests for the reuse of this simplistic imd() function. Sufficient accreditation regarding this script and compliance with "TV's House Rules" regarding code reuse, is as easy as copying the entire function as is. Fair enough? Good! I have a backlog of "computational crises" to contend with, including another one during the writing of this elaborate description.
When available time provides itself, I will consider your inquiries, thoughts, and concepts presented below in the comments section, should you have any questions or comments regarding this indicator. When my indicators achieve more prevalent use by TV members, I may implement more ideas when they present themselves as worthy additions. Have a profitable future everyone!

Dynamic Range here comes open source version of notorious JFT Indicator ( the indicator access you can get in some bucks ) on various telegram channels however they will not give code.
Now how it works
1. 2 ranges derived from indicator are supposed to be a consolidation zone and any close above or below is supposed to give a good move.
2. I personally consider it as may be addition to price analysis. ( i don't believe much in indicators,even simple MA gives fruitful results when there is good move in market )
3. Range can be drawn on chart with various resolution ( Daily/Monthly/Weekly )
PS: I coded myself based on data analysis shown by access only indicator. In case you use it for your publication don't forget to give credits.
Thanks,
daytraderph

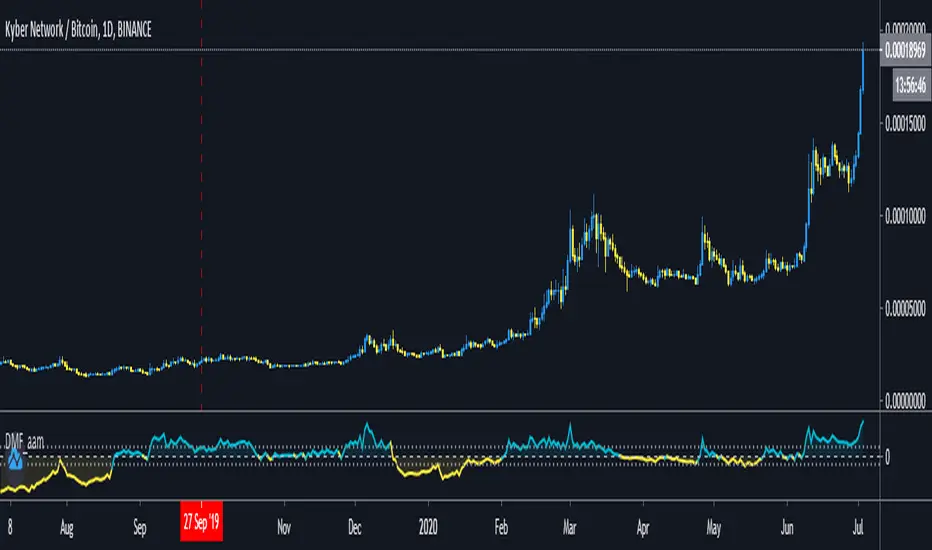
Dynamic Money Flow with color switch [aamonkey]"Dynamic Money Flow is a volume indicator based on Marc Chaikin's Money Flow with a few improvements.
It can be used to confirm break-outs and trends." (RezzaHmt)
This is the script from RezzaHmt called "Dynamic Money Flow".
All I did is the color change of the line because I find it easier to read that way.
Here you can find the original script explaining the theory behind this indicator:
Automatic Fibonacci Pivot Point S/R LevelsThis is a great tool to find confluences between Fibonacci Pivot point on various time frames.
Fib Pivots used
23.6%
38.2%
50%
61.8%
76.4%
100%
127.2%
141.4%
161.8%
200%
If price is between two levels on the update the lines shift
Yearly Pivots shown on 1m - Daily timeframes
PIvots recalculate on every day
Monthly pivots show on 1m - 60m timeframes
Pivots recalculate every hour
Weekly pivots show on 1m - 15m timeframes
Pivots recalculate every 30m
There is a lot of code but it got the job done.
It would easy to interchange if you prefer different types of pivots
It would be easy to add an on/off if you dont want so many levels on your smaller time frames
If anyone can streamline it please do

Combo Strategy 123 Reversal & Dynamic Pivot Point This is combo strategies for get a cumulative signal.
First strategy
This System was created from the Book "How I Tripled My Money In The
Futures Market" by Ulf Jensen, Page 183. This is reverse type of strategies.
The strategy buys at market, if close price is higher than the previous close
during 2 days and the meaning of 9-days Stochastic Slow Oscillator is lower than 50.
The strategy sells at market, if close price is lower than the previous close price
during 2 days and the meaning of 9-days Stochastic Fast Oscillator is higher than 50.
Second strategy
This Pivot points is calculated on the current day.
Pivot points simply took the high, low, and closing price from the previous period and
divided by 3 to find the pivot. From this pivot, traders would then base their
calculations for three support, and three resistance levels. The calculation for the most
basic flavor of pivot points, known as ‘floor-trader pivots’, along with their support and
resistance levels.
WARNING:
- For purpose educate only
- This script to change bars colors.
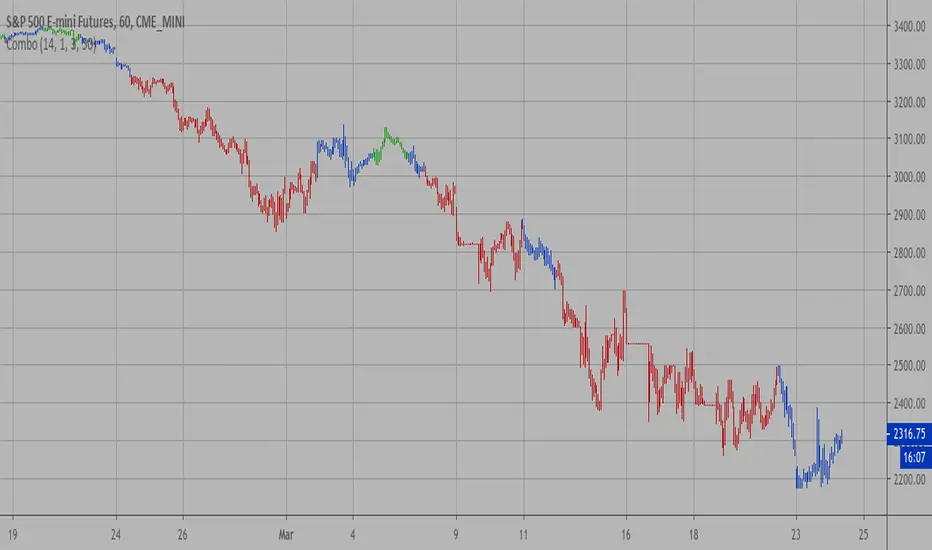
Combo Strategy 123 Reversal & Dynamic Momentum Index This is combo strategies for get a cumulative signal.
First strategy
This System was created from the Book "How I Tripled My Money In The
Futures Market" by Ulf Jensen, Page 183. This is reverse type of strategies.
The strategy buys at market, if close price is higher than the previous close
during 2 days and the meaning of 9-days Stochastic Slow Oscillator is lower than 50.
The strategy sells at market, if close price is lower than the previous close price
during 2 days and the meaning of 9-days Stochastic Fast Oscillator is higher than 50.
Second strategy
This indicator plots Dynamic Momentum Index indicator. The Dynamic Momentum
Index (DMI) was developed by Tushar Chande and Stanley Kroll. The indicator
is covered in detail in their book The New Technical Trader.
The DMI is identical to Welles Wilder`s Relative Strength Index except the
number of periods is variable rather than fixed. The variability of the time
periods used in the DMI is controlled by the recent volatility of prices.
The more volatile the prices, the more sensitive the DMI is to price changes.
In other words, the DMI will use more time periods during quiet markets, and
less during active markets. The maximum time periods the DMI can reach is 30
and the minimum is 3. This calculation method is similar to the Variable
Moving Average, also developed by Tushar Chande.
The advantage of using a variable length time period when calculating the RSI
is that it overcomes the negative effects of smoothing, which often obscure short-term moves.
The volatility index used in controlling the time periods in the DMI is based
on a calculation using a five period standard deviation and a ten period average
of the standard deviation.
WARNING:
- For purpose educate only
- This script to change bars colors.

Support Resistance - DynamicThis is Dynamic Support / Resistance script.
How it Works?
It finds Pivot Points and creates channels for each Pivot Point. Channel size is calculated by (Highest - Lowest) * %Channel_size in Loopback Period. After creating channels it calculates that how many Pivot Points in the channels. more Pivot Points in channel means stronger Support/Resistance. in the option menu there is S/R Strength, this is the minimum number of Pivot Points that each channel must contain to be S/R. calculation starts from last pivot point and go back for "loopback period" which is 300 by default. so last Pivot Points have more priority. Finally after calculating Support/Resistance it draws lines.
Number of Support/Resistance line is Dynamic and up to 20 lines, that means number of lines changes dynamically. you can see how the script puts Suppport/Resistance lines dynamically by "Replay" button. (if I have time I will try to put a video)
Currently the scripts checks up to 40 pivot points in loopback period. it shows up to 20 S/Rs only for visible area in the chart.
There is option to Show S/R lines as Solid, Dotted or Dashed.
Enjoy!

ATR based Stop and Take-Profit levels in realtime Little tool to quickly identify stops and take-profit levels based on Average True Range. User can change ATR multipiers, as well as the ATR length used. Green and red lines show these levels; plot is visible over last 8 bars only to reduce clutter. Label showing the current ATR, up above the last bar

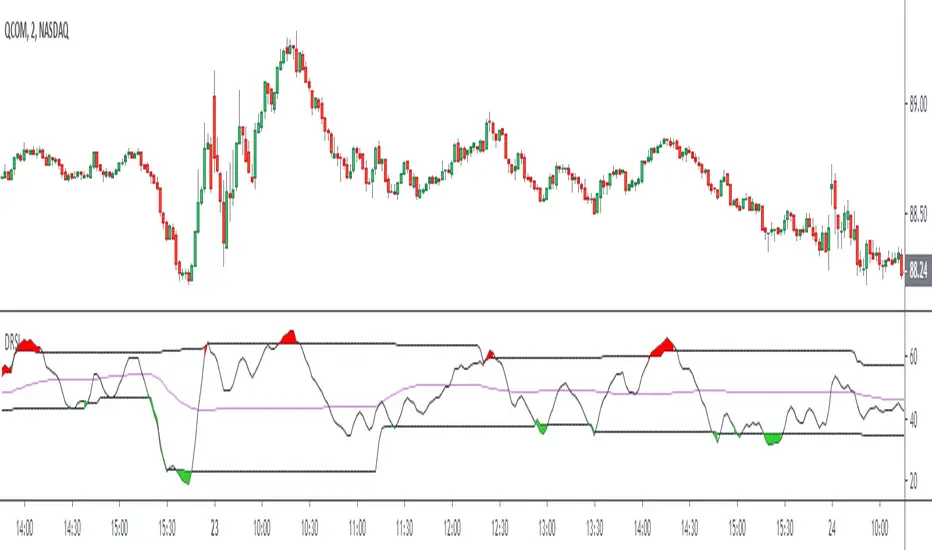
Dynamic RSIThe Dynamic RSI indicator is a kind of exponential RSI. The overbought and oversold levels (respectively HiLine and LoLine) are calculated according to the recent highest and lowest values of the Dynamic RSI line.
How To Use Dynamic ZonesExample of how to apply and use Dynamic Zones with an indicator by injecting it's source into my adaptation of the original idea by Leo Zamansky, Ph.D., and David Stendahl.
• Load your desired oscillating indicator on your chart (CCI, RSI, etc).
• Load my "How To Use Dynamic Zones" indicator on your chart.
• In the "How To Use Dynamic Zones" indicator settings choose your desired oscillating indicator as the Oscillator Source.
You will now have dynamic overbought and oversold levels. I have also included alerts which may be used to indicate when these conditions occur.
If desired you may repeat the above process by loading additional indicators along with additional copies of my indicator to use with each oscillator.
Oscillator Source: CLOSE uses your chosen indicator as a source or you may use price as a source
Sample Length: 70 uses number of previous values for evaluating
Hi is Above X% of Sample: 88 sets overbought zone
Lo is Below X% of Sample: 88 sets oversold zone
The simplest explanation of what these default settings are doing is that they take 70 previous values of your chosen indicator, then create an overbought level that is above 88% of those previous values and an oversold level that is below 88% of those previous values. As new bars form the levels are dynamically reevaluated and updated.
---
"This investing style follows a very simple form of logic: Enter the market only when an oscillator has moved far above or below traditional trading levels. However, these oscillator driven systems lack the ability to evolve with the market because they use fixed buy and sell zones. Traders typically use one set of buy and sell zones for a bull market and substantially different zones for a bear market. And therein lies the problem.
Once traders begin introducing their market opinions into trading equations, by changing the zones, they negate the system’s mechanical nature. The objective is to have a system automatically define its own buy and sell zones and thereby profitably trade in any market — bull or bear. Dynamic zones offer a solution to the problem of fixed buy and sell zones for any oscillator-driven system."
Reference: Stocks & Commodities V15:7 (306-310): Dynamic Zones by Leo Zamansky, Ph.D., and David Stendahl
---
NOTICE: This is an example script and not meant to be used as an actual strategy. By using this script or any portion thereof, you acknowledge that you have read and understood that this is for research purposes only and I am not responsible for any financial losses you may incur by using this script!

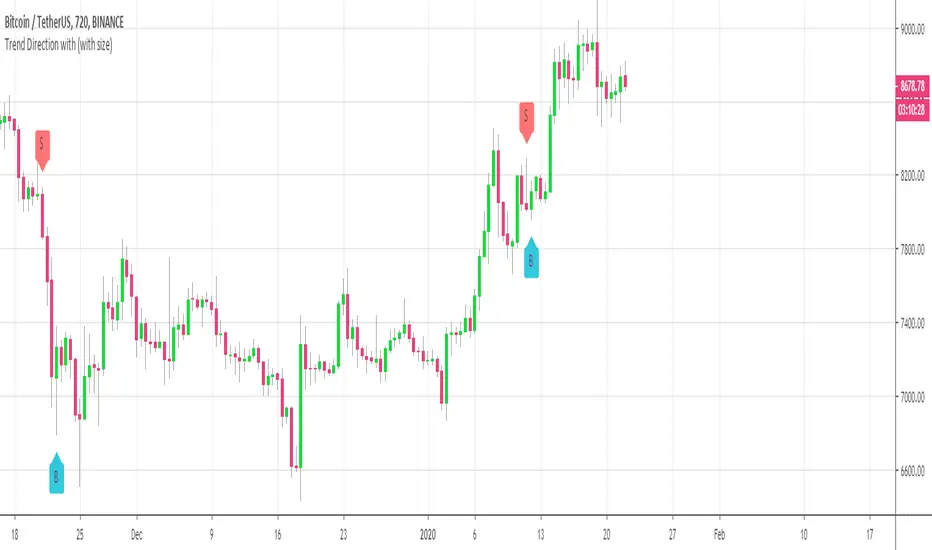
Customizable Trend Direction (Open-Source)Hello everyone
I received a ton of requests for this script so I decided to share it
I did it for a client who didn't want to pay (you can all blame... or even thank him for this script) in the end and I don't want to sell it on my website.
Not because it's not interesting but because my website will be a place to showcase and rent the Algorithm Builders mostly
What is it about?
Basically, it shows how you could convert a plotshape into a label.new object. Very interesting if you want someday to convert your V3 script into V4
With this script, it shows that you can in V4 ( but couldn't do in V3 ) do the followings :
- change dynamically the size (from tiny to huge) of any object
- change dynamically the text (from whatever to whatever) of any object
Screenshot of the user interface
imgur.com
Other use cases
I did it with the Trend Direction but could work with anything really.
- Any indicator with a visual signal. You can know personalized from a user interface the text, size and also the vertical shift. I didn't do it for that one but label.new takes a (x,y) coordinates so playing with y is fairly easy to achieve a dynamic vertical shift
- Even with this script Plotchar-How-to-draw-external-symbols-on-a-chart/ but would require to be updated with a label.new object and with a shape.none parameter so that we'll only see the icon/symbol displayed
- The colors also can be change dynamically using presets Presets-Selector-FRIDAY-NIGHT-CHALLENGE/ . If you have an indicator showing a BULLISH and a BEARISH signal, then you could, for instance, configure colors presets according to the timeframe of the chart or the indicator input, etc (sky is the limit ^^)
Be sure to hit the thumbs up at it motivates me to research what Pinescript can offer and share with the community
Dave
____________________________________________________________
- I'm an officially approved PineEditor/LUA/MT4 approved mentor on codementor. You can request a coaching with me if you want and I'll teach you how to build kick-ass indicators and strategies
Jump on a 1 to 1 coaching with me
- You can also hire for a custom dev of your indicator/strategy/bot/chrome extension/python
Function StochRSI Stochastic Relative Strength Index developed by Tushar Chande and Stanley Kroll.
This script has been written to eliminate the period variable.(Integer)
Thus, it can be used comfortably in adaptive period scripts ! (For example : Adaptive Moving Average , KAMA , FAMA .. etc. )
All efforts goes to ChaosTrader () ,
RicardoSantos () ,
Hpotter for barcolor codes (iff) ()
I hope it will help your new ideas . Best regards ! Noldo .

Multi Bar OHLC Compare Panel (Floating Grid)Multi Bar OHLC Compare Panel by RagingRocketBull 2019
version 1.0
This indicator lets you compare OHLCV values from several specified bars. Bars can be dynamic/persistent.
You can also use it as an alternate OHLC panel if you don't like small font of the native TradingView panel.
It uses Pinescript v4 to output data dynamically as string labels in a horiz/vertical grid.
Features:
- Floating Panel with customizable horiz/vertical layout and grid spacing
- Support for up to 5 OHLC bars (highlighted with markers)
- Outputs Bar #/index, OHLCV, Bar Change Value/%, Exchange/Ticker, Timeframe, Timestamp strings
- Dynamic (fixed offset)/Persistent bars (fixed time)
- Show/Hide parts of strings
- Full output string customization, including text size, date/time format and delimiters
- 2 Anchor points for panel offset: cur bar high or range high
- Bar Change can change color
Usage:
- specify at least 1 bar index as OHLC source
- select anchor point to position the panel
- select horiz/vertical grid layout
- adjust horiz/vertical spacing
- customize output strings as needed
Notes:
- this indicator uses Pinescript v3 Compatibity Framework
- both bars 1,2 are required for log scale adjustment to work
- you can't attach the panel to screen's top/bottom and must use offset/anchor because, unlike plotshape, string labels don't support yloc=yloc.top/bottom, only yloc.above/belowbar
- you can't precisely align strings in a grid because there's no label.get_width/height to calculate mid/left points, only get_x/y/text. Alignment will break depending on string length, zoom and change color option on/off
- bar change is rendered as a separate label when change color is enabled (2 panels total) and merged into the main panel when disabled (single panel)
- you can't change the order of strings as playing with the natural order of things isn't the best of ideas
- you can modify the script to compare up to 50 OHLC bars, but do you need that much power? Of course, you do.
- you can't set color/style for string labels in Style UI, so a few extra settings were added.
- bar index is limited to 5000 for free accounts (10000 for paid), will show an error when exceeded, also when it exceeds the total number of bars in history
- in persistent bars mode all bars with index > 0 are considered persistent, bar 0 always remains a dynamic bar
- persistent bars' offset is reset: in replay mode on exit or when price reaches cur bar, or when panel layout is changed from h to v in both replay/realtime modes
- initial pos of each persistent bar relative to the first realtime bar anchor doesn't change during session - new persistent bars introduced during session are attached to the most recent cur bar anchor
P.S. Everything is proceeding as I have foreseen

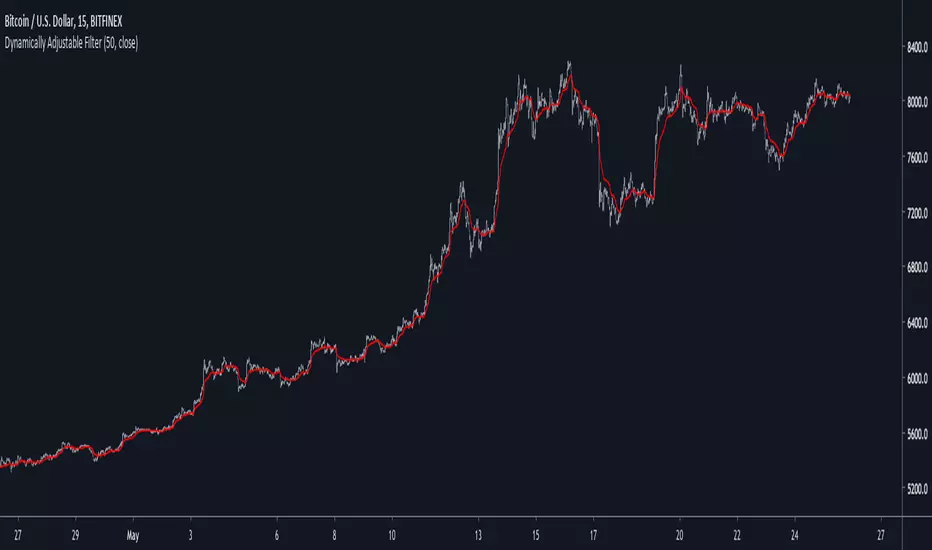
Dynamically Adjustable FilterIntroduction
Inspired from the Kalman filter this indicator aim to provide a good result in term of smoothness and reactivity while letting the user the option to increase/decrease smoothing.
Optimality And Dynamical Adjustment
This indicator is constructed in the same manner as many adaptive moving averages by using exponential averaging with a smoothing variable, this is described by :
x= x_1 + a(y - x_1)
where y is the input price (measurements) and a is the smoothing variable, with Kalman filters a is often replaced by K or Kalman Gain , this Gain is what adjust the estimate to the measurements. In the indicator K is calculated as follow :
K = Absolute Error of the estimate/(Absolute Error of the estimate + Measurements Dispersion * length)
The error of the estimate is just the absolute difference between the measurements and the estimate, the dispersion is the measurements standard deviation and length is a parameter controlling smoothness. K adjust to price volatility and try to provide a good estimate no matter the size of length . In order to increase reactivity the price input (measurements) has been summed with the estimate error.
Now this indicator use a fraction of what a Kalman filter use for its entire calculation, therefore the covariance update has been discarded as well as the extrapolation part.
About parameters length control the filter smoothness, the lag reduction option create more reactive results.
Conclusion
You can create smoothing variables for any adaptive indicator by using the : a/(a+b) form since this operation always return values between 0 and 1 as long as a and b are positive. Hope it help !
Thanks for reading !
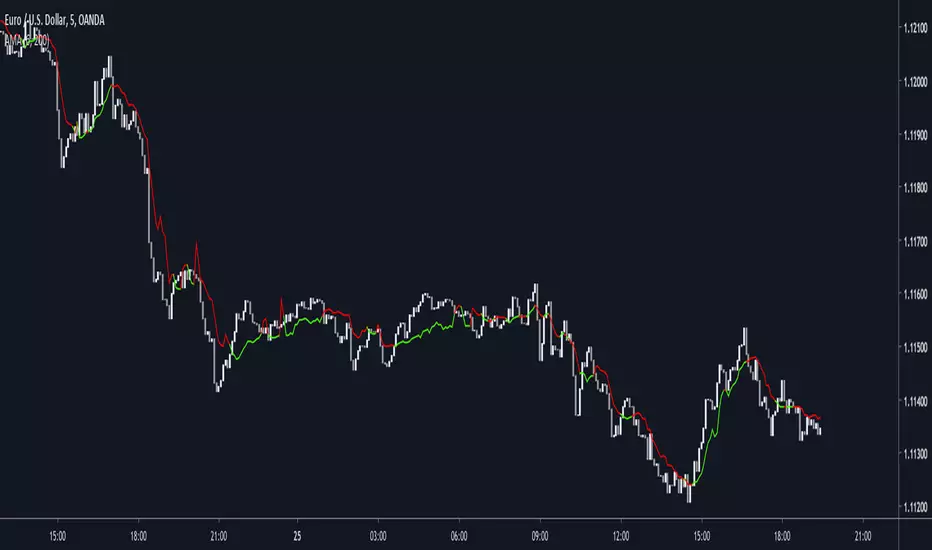
Dynamically Adjustable Moving AverageIntroduction
The Dynamically Adjustable Moving Average (AMA) is an adaptive moving average proposed by Jacinta Chan Phooi M’ng (1) originally provided to forecast Asian Tiger's futures markets. AMA adjust to market condition in order to avoid whipsaw trades as well as entering the trending market earlier. This moving average showed better results than classical methods (SMA20, EMA20, MAC, MACD, KAMA, OptSMA) using a classical crossover/under strategy in Asian Tiger's futures from 2014 to 2015.
Dynamically Adjustable Moving Average
AMA adjust to market condition using a non-exponential method, which in itself is not common, AMA is described as follow :
1/v * sum(close,v)
where v = σ/√σ
σ is the price standard deviation.
v is defined as the Efficacy Ratio (not be confounded with the Efficiency Ratio) . As you can see v determine the moving average period, you could resume the formula in pine with sma(close,v) but in pine its not possible to use the function sma with variables for length, however you can derive sma using cumulation.
sma ≈ d/length where d = c - c_length and c = cum(close)
So a moving average can be expressed as the difference of the cumulated price by the cumulated price length period back, this difference is then divided by length. The length period of the indicator should be short since rounded version of v tend to become less variables thus providing less adaptive results.
AMA in Forex Market
In 2014/2015 Major Forex currencies where more persistent than Asian Tiger's Futures (2) , also most traded currency pairs tend to have a strong long-term positive autocorrelation so AMA could have in theory provided good results if we only focus on the long term dependency. AMA has been tested with ASEAN-5 Currencies (3) and still showed good results, however forex is still a tricky market, also there is zero proof that switching to a long term moving average during ranging market avoid whipsaw trades (if you have a paper who prove it please pm me) .
Conclusion
An interesting indicator, however the idea behind it is far from being optimal, so far most adaptive methods tend to focus more in adapting themselves to market complexity than volatility. An interesting approach would have been to determine the validity of a signal by checking the efficacy ratio at time t . Backtesting could be a good way to see if the indicator is still performing well.
References
(1) J.C.P. M’ng, Dynamically adjustable moving average (AMA’) technical
analysis indicator to forecast Asian Tigers’ futures markets, Physica A (2018),
doi.org
(2) www.researchgate.net
(3) www.ncbi.nlm.nih.gov
Dynamic Support & ResistanceThis indicator paints the background of the chart between 2 EMAs when all 3 given EMAs are in sync.
The default settings are:
Long-term EMA: 200 Period.
Short-term EMA 1: 50 Period.
Short-term EMA 2: 20 Period.
So according to the default settings, when the 20EMA is above the 50EMA, and the 50EMA is above the 200EMA, the area between the 20EMA and the 50EMA will turn green. When the 20EMA is below the 50EMA, and the 50EMA is below the 200EMA, the area will turn red. When the EMAs are all over the place (ie. price is consolidating), the area will be painted white.
You can change the colors in the indicator settings menu. To remove the white background, change the transparency to 100%. Unfortunately pinescript does not allow you to do this using code, otherwise I would have made that a default feature.
Enjoy! Let me know if you have any questions.
Regards,
- Matt

5 Moving AveragesI don't sell indicators only strategies I use for dynamic support and resistance sometimes. www.youtube.com
MgGinley Dynamic Divergence [DW]This is an experimental study designed to visualize momentum and average range by expressing divergences between price and a McGinley Dynamic as a percentage.

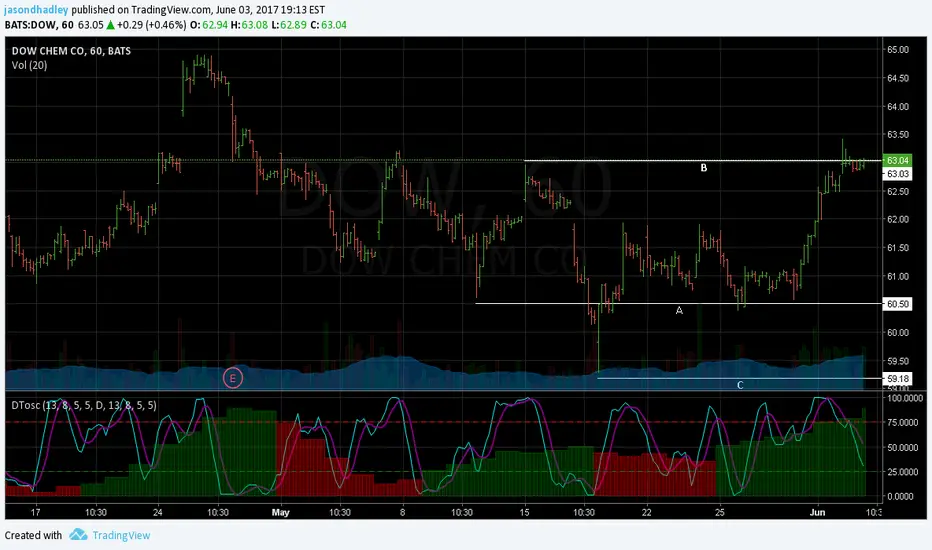
Dynamic Time Oscillator W/ MTF SupportThis script has the option to disable the MTF feature and use it as a plain DTOscillator.
The lines are the fast and slow signals for the current timeframe.
The columns are the second timeframe %K levels.
Green columns signify the second timeframe %K is greater than the second timeframe %D, Red is the reverse of this.
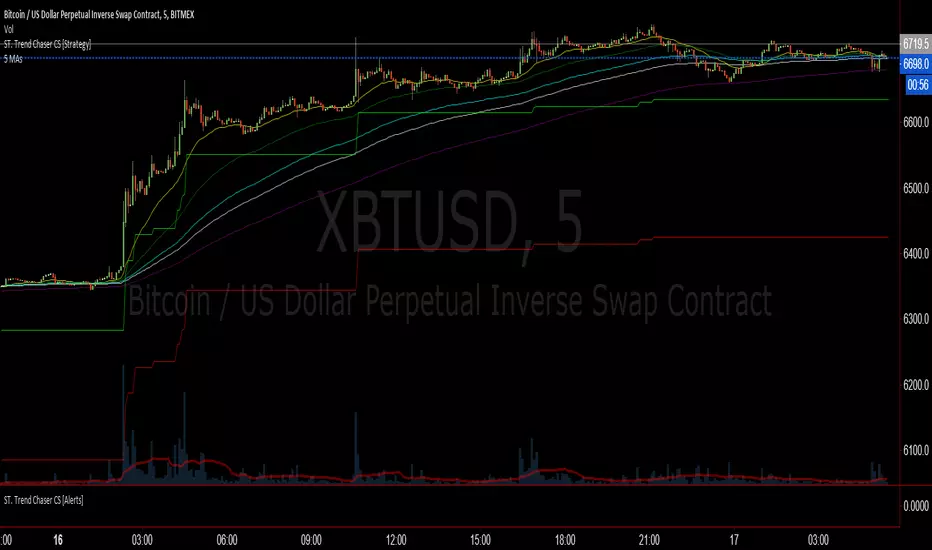
Chaos 2.0This is pure chaos!
I just wanted 1 thing I can put on a chart to try to get a clearer picture of what is going on (and not take up all the indicator spaces a free user is allowed haha)
Many things going on from so many different users
honestly I'm sorry I cant shout out everyone whose code I have ever read and used in another project just for the sake of learning more about pinescript!
As a way of shouting everyone out! (and giving out my most useful and configurable system)
I give you... CHAOS
I originally got an Alligator, AO, and Fractal script from a user ChaosTrader, then realized I love using averages!
I added the MESA (lazybear?) and the McGinley Dynamic Range (sry idk) and a simple 233 SMA.
I also found about something called the www.prorealcode.com another user had created for Pinescript.
I really liked that script so I adapted it to do the same kind of signal printing for circles and squares (crosses and series)
Check it out tell me what you think and how I can make it better for everyone!
thanks all!
Snoop
