Forex SessionThis Trading View script highlights the trading sessions for New York, European, and Asian markets on the chart and adds labels at the start of each session. The script uses Pine Script version 5 and converts local session times to UTC to accurately display the session times regardless of your local Time zone.
Features :
Session Times:
New York: 8:30 AM to 3:00 PM (Eastern Time, GMT-4)
European: 8:00 AM to 4:30 PM (London Time, GMT+1)
Asian: 9:00 AM to 6:00 PM (Tokyo Time, GMT+9)
Background Highlighting: The script shades the background for each session.
New York Session: Blue
European Session: Green
Asian Session: Red
Today's sessions are shaded with 90% opacity.
Tomorrow's sessions are shaded with 70% opacity.
How It Works :
Session Times Conversion: The script converts the session times from local timezones to UTC
using the timestamp function.
Background Coloring: The bgcolor function is used to shade the background for each session.
Forex
Sniper BreakoutThis indicator is based on 3 indicator :=
1) Forex Market Session 2) Ema 200 3) Volume
This indicator is for Forex market ..in Forex market (ex- Eur/Usd ) price often (67%) do rotation in every session means example :let suppose a trade take trade in asian session and have 30 pips stop loss 67 % chance price will come back to entry price after London session or New York session so trade have less chance to make trade without hitting stop loss
in this indicator we are using Forex market session indicator to get session range start to end ..this indicator will only search opportunity in London And New York Session range and that can be customize from input section . user can select time zone and time of session from input section indicator and color of session .
next indicator using 200 length Exponential Moving Average for trend identification .if close price is above 200 Ema means trend is upside moving & if close price is below 200 Ema means price is moving downside .user can change length and source of Ema from input section .
Third and most important part is volume indicator when a session start (Example-London session it keep Look back 6 previous candle and compare volume imbalance between look back candle .look back candle can be customize from input section default look back candle input is (6).
next we are using trade range time to only show trade on certain time because often market convert into trading range so given specific input time it only take trade when volume and price is rising or falling .time range can be selected from input section .
Trade Entry Buy Signal -if price is either London or New York session and price is above 200 Ema and volume not in imbalance last number of candle it give Feb (first entry buy ) we keep save high price of every candle after Feb (label ) signal .if any candle break above Feb label it show a confirm buy signal ..Below in example as we can see
Example Image Buy Signal -
in this above example step -1 we searching imbalance of volume and price as we can see imbalance of volume and price on green candle .next we look price is above 200 ema .next step(2) we got Feb (first entry buy ) signal this is not a confirm buy signal .we save high of candle next candle high close above previous candle high we got confirm buy signal .
Trade Entry Sell Signal - if price is either London or New York session and price is below 200 Ema and volume not in imbalance last number of candle it give Feb (first entry Sell ) we keep save low price of every candle after Fes (label ) signal .if any candle break below Fes label it show a confirm sell signal ..Below in example as we can see
step-1 starting of london session we start getting imbalance between price and volume .price is getting rejected but volume is rising on green candle we got fes (first entry sell signal ).next we save low of fes candle but price close above that low of candle we dont get confirm sell entry next price break below low of previous candle so open a new sell signal ..
Example 3 - No Confirm buy/sell Signal
In this above Image example we did not get any confirm signal...we got first entry buy signal but price did not close high of candle in london session .so that day chance price can go any side ..
Example 4 -Feb signal and later confirm buy entry
in this above example we got imbalance of volume and feb(first entry buy signal) but we dont get any confirm buy signal price is just going high then previous candle ..later we see price crossover high of previous candle we got confirm buy signal
Use Of Indicator - This indicator helps traders identify potential trade setups by signaling the first entry points and confirming them later. It's particularly useful for avoiding getting caught in price rotations and aligning trades with significant volume and price movements. Traders should analyze price action and news before confirming a trade.

strategy_helpersThis library is designed to aid traders and developers in calculating risk metrics efficiently across different asset types like equities, futures, and forex. It includes comprehensive functions that calculate the number of units or contracts to trade, the value at risk, and the total value of the position based on provided entry prices, stop levels, and risk percentages. Whether you're managing a portfolio or developing trading strategies, this library provides essential tools for risk management. Functions also automatically select the appropriate risk calculation method based on asset type, calculate leverage levels, and determine potential liquidation points for leveraged positions. Perfect for enhancing the precision and effectiveness of your trading strategies.
Library "strategy_helpers"
Provides tools for calculating risk metrics across different types of trading strategies including equities, futures, and forex. Functions allow for precise control over risk management by calculating the number of units or contracts to trade, the value at risk, and the total position value based on entry prices, stop levels, and desired risk percentage. Additional utilities include automatic risk calculation based on asset type, leverage level calculations, and determination of liquidation levels for leveraged trades.
calculate_risk(entry, stop_level, stop_range, capital, risk_percent, trade_direction, whole_number_buy)
Calculates risk metrics for equity trades based on entry, stop level, and risk percent
Parameters:
entry (float) : The price at which the position is entered. Use close if you arent adding to a position. Use the original entry price if you are adding to a position.
stop_level (float) : The price level where the stop loss is placed
stop_range (float) : The price range from entry to stop level
capital (float) : The total capital available for trading
risk_percent (float) : The percentage of capital risked on the trade. 100% is represented by 100.
trade_direction (bool) : True for long trades, false for short trades
whole_number_buy (bool) : True to adjust the quantity to whole numbers
Returns: A tuple containing the number of units to trade, the value at risk, and the total value of the position:
calculate_risk_futures(risk_capital, stop_range)
Calculates risk metrics for futures trades based on the risk capital and stop range
Parameters:
risk_capital (float) : The capital allocated for the trade
stop_range (float) : The price range from entry to stop level
Returns: A tuple containing the number of contracts to trade, the value at risk, and the total value of the position:
calculate_risk_forex(entry, stop_level, stop_range, capital, risk_percent, trade_direction)
Calculates risk metrics for forex trades based on entry, stop level, and risk percent
Parameters:
entry (float) : The price at which the position is entered. Use close if you arent adding to a position. Use the original entry price if you are adding to a position.
stop_level (float) : The price level where the stop loss is placed
stop_range (float) : The price range from entry to stop level
capital (float) : The total capital available for trading
risk_percent (float) : The percentage of capital risked on the trade. 100% is represented by 100.
trade_direction (bool) : True for long trades, false for short trades
Returns: A tuple containing the number of lots to trade, the value at risk, and the total value of the position:
calculate_risk_auto(entry, stop_level, stop_range, capital, risk_percent, trade_direction, whole_number_buy)
Automatically selects the risk calculation method based on the asset type and calculates risk metrics
Parameters:
entry (float) : The price at which the position is entered. Use close if you arent adding to a position. Use the original entry price if you are adding to a position.
stop_level (float) : The price level where the stop loss is placed
stop_range (float) : The price range from entry to stop level
capital (float) : The total capital available for trading
risk_percent (float) : The percentage of capital risked on the trade. 100% is represented by 100.
trade_direction (bool) : True for long trades, false for short trades
whole_number_buy (bool) : True to adjust the quantity to whole numbers, applicable only for non-futures and non-forex trades
Returns: A tuple containing the number of units or contracts to trade, the value at risk, and the total value of the position:
leverage_level(account_equity, position_value)
Calculates the leverage level used based on account equity and position value
Parameters:
account_equity (float) : Total equity in the trading account
position_value (float) : Total value of the position taken
Returns: The leverage level used in the trade
calculate_liquidation_level(entry, leverage, trade_direction, maintenance_margine)
Calculates the liquidation price level for a leveraged trade
Parameters:
entry (float) : The price at which the position is entered
leverage (float) : The leverage level used in the trade
trade_direction (bool) : True for long trades, false for short trades
maintenance_margine (float) : The maintenance margin requirement, expressed as a percentage
Returns: The price level at which the position would be liquidated, or na if leverage is zero

[Forex Fondamental Overview SGM]Fundamental analysis tool designed for currency trading in financial markets. The script generates a dashboard that displays key economic indicators for two selected currencies. Here is what makes this script particularly interesting for a trader:
1. Direct comparison between two currencies: The script allows you to choose two currencies (from a predefined list) and directly compare their key economic indicators such as interest rate, GDP growth, debt-to-GDP ratio, unemployment rate, inflation (CPI and PPI), and the services and manufacturing PMI indices. This gives you immediate insight into the economic strengths and weaknesses of each currency, which is crucial for making informed trading decisions.
2. Automatic data updating: Indicator values are updated automatically using security requests (request.security) that pull the most recent data available. This means you don't need to manually update data or check multiple sources; the script takes care of that for you.
3. Currency Relative Strength Calculation: The script calculates a strength index for each currency based on its economic indicators, and then it determines a relative strength index for the currency pair. This allows you to quickly see which currency is currently strongest, providing a basis for "buy strength, sell weakness" trading strategies.
4. Intuitive visualization: Results are presented in clear tables with colored indicators, making the information quickly digestible. For example, the background color changes depending on the relative strength of the currency pair, giving you an immediate visual signal of the overall trend.
5. Adaptability to different trading strategies: Whether you are a swing trader, a day trader, or a scalper, understanding the economic state of currencies can help you align your trading positions with underlying macroeconomic trends. This script gives you this information without requiring detailed economic analysis on your part.
In short, this script is a powerful tool for any Forex trader who wants to integrate fundamental analysis into their trading routine without bothering with the complexity of tracking and analyzing a multitude of economic indicators manually.

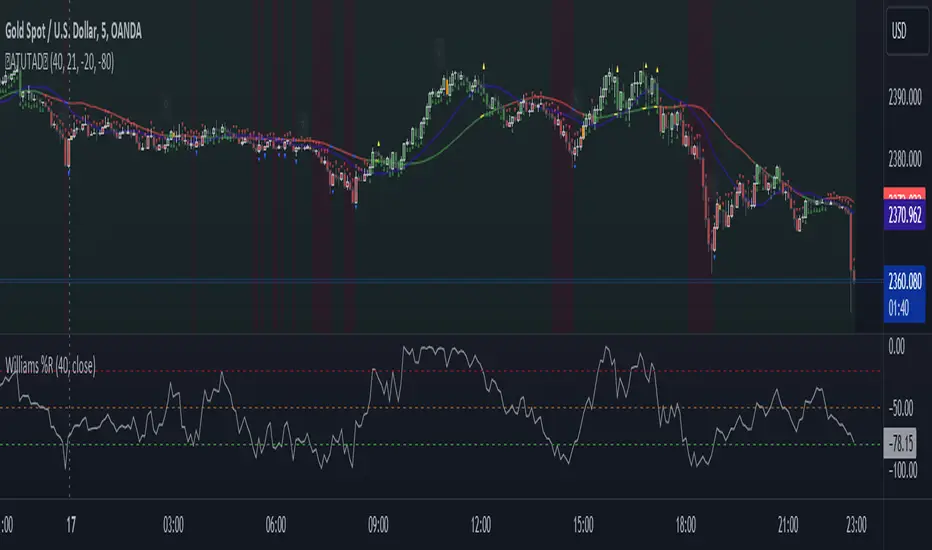
AllTheUpsTheresAlwaysDowns "AllTheUpsTheresAlwaysDowns" ☆ATUTAD☆ // w%r + ma indicator designed for forex trading.
This indicator combines the Williams %R, moving averages, and session tracking.
Key Inputs:
Williams%Range Period: Adjusts the sensitivity of the Williams %R calculation.
Moving Average Period: Defines the period for the moving average used in the indicator.
Overbought and Oversold Thresholds: Sets the thresholds for identifying overbought and oversold conditions.
Features:
Williams %R Calculation: Calculates the Williams %R, a momentum oscillator that measures overbought and oversold levels.
Moving Averages: Plots two moving averages to capitalize on and visualize trend direction.
Session Tracking: Identifies the start and end of trading sessions (Tokyo, London, New York) for better session-based analysis.
Signal Generation: Generates buy/sell signals based on Williams %R levels and moving average crossovers.
Color Coding: Visualizes color-coded bars and shapes to highlight different market conditions and signal types.
Alerts: For buy/sell signals and overbought/oversold conditions to prompt timely actions.
Usage Tips:
Interpret Signals: Trend direction through buy/sell signals and overbought/oversold trend,- reversal / breakout line conditions for potential trading opportunities.
Session Awareness: Take into account the trading sessions (Tokyo, London, New York) to move along with the market dynamics during different times of the day.
Confirmation: Use additional technical analysis tools to confirm signals before executing trades. For example the Williams Percetange Range indicator.
Risk Management: Trade with proper risk management strategies to avoid potential losses.
HappyTrading
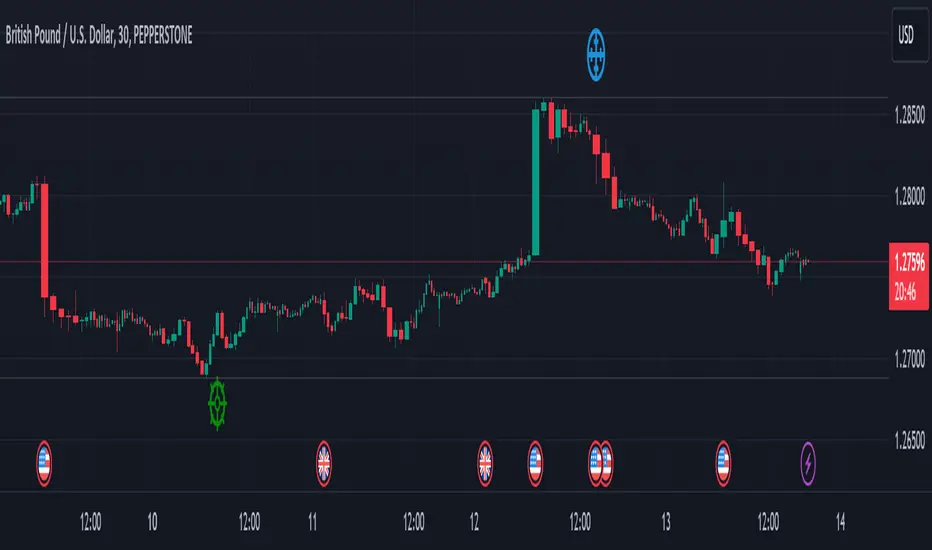
Swing Sniper by Republic of TradersSwing Sniper: A Comprehensive Market Reversal Indicator
Description:
Swing Sniper, developed by Republic of Traders, is a sophisticated trading indicator designed for traders who require precise market reversal signals. It performs optimally across all trading instruments and timeframes, offering both reliability and precision.
How It Works:
Swing Sniper employs a complex signal generation mechanism that activates only when six distinct conditions align within a specific timeframe. This includes:
A modified Commodity Channel Index (CCI) that helps identify short-term price fluctuations.
A Relative Momentum Index (RMI) utilized for recognizing long-term market trends.
A Supertrend indicator serves as a dynamic trend filter.
Several custom parameters that enhance signal reliability.
These components work synergistically to ensure that each trading signal is robust and well-founded. The indicator specializes in capturing significant market reversals by requiring a confirmation of trend reversal through a break and close above or below a previous supply/demand zone.
Usage Instructions:
Upon a valid signal, Swing Sniper advises traders that a potential market reversal has occurred and an entry may be considered in the direction of the new trend. Traders are recommended to set alerts for "once per candle close," allowing them to monitor multiple charts and timeframes simultaneously. Proper risk management is encouraged by placing stop losses just below or above the previous swing low or high and the signal candle's low or high. Take profits should similarly be set to capitalize on potential swings.
Why Choose Swing Sniper:
Swing Sniper is designed not only as a tool for generating entries but as a strategic component of your trading methodology. It brings a clear, analytical approach to navigating the markets, supported by detailed and logical indicator collaboration. This ensures users understand the underlying mechanics and can apply the tool effectively within their trading strategy.
Commitment to Originality and Utility:
Swing Sniper is a unique creation, adhering to TradingView’s standards by offering actionable insights that are distinct from other indicators available on the platform. It is meticulously crafted, featuring an original combination of technical analysis tools tailored to enhance market reversal detection.
Disclaimer:
Past performance is not indicative of future results. Always exercise due diligence and consider market conditions when trading.
Visualization Aid:
The accompanying chart visualization helps users identify signal examples, marked with a red triangle for market reversals short and a green triangle for market reversals long.
Embrace the strategic depth and precision of Swing Sniper and enhance your trading confidence and accuracy in financial markets.
RSI AcceleratorThe Relative Strength Index (RSI) is like a fitness tracker for the underlying time series. It measures how overbought or oversold an asset is, which is kinda like saying how tired or energized it is.
When the RSI goes too high, it suggests the asset might be tired and due for a rest, so it could be a sign it's gonna drop. On the flip side, when the RSI goes too low, it's like the asset is pumped up and ready to go, so it might be a sign it's gonna bounce back up. Basically, it helps traders figure out if a stock is worn out or revved up, which can be handy for making decisions about buying or selling.
The RSI Accelerator takes the difference between a short-term RSI(5) and a longer-term RSI(14) to detect short-term movements. When the short-term RSI rises more than the long-term RSI, it typically refers to a short-term upside acceleration.
The conditions of the signals through the RSI Accelerator are as follows:
* A bullish signal is generated whenever the Accelerator surpasses -20 after having been below it.
* A bearish signal is generated whenever the Accelerator breaks 20 after having been above it.

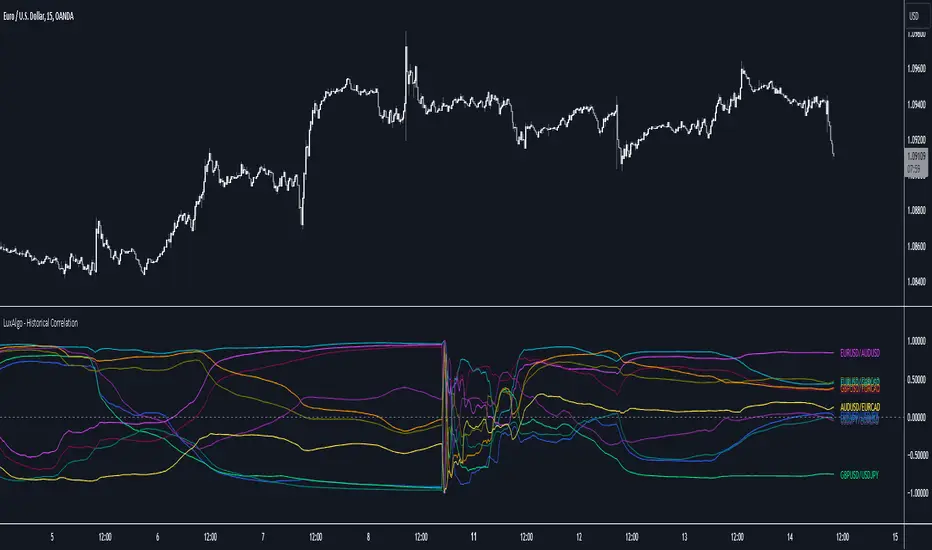
Historical Correlation [LuxAlgo]The Historical Correlation tool aims to provide the historical correlation coefficients of up to 10 pairs of user-defined tickers starting from a user-defined point in time.
Users can choose to display the historical values as lines or the most recent correlation values as a heat map.
🔶 USAGE
This tool provides historical correlation coefficients, the correlation coefficient between two assets highlight their linear relationship and is always within the range (-1, 1).
It is a simple and easy to use statistical tool, with the following interpretation:
Positive correlation (values close to +1.0): the two assets move in sync, they rise and fall at the same time.
Negative correlation (values close to -1.0): the two assets move in opposite directions: when one goes up, the other goes down and vice versa.
No correlation (values close to 0): the two assets move independently.
The user must confirm the selection of the anchor point in order for the tool to be executed; this can be done directly on the chart by clicking on any bar, or via the date field in the settings panel.
For the parameter Anchor period , the user can choose between the following values NONE, HOURLY, DAILY, WEEKLY, MONTHLY, QUARTERLY and YEARLY. If NONE is selected, there will be no resetting of the calculations, otherwise the calculations will start from the first bar of the new period.
There is a wide range of trading strategies that make use of correlation coefficients between assets, some examples are:
Pair Trading: Traders may wish to take advantage of divergences in the price movements of highly positively correlated assets; even highly positively correlated assets do not always move in the same direction; when assets with a correlation close to +1.0 diverge in their behavior, traders may see this as an opportunity to buy one and sell the other in the expectation that the assets will return to the likely same price behavior.
Sector rotation: Traders may want to favor some sectors that are expected to perform in the next cycle, tracking the correlation between different sectors and between the sector and the overall market.
Diversification: Traders can aim to have a diversified portfolio of uncorrelated assets. From a risk management perspective, it is useful to know the correlation between the assets in your portfolio, if you hold equal positions in positively correlated assets, your risk is tilted in the same direction, so if the assets move against you, your risk is doubled. You can avoid this increased risk by choosing uncorrelated assets so that they move independently.
Hedging: Traders may want to hedge positions with correlated assets, from a hedging perspective, if you are long an asset, you can hedge going long a negative correlated asset or going short a positive correlated asset.
Traders generally need to develop awareness, a key point is to be aware of the relationships between the assets we hold or trade, the historical correlation is an invaluable tool in our arsenal which allows us to make better informed decisions.
On this chart we have an example of historical correlations for several futures markets.
We can clearly see how positively correlated the Nasdaq100 and Dow30 are with the SP500 over the whole period, or how the correlation between the Euro and the SP500 falls from almost +85% to almost -4% since 2021.
As we can see, correlations, like everything else in the market, are not static and vary over time depending on many factors, from macro to technical and everything in between.
🔹 Heatmap
The chart above shows the tool with the default settings and the Drawing Mode set to 'HEATMAP'.
We can see the current correlation between the assets, in this case the FX pairs.
The highest positive correlation is +90% (+0.90) between EURUSD and GBPUSD.
The highest negative correlation is -78% (-0.78) between EURUSD and USDJPY.
The pair with no correlation is AUDUSD and EURCAD with 1% (0.01)
On the above chart we can see the current correlations for the futures markets.
Currently, the assets that are less correlated to the SP500 are NaturalGas and the Euro, the more positive correlations are Nasdaq100 and Dow20, and the more negative correlations are the Yen, Treasury Bonds and 10-Year Notes.
🔶 DETAILS
🔹 Anchor Period
This chart shows the standard FX correlations with the Anchor Period set to `MONTHLY`.
We can clearly see how the calculations restart with the new month, in this case we can clearly see the differences between the correlations from month to month.
Let us look at the correlation coefficient between GBPUSD and USDJPY
In January, their correlation started at close to -100%, rose to close to +50%, only to fall to close to 0% and remain there for the second half of the month.
In February it was -90% in the first few days of the month and is now around -57%.
And between AUDUSD and EURCAD
Last month their correlation was negative for most of the month, reaching -70% and ending around -14%.
This month their correlation has never gone below +21% and at the time of writing is close to +53%.
🔶 SETTINGS
Anchor point: Starting point from which the tool is executed
Anchor period: At the beginning of each new period, the tool will reset the calculations
Pairs from 1 to 10: For each pair of tickers, you can: enable/disable the pair, select the color and specify the two tickers from which you wish to obtain the correlation
🔹 Style
Drawing Mode: Output style, `LINES` will show the historical correlations as lines, `HEATMAP` will show the current correlations with a color gradient from green for correlations near 1 to red for correlations near -1.
ATH Gain PotentialThe indicator quantifies the relative position of a symbol's current closing price in relation to its historical all-time high (ATH).
By evaluating the ratio between the ATH and the present closing price, it provides an analytical framework to estimate the potential gains that could accrue if the symbol were to revert to its ATH from a specified reference point. The ratio serves as a quantitative measure for assessing the distance between the current market value and the symbol's historical peak, enabling investors to gauge the prospective profitability of a return to the ATH.

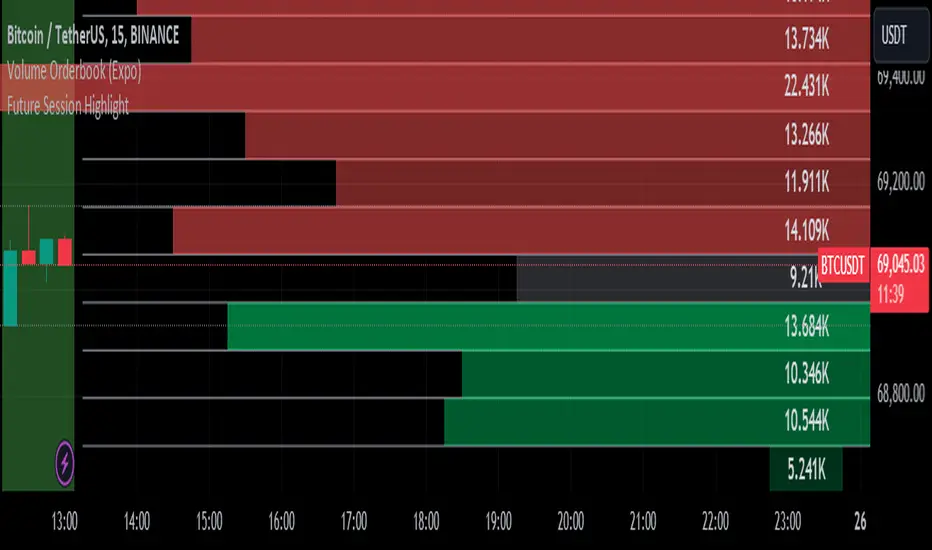
Volume Speed [By MUQWISHI]▋ INTRODUCTION :
The “Volume Dynamic Scale Bar” is a method for determining the dominance of volume flow over a selected length and timeframe, indicating whether buyers or sellers are in control. In addition, it detects the average speed of volume flow over a specified period. This indicator is almost equivalent to Time & Sales (Tape) .
_______________________
▋ OVERVIEW:
_______________________
▋ ELEMENTS
(1) Volume Dynamic Scale Bar. As we observe, it has similar total up and down volume values to what we're seeing in the table. Note they have similar default inputs.
(2) A notice of a significant volume came.
(3) It estimates the speed of the average volume flow. In the tooltip, it shows the maximum and minimum recorded speeds along with the time since the chart was updated.
(4) Info of entered length and the selected timeframe.
(5) The widget will flash gradually for 3 seconds when there’s a significant volume occurred based on the selected timeframe.
_______________________
▋ INDICATOR SETTINGS:
(1) Timezone.
(2) Widget location and size on chart.
(3) Up & Down volume colors.
(4) Option to enable a visual flash when a single volume is more than {X value} of Average. For instance, 2 → means double the average volume.
(5) Fetch data from the selected lower timeframe.
(6) Number of bars at chosen timeframe.
(7) Volume OR Price Volume.
_____________________
▋ COMMENT:
The Volume Dynamic Scale Bar should not be taken as a major concept to build a trading decision.
Please let me know if you have any questions.
Thank you.

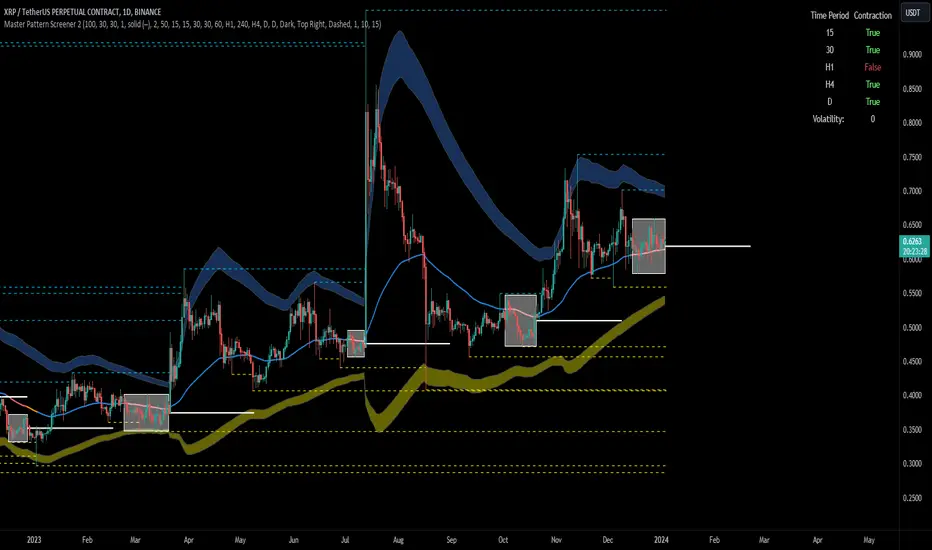
Forex Master Pattern Screener 2Overview
The Forex Master Pattern Screener 2 is based on the Master Pattern, which includes contraction, expansion, and trend phases. This indicator is designed to identify and visualize market volatility, market phases, multi-timeframe contractions, liquidity points, and pivot calculations. It provides a clear image of the market's expansion and contraction phases. It's based on an alternative form of technical analysis that reveals the psychological patterns of financial markets through three phases.
Unlike the other master pattern indicators that just use highs and lows and aren't as accurate for finding contractions, this one uses actual measures of volatility to find extremely low levels of volatility and has customizable parameters depending on what you want to do.
What is the Forex Master Pattern?
The Forex Master Pattern is a framework that revolves around understanding market cycles, comprising the three main phases: contraction, expansion, and trend.
Contraction Phase: During this phase, the market has low volatility and is consolidating within a narrow range. Institutional volume tends to be low, and it's suggested to avoid trade entries during this period.
Expansion Phase: Volatility starts to increase, and there start to be bigger moves in price. Institutional traders start accumulating positions in this phase, and they might manipulate prices to draw in retail traders, creating liquidity for their own buying or selling goals.
Trend Phase: This final phase completes the market cycle. Institutional traders begin taking profits, leading to a reversal. This triggers panic among retail traders, resulting in liquidations and stops. This generates liquidity for institutional traders to profit, leaving retail traders with overvalued positions.
Value Line:
The "value line" acts as the fair value zone or the neutral belief zone where buyers and sellers agree on fair value. It can be likened to the center of gravity and is created during contraction zones.
Applications:
Identifying these phases and understanding the value lines can help traders determine the market's general direction and make better trading decisions.
This isn't a strategy but a concept explaining market behavior, allowing traders to develop various strategies based on these principles
The contractions, which are based on volatility calculations, can help you find out when big moves will occur, known as expansions.
How traders can use this indicator
1. Identifying Market Phases:
Contraction Phase: Look for periods where the market has low volatility and is contracting, indicated by a narrow range and highlighted by the contraction box. During this phase, traders prepare for a breakout but usually avoid making new trades until a clearer trend emerges.
Expansion Phase: When the indicator signals an expansion, it suggests that the market is moving out of consolidation and may be beginning a new trend. Traders might look for entry points here, anticipating a continuation of the trend.
Trend Phase: As the market enters this phase, traders look for signs of sustained movement in one direction and consider positions that benefit from this trend.
2. Multi-Timeframe Analysis:
By looking at multiple timeframes, traders can get a broader view of the market. For instance, a contraction phase in a shorter timeframe within an expansion phase in a longer timeframe might suggest a pullback in an overall uptrend. This indicator comes with a MTF contraction screener that is customizable.
2. Fair Value Lines:
The fair value acts like a "center of gravity.". Traders could use this as a reference point for understanding market sentiment and potential reversal points. This indicator shows these values in the middle of the contraction boxes.
3. Volatility Analysis:
This indicator's volatility settings can help traders understand the market's current volatility state. High volatility indicates a more active market with larger, faster moves, while low volatility might suggest caution and tighter stop-losses or take-profits. If volatility is contracting, then an expansion is imminent. This indicator shows the volatility with percentile ranks in 0-100 values and also alerts you when volatility is contracting, aka the contraction phase.
Volatility Calculations:
This indicator uses a geometric standard deviation to measure volatility based on historical price data. This metric quantifies the variability of price changes over a specified lookback period and then computes a percentile rank within a defined sample period. This percentile calculation helps evaluate the current volatility compared to historical levels.
Based on the percentile rank, the indicator sets thresholds to determine whether the current volatility is within a range considered "contraction" or not. For example, if there are really low levels of volatility on the percentile rank, then there is currently a contraction phase. The indicator also compares the volatility value against a moving average, where values above the current moving average value signal the expansion phase.
Multi-Timeframe Analysis (MTF):
This indicator comes with a multi-timeframe table that shows contractions for 5 different timeframes, and the table is customizable.
Bands:
This indicator comes with bands that are constructed based on the statistical calculations of the standard deviation applied to the log-transformed closing prices. It is commonly assumed that the distribution of prices fits some type of right-skewed distribution. To remove most of the skewness, you can use a log transformation , which makes the distribution more symmetrical and easier to analyze, thus the use of these bands . These bands are in the 2 standard deviation range. You can use these bands to trade at extreme levels. The band parameter is based on the contraction volatility lookback, which is in the Volatility Model Settings tab.
Ways the bands could be used with the contractions:
1. Identifying Breakout trades:
Contraction Zones: These zones indicate periods of low volatility where the market is consolidating. There are usually narrow price ranges, which are considered a build-up phase before a significant price move in any direction.
Bands: When the contraction zone occurs, you might notice the bands tightening around the price on smaller lookback periods, reflecting the decreased volatility. A continuous widening of the bands could then signal the beginning of an expansion phase, indicating a potential breakout opportunity.
2. Enhancing Trade Timing:
Before the Breakout: During the contraction phase, the bands might move closer together, reflecting the lower volatility. You can monitor this phase closely and prepare for a potential expansion. The bands can provide additional confirmation; for instance, a price move toward one of the bands might show an extreme occurrence and might show what the direction of the breakout could be.
After the breakout: Once the price breaks out of the contraction zone and goes to the expansion phase, and if it coincides with the bands widening significantly, it could reinforce the strength and potential sustainability of the new trend, providing a clearer entry.
3. Price-touching bands during a contraction:
If the price repeatedly touches one of the bands during a contraction phase, it might suggest a buildup of pressure in that direction. For example, if the price is consistently touching the upper band even though the bands are narrow, it might suggest bullish pressure that could occur once the expansion phase begin.
4. Price at the band extreme levels during Expansion:
If the price is at the extreme levels of the bands once the expansion phase occurs, it might indicate unsustainable levels and a low probability of the price continuing beyond those levels. Potentially signaling that a reversal will occur. Some trades could use these extremes to place entries during the expansion phases.
Liquidity Levels:
This script comes with liquidity points, whose functionality goes towards identifying pivotal levels in price action, focusing on swing highs and swing lows in the market. These points represent areas where significant buying (for swing lows) or selling (for swing highs) activity has occurred, implying potential levels or resistance in the price movement.
These liquidity points, often identified as highs and lows, are points where market participants have shown interest in the past. These levels can act as psychological indications where traders might place orders, leading to increased trading activity when these levels are approached or breached. When used with the Forex Master Pattern phases, liquidity levels can enhance trades placed with this indicator. For instance, if the market is expanding and approaches a significant liquidity level, there might be a higher chance of a breakout or reversal, showing a possible entry or exit point.
Liquidity Levels in the Contraction Phase:
Accumulation and Distribution: During the contraction phase, liquidity levels can indicate where huge positions are likely accumulating or distributing quietly. If price is near a known liquidity level and in a contraction phase, it might suggest that a large market player is building a position in anticipation of the next move.
Breakout Points: Liquidity levels can also give clues about where price could go after the breakout from the contraction phase. A break above a liquidity level might indicate a strong move to come as the market overcomes significant selling pressure.
Liquidity Levels in Expansion Phase:
Direct Confirmation: As the expansion phase begins, breaking through liquidity levels can confirm the new trend's direction. If the price moves past these levels with huge volume, it might indicate that the market has enough momentum to continue the trend.
Target Areas: Liquidity levels can act as target areas during the expansion phase. Traders using this indicator could look to take profits if the price approaches these levels, possibly expecting a reaction from the market.
Time & Sales (Tape) [By MUQWISHI]▋ INTRODUCTION :
The “Time and Sales” (Tape) indicator generates trade data, including time, direction, price, and volume for each executed trade on an exchange. This information is typically delivered in real-time on a tick-by-tick basis or lower timeframe, providing insights into the traded size for a specific security.
_______________________
▋ OVERVIEW:
_______________________
▋ Volume Dynamic Scale Bar:
It's a way for determining dominance on the time and sales table, depending on the selected length (number of rows), indicating whether buyers or sellers are in control in selected length.
_______________________
▋ INDICATOR SETTINGS:
#Section One: Table Settings
#Section Two: Technical Settings
(1) Implement By: Retrieve data by
(1A) Lower Timeframe: Fetch data from the selected lower timeframe.
(1B) Live Tick: Fetch data in real-time on a tick-by-tick basis, capturing data as soon as it's observed by the system.
(2) Length (Number of Rows): User able to select number of rows.
(3) Size Type: Volume OR Price Volume.
_____________________
▋ COMMENT:
The values in a table should not be taken as a major concept to build a trading decision.
Please let me know if you have any questions.
Thank you.

The Master Pattern Indicator***READ THIS FIRST****
THE MASTER PATTERN Indicator
USER AGREEMENT
*** The personal/private use of this indicator is allowed, commercial use is FORBIDDEN.
***Commercial use will be interpreted as taking advantage of the free indicator in order to profit from it, for example: as part of any courses or mentorships offering training of the indicator or the concept its based. You don't need to pay for any training for this, the strategy is a simple trend following approach, even a caveman would understand.
**********************************************************************************************************************
Now please enjoy the BEST Master Pattern indicator you will ever find for Tradingvew, and for the best price: FREE.
Please do not give money to people trying to charge you for any inferior version of this indicator.
DESCRIPTION
The Master Pattern indicator or The Forex Master Pattern is an alternative form of technical analysis that provides a framework which will help you to find and follow the hidden price pattern that reveals the true intentions of financial markets. This algorithm I came up with does a very good job detecting the Phase 1 of the Forex Master Pattern cycle, which is the contraction point (or Value), and then proceeds to differentiate between major or minor lines and prints the liquidity lines the correct manner in relation to the swings expanding from the contraction.
On Phase 2 we get higher timeframe activation (also called Expansion), which is where price oscillates above and below the average price defined on Phase 1.
On Phase 3 is where we get a sustained deviation from value (the Trend).
In a very short time you will start noticing this pattern, even on naked charts. It is all a matter of training your eyes - the more time you invest studying the charts with this indicator (both historically and replaying the market on strategy tester), the faster you will become familiar with this method.
This indicator DOES NOT REPAINT. You can safely study the chart historically because what is printed historically is what prints real time.
Why do traditional based indicator systems fail over time? Because the markets move in cycles that constantly change structure. Those traditional indicator systems must be constantly optimized and settings tinkered with because of the changing market environment. There are an infinite number of variables that affect price so no exact technical system can work the same forever, which is also the reason why most bots/EA fail.
If you learn to spot the Forex Master Pattern and understand the sequence of the real cycles that drive the markets, you can more accurately forecast market behavior. By using traditional indicators you end up masking this pattern.
Use the insights provided by the Forex Master Pattern indicator to elevate your trading to the next level.
This method of analysis works in any liquid market and timeframe.
VERY IMPORTANT:
The default setting of historical bars is set to 500. This is more than enough for day trading and ensures fast drawings loading time and stable performance. Bear in mind that, the more bars you choose to load historically, the longer it will take to draw everything. The max setting of this input for now is 800. If it is possible to increase it, I will update the code. So if you want to make historical analysis far in the past, just use the chart replay feature.
Indicator Parameters:
They are all self-explanatory, except Type. You can choose between 1 and 2.
1 is better suited for LTF (M1 to M30)
2 is better suited for HTF (H1 and upwards)
However, this is my personal preference. You can of course experiment and choose what looks best for you.
Instructions to use the alert function:
1st step - Choose symbol and timeframe for the alert
2nd step - Go to indicator settings and tick/untick the boxes for the alerts you want
3rd step - Click on the ... (three dots) next to the indicator name (chart upper left corner) and click to add indicator alert
Then it's gonna add the alert with the conditions that you've ticked/unticked inside indicator settings.
Then repeat the process for different symbols, timeframes and different alert conditions.

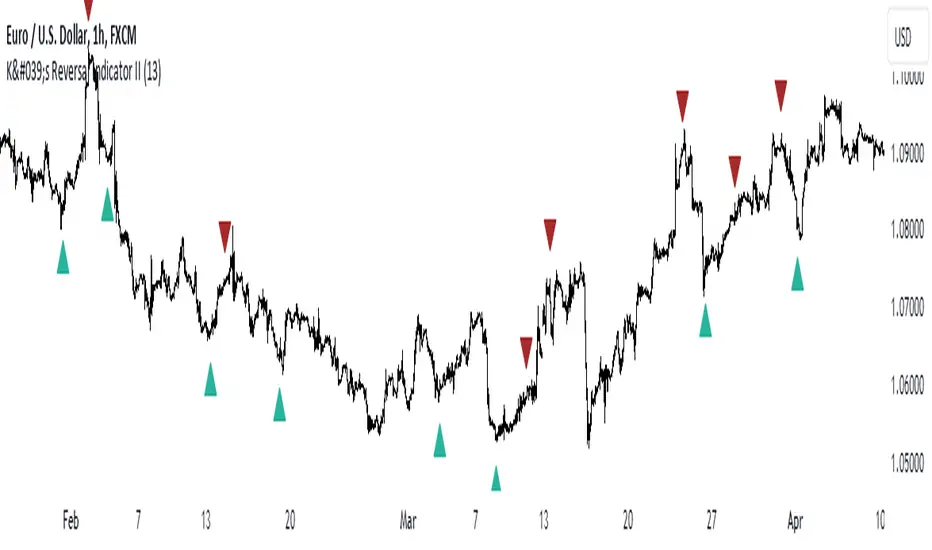
K's Reversal Indicator IIK’s Reversal Indicator II uses a moving average timing technique to deliver its signals. The method of calculation is as follows:
* Calculate a moving average (by default, a 13-period moving average).
* Calculate the number of times where the market is above its moving average. Whenever that number hits 21, a bearish signal is generated, and whenever that number if zero, a bullish signal is generated.
The indicator signals short-term to mid-term reversals as a mean-reversion move.
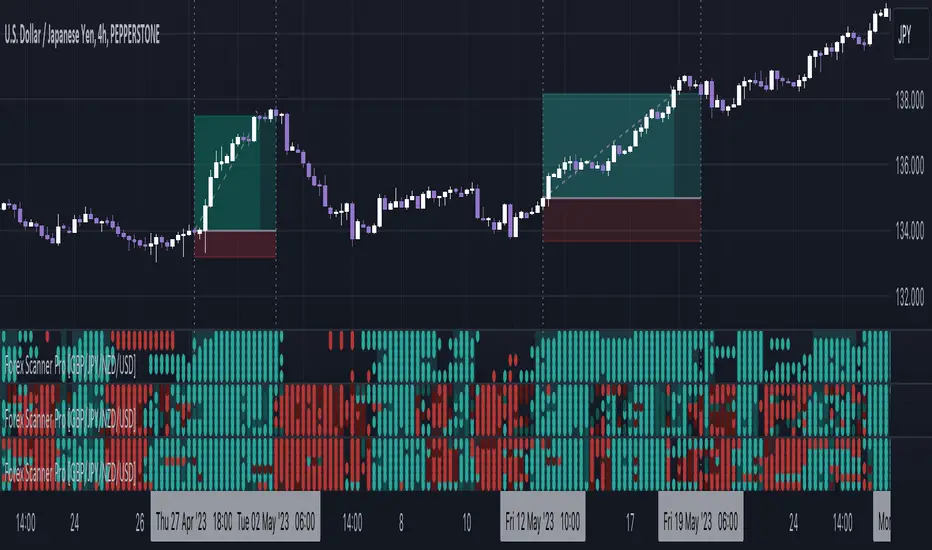
Forex Scanner Pro - GBP/JPY/NZD/USD [FxScripts]Forex Scanner Pro is both a multi-functional indicator and market scanner combined. The combination allows you to have multiple eyes across the market, all from a single chart.
The scanner is comprised of an intuitively designed 3-in-1 tool that tracks the key metrics that drive markets. Each use advanced algorithms to gather information from multiple data points, distilled into one simplified view.
***** TREND SCANNER *****
The first indicator featured on the chart is the Trend Scanner, this allows you to track price action across the wider market. Instantly see pattern shifts and emerging trends; when the market moves, you move with it.
***** MOMENTUM SCANNER *****
The second is the Momentum Scanner which offers a realtime representation of momentum shifts as they occur. This allows you to monitor false breakouts and catch the moves that matter.
***** VOLUME SCANNER *****
The third is the Volume Scanner which provides unique insight into where buy and sell volume is being placed across the market. It offers a further way of determining entry and exit points or simply confirmation that a trend is underway.
***** HOW IT WORKS *****
1. The scanner surveys the market looking for strengths and weaknesses in Trend, Momentum or Volume.
2. It displays the underlying strength or weakness as a series of dots with up to six green dots showing strength and up to six red dots showing weakness.
3. Lighter colored dots are displayed where the strength of the trend, momentum or volume is lesser; if a dot is missing this is a sign of market neutrality.
4. All scanners have a sensitivity setting plus a volatility filter which can be adjusted according to your style of trading and the underlying instrument (full details below).
5. The background can be set to color-fill when the majority of dots are coloured either red or green, with higher values denoting greater strength or greater weakness.
6. Alerts can be configured in the same way as the background to provide both entry and exit signals (further details below).
***** INSTRUMENTS *****
Due to computational restraints, the scanner is split across two different indicators. This one features GBP, JPY, NZD and USD; the other AUD, CAD, CHF and EUR. Both form part of the same package.
Forex Scanner Pro works effortlessly with any of the following major or minor crosses:
AUDCAD, AUDCHF, AUDJPY, AUDNZD, AUDSGD, AUDUSD, CADCHF, CADJPY, CADSGD, CHFJPY, EURAUD, EURCAD, EURCHF, EURGBP, EURJPY, EURNZD, EURSGD, EURUSD, GBPAUD, GBPCAD, GBPCHF, GBPJPY, GBPNZD, GBPSGD, GBPUSD, NZDCAD, NZDCHF, NZDJPY, NZDUSD, SGDJPY, USDCAD, USDCHF, USDJPY, USDSGD
***** SETTINGS OVERVIEW *****
The scanner features the following customizable settings:
~~ Trend Settings ~~
▶ Trend Filter - adjusting this will allow you to focus on short term trends (most suitable for scalping), medium or long term (best for swing trading).
▶ Countertrend Strength - increases the sensitivity of weaker vs stronger countertrends. As countertrends are trends that run against the main trend, this will assist in detecting the strength of a pullback or reversal and allow you to either hold, exit or reverse the trade with confidence.
~~ Momentum Settings ~~
▶ Momentum Filter - increase or decrease the sensitivity of the momentum scanner. Increase to avoid periods of low or weak momentum, decrease to highlight stronger surges in momentum.
~~ Volume Settings ~~
▶ Volume Filter - increase or decrease the sensitivity of the volume scanner. Increase to avoid periods where buy and sell volume can potentially cancel each other out.
~~ Volatility Settings ~~
▶ Volatility Offset - use this to fine tune the volatility filter. A higher value generally delays the volatility filter allowing for confirmation of stronger trends, a lower value will detect trend, momentum or volume movement sooner but may be less accurate.
▶ Each scanner has its own setting allowing you to adjust how you monitor the underlying volatility for each.
▶ As with all settings, we recommend adjusting this to your style of trading, instrument and timeframe.
~~ Alerts ~~
Alerts can be configured to send notifications when anything from 4-6 bullish or bearish dots are showing. Exit markers can be configured when anything from 2+ dots are revealed. This adds an extra layer of sensitivity for traders who appreciate complete control over their trade.
~~ Display Settings ~~
You have the ability to hide all colored dots and only show the background or, alternatively, hide the background and only show colored dots.
***** TRIAL PERIOD *****
We offer a FREE, no questions asked, 7-day trial with every new registration. Visit the link below to register.
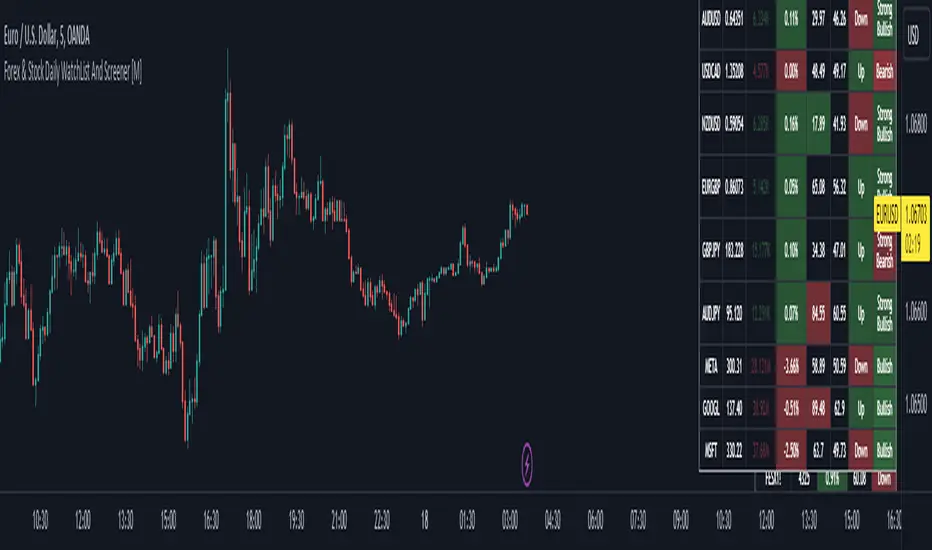
Forex & Stock Daily WatchList And Screener [M]Hi, this is a watchlist and screener indicator for Forex and Stocks.
This indicator is designed for traders who trade in the forex markets and monitor developments in indices and other currency pairs.
It includes information on 14 indices such as the volatility index, Baltic dry index, etc. You can customize the indices as you wish. The indices table contains the index's price (or points), daily change, stochastic value, and trend direction.
The second table is designed for trading forex and stock currency pairs.
In this table, you will find information such as price, volume, change, stochastic, RSI, trend direction, and MACD result for all traded pairs. You can customize all the currency pairs in this table as you wish, and you can also tailor the oscillator settings to your preferences.
In the settings section, you can use checkboxes to hide the pairs in both tables.
The "Customize" section in the settings allows you to personalize the table appearances according to your preferences.
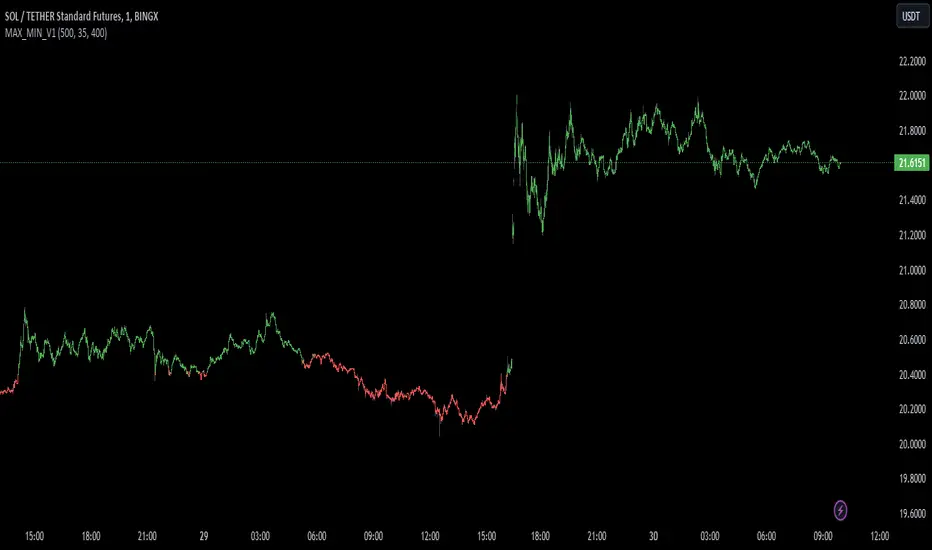
MAX_MIN_V1
Another simple indicator, maximum, minimum and average values. The point of imbalance in the price of an asset is sought.
It is used for any temporality and in almost any asset.
You can configure the visibility of the different elements.
All Candlestick Patterns on Backtest [By MUQWISHI]▋ INTRODUCTION :
The “All Candlestick Patterns on Backtest” indicator generates a table that offers a clear visualization of the historical return percentages for each candlestick pattern strategy over a specified time period. This table serves as an organized resource, serving as a launching point for in-depth research into candle formations. It may help to rectify any misconceptions surrounding candlestick patterns, refine trading approaches, and it could be foundation to make informed decisions in trading journey.
_______________________
▋ OVERVIEW:
_______________________
▋ CREDIT:
Credit to public technical “*All Candlestick Patterns*” indicator.
_______________________
▋ TABLE:
_______________________
▋ CHART:
_______________________
▋ INDICATOR SETTINGS:
#Section One: Table Setting
#Section Two: Backtest Setting
(1) Backtest Starting Period.
Note: If the datetime of the first candle on the chart is after the entreated datetime, the calculation will start from the first candle on the chart.
(2) Initial Equity ($).
(3) Leverage: Current Equity x Leverage Value.
(4) Entry Mode:
- “At Close”: Execute entry order as soon as the candle confirmed.
- “Breakout High (Low for Short)”: Stop limit buy order, entry order will be executed as soon as the next candle breakout the high of last pattern’s candle (low for short)
(5) Cancel Entry Within Bars: This option is applicable with {Entry Mode = Breakout High (Low for Short)}, to cancel the Entry Order if it's not executed within certain selected number of bars.
(6) Stoploss Range: the range refers to high of pattern - low of pattern.
(7) Risk:Reward: the calculation of risk:reward range start from entry price level. For example: A pattern triggered with range 10 points, and entry price is 100.
- For 1:1~risk:reward would the stoploss at 90 and takeprofit at 110.
- For 1:3~risk:reward would the stoploss at 90 and takeprofit at 130.
#Section Three: Technical & Candle Patterns
_______________________
▋ Comments:
This table was developed for research and educational purposes.
Candlestick patterns are almost similar as seen in “*All Candlestick Patterns*” indicator.
The table results should not be taken as a major concept to build a trading decision.
Personally, I see candlestick patterns as a means to comprehend the psychology of the market, and help to follow the price action.
Please let me know if you have any questions.
Thank you.

All Candlestick Patterns Screener [By MUQWISHI]▋ INTRODUCTION :
The Candlestick Patterns Screener has been designed to offer an advanced monitoring solution for up to 40 symbols. Utilizing a log screener style, it efficiently gathers information on confirmed candlestick pattern occurrences and presents it in an organized table. This table includes essential details such as the symbol name, signal price, and the corresponding candlestick pattern name.
_______________________
▋ OVERVIEW:
_______________________
▋ CREDIT:
Credit to public technical “*All Candlestick Patterns*” indicator.
_______________________
▋ USAGE:
_______________________
▋ Final Comments:
For best performance, add the Candlestick Patterns Screener on active symbol chart like QQQ, SPY, AAPL, BTCUSDT, ES, EURUSD or …etc.
Candlestick patterns are not a major concept to build a trading decision.
Personally, I see candlestick patterns as a means to comprehend the psychology of the market, and help to follow the price action.
Please let me know if you have any questions.
Thank you.

Extreme Reversal SignalThe Extreme Reversal Signal is designed to signal potential pivot points when the price of an asset becomes extremely overbought or oversold. Extreme conditions typically signal a brief or extensive price reversal, offering valuable entry or exit points. It's important to note that this indicator may produce multiple signals, making it essential to corroborate these signals with other forms of analysis to determine their validity. While the default settings provide valuable insights, it might be beneficial to experiment with different configurations to ensure the indicator's efficacy.
Two primary conditions define extremely overbought and oversold states. The first condition is that the price must deviate by two standard deviations from the 20-day Simple Moving Average (SMA). The second condition is that the 3-day SMA of the 14-day Stochastic Oscillator (STO) derived from the 14-day Relative Strength Index (RSI) is above or below the upper or lower limit.
Oversold states arise when the first condition is met and the 3-day SMA of the 14-day Stochastic RSI falls below the lower limit, suggesting a buy signal. These are visually represented by green triangles below the price bars. Overbought states arise when the first condition is met and the 3-day SMA of the 14-day Stochastic RSI rises above the upper limit, suggesting a sell signal. These are visually represented by red triangles above the price bars. It's also possible to set up automated alerts to get notifications when either of these two conditions is met to avoid missing out.
While this indicator has traditionally identified overbought and oversold conditions in various different assets, past performance does not guarantee future results. Therefore, it is advisable to supplement this indicator with other technical tools. For instance, trend indicators can greatly improve the decision-making process when planning for entries and exit points.

Scalping The Bull - BullBot for Stock and ForexName : Scalping The Bull - BullBot for Stock and Forex.
Category : Scalping tool for the Stock and Forex market, optimized for trend following and mean reversal operations.
Timeframe : Recommended to be used on timeframe 1m, 5m, 30m, 1h, 1D, depending on the specific technique.
Technical Analysis : The indicator implements the trading techniques of Scalping The Bull. Even if the techniques are exquisitely discretionary, we have written the indicator with our interpretation of the them to identify the patterns automatically. We also codified a the process described below, giving the possibility to trade mechanically. The indicator is designed for a short-term (intraday or scalping) trend-following approach, where the entry is made on the breakout of significant price levels. Entry setups are calculated by price action analysis using 5-10-50-200 EMAs as reference. According to the interaction of price action with the EMAs, patterns are generated, and the indicator finds them independently.
Suggested use :
The process follows:
1. Selection of the instrument to trade on
Given the short duration of the trades, there must be sufficient volatility and liquidity. You can add the different instruments to a TradingView watch list and then make a first skim, considering the daily percentage change. Once an instrument has been selected, the indicator allows you to check at a glance things like the Rate of Change (ROC) and the detection of opening gaps.
2. Identification of the main trend
Once in the instrument, the main trend of the underlying is identified through the 50-200 EMAs: if the fast EMA is greater than the slow one, we have a bullish trend, otherwise a bearish trend on a higher timeframe than the one in which the trade is executed. The rule is to trade in favor of the main trend. For this reason, the indicator prints to chart reference averages. It is also recommended to check the daily timeframe, always using the averages, preferring those instruments where the price follows an average without touching it too often.
3. Identification of breakout levels
Breakout levels favoring the trend are identified near the daily high/minimum, the previous day's high/minimum, or the weekly high/minimum. The indicator prints such levels on the chart with lines.
4. Identification of secondary trends and entry levels
Patterns can be divided into three categories. Trend-based ones have the function of identifying the secondary trend and then confirming the trade. Breakout patterns are used to find entry levels.
a. Trend Continuation Patterns (Price/EMA) : are used to get confirmation that the minor trend is in agreement with the major trend (i.e., Shimano, Dive, Dip, Anti-crossing).
b. Trend Change Patterns (Price/EMA) : are used to get confirmation that a minor trend in the opposite direction of the main trend is ending and therefore are used to get further confirmation of the trade (i.e., Bounce, Viagra, Return to Highs/Minimums).
c. Breakout Patterns : identify the optimal price levels for trade entry (i.e., Third Touch, Bud, Maxi Bud, Color Change).
Details on how the specific patterns are computed can be found below in the description of this indicator.
5. Definition of Stop Loss and Take Profit
Once the entry price is calculated, different types of Stop Loss (e.g., relative minimum of Tot candles, first or second average below price, price levels) and Take Profit (relative maximum of Tot candles, first or second average above price, price levels) can be considered. A risk/reward ratio of at least 1.2 should always be considered, depending on one's risk appetite.
6. Define the position management strategy
Normally, when a mock breakout is executed, the advice is to exit the trade as soon as possible or at least to bring the stop-loss to break even. A trailing stop on relative lows or the nearest average is also possible.
7. Enter the position
Usually, with a stop order, follow the rules defined in the previous steps.
Configuration :
Graphical configuration :
Show ROC filter : turns the background green when the asset has enough volatility to activate patterns.
Show Legend : enables the description on the lines of the trigger points.
Show Table : displays the volatility table where the GAP and ROC (Rate of Change) information is present.
Show Take Profit % - Automatic : shows the percentage scale that automatically adjusts to the volatility of the chart to identify the Take Profit and Stop Loss at a glance.
Label color : adjusts the color of the labels.
Trigger Point Colors : Adjust the colors of the trigger points.
Trigger Points
Today's highs and lows : draw on the chart the closing price of Yesterday, the opening price of the daily candlestick, and the highs and lows of the day (high in purple, low in red, Yesterday's close in green, and open in orange).
Yesterday's highs and lows : draw on the chart the highs and lows of the previous day (high in yellow, low in red). An alert can be activated with a % offset.
Weekly highs and lows : draw the highs and lows of the previous week on the chart (high in white, low in red). An alert can be activated with a % offset.
Price Patterns :
Gap : a label and an alert can be activated.
Pay..!! : a label and an alert can be activated.
Third Touch and Third Touch on EMA : a label and an alert can be activated.
Return to Highs : a label and an alarm can be activated.
Return to Lows : a label and an alarm can be activated.
Long and Short Color Change : a label and an alert can be activated.
EMA Patterns :
Viagra long and short : a label and an alert can be activated for the specific market and EMA situations.
Shimano : a label and an alert can be activated with a configurable candlestick threshold.
Emergence - Dive : a label and an alert can be activated.
Anti-crossing - Anti-crossing short : a label and an alarm can be activated.
Bounce on EMA long and short : a label and an alert can be activated with a configurable tick tolerance.
Bud - Maxi Bud - Bud Short : a label and an alert can be activated on all timeframes.
Alerts :
Activate all alerts : you can activate alerts by clicking on Alerts, then on the condition "BullBot" and then on "Any alert() function.". So that you know, creating alerts on the price-EMA crossing is also possible.
Patterns :
The list of patterns that are automatically recognized by the indicator follows.
Gap : indicates when a Gap Up or Gap Down occurs at the opening of a session, particularly useful in the equity markets.
Pay : signals when the stock has risen by a sufficient percentage to be tradable, adjusts the triggering of many bounce and breakout patterns.
Viagra : signaled for both a long and short setup, indicates an overbought or oversold situation by the appearance of gaps and a series of consecutive candles contained by the fast EMAs (5 -10) depending on the market of reference.
Third touch and third touch EMA : signals a breakout conformation, indicated when three touches occur at the same price level or below one of the slow EMAs (50 - 200).
Shimano : detects lateralization between Ema 50 and Ema 200, indicating that we are in a retracement phase and that a new impulsive move may soon develop.
Emergence - Dive : these are the main patterns for identifying the trend. The indicator signals when the EMA 50 and 200 are approaching to anticipate their crossing to the top or bottom.
Anti-crossing long - Anti-crossing short : occurs when the price, after an important impulse, makes a retracement to the EMA 200, bringing the EMA 50 to approach it without ever touching it, but before the cross, an opposite impulse determines the end of the retracement and the resumption of the trend in place.
Rebound : signals in the first rebound on the EMA 50 and EMA 200 after an impulse that recorded new highs or lows.
Return to the Highs - Return to the Lows : this pattern is closely related to rebounds. It indicates that the price is approaching the highs or lows again after a rebound on a slow EMA.
Change Color : is based on the previous session's closing price. It indicates when the price is approaching either from above or below this level, which determines the Color of the daily candlestick.
Bud - Maxi Bud - Bud Short : Bud occurs when the price breaks above EMA 10, and there are at least two consecutive candles between the high and low of the breakout impulse. Maxi Bud signals near the day's highs when this situation occurs, and Bud Short signals the breakout levels for a short trade.

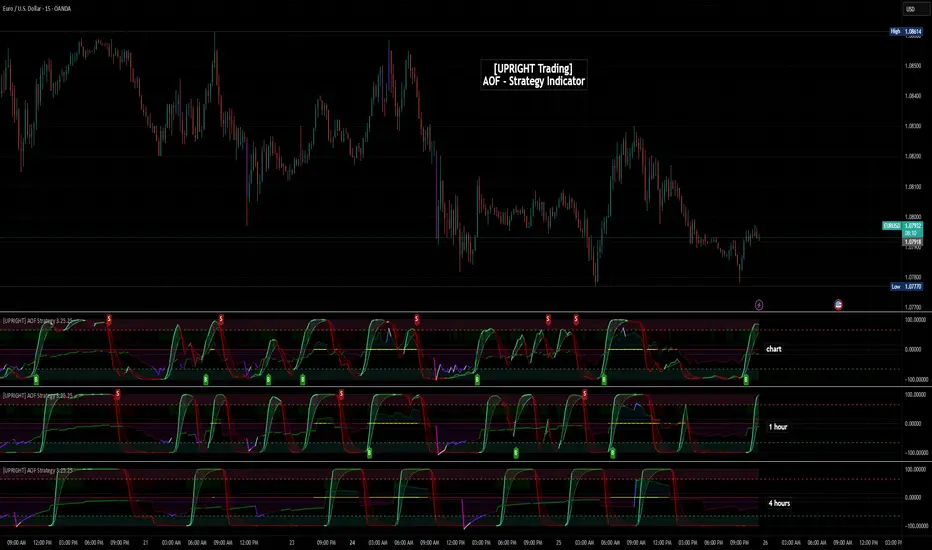
[UPRIGHT Trading] Academy of Forex - Scalp Strategy█ OVERVIEW
This is a collaboration of efforts of The Academy of Forex and UPRIGHT Trading .
The Academy of Forex - Scalp Strategy Indicator is a clean & reimagined lower indicator. To enable optimization & potential automation, we re-coded & optimized it at UPRIGHT Trading.
It is based on the one presented on its YT channel.
The idea is for it to be an easy to use - simple indicator - that works not just for confirmation, but also entering and exiting quickly (scalping).
█ CONCEPTS
The idea is that %B (derived from BBs) is able to pick up some pretty significant moves. With that as one of the bases the Inverse Fisher Transform (Ribbon) acts to show some of the movement of the asset highlighting when it at extremes. The RSI highlights are there as another confirmation to help normalize the sometimes too frequent movement of %B.
As expected the indicator often acts as a reversal indicator, but with the optimizations of logic it's able to pick up more than just the reversals and works as a pretty decent Buy/Sell Algorithm.
█ CALCULATIONS
Calculations used included, but not limited to:
- %B - Quantifies the price as a percentage to the Upper and Lower Band of the Popular Bollinger Bands, which were named after their inventor John Bollinger in 1980.
- Inverse Fisher Transform RSI - is a variation of the IFT, created by John Ehlers, the idea is for the IFT to convert Gaussian normal distribution and to take it a step further the RSI version is to just use overbought and oversold placements. This indicator is meant to highlight when price has moved to an extreme and in this process helps to spot turning points.
- Relative Strength Index (RSI) - As most of you know already the RSI is a technical analysis tool invented by J. Welles Wilder, that oscillates and is used to measure the momentum of price changes. It normalizes to index 0-100 with overbought and oversold defined by the user, but often around 70 as overbought and 30 as oversold.
- Pivot/Swing Points - Implemented to show recent Higher-Highs or Lower-Lows, Pivot points are included in the indicator for structure tracking.
- Moving Averages - Moving averages help to get an idea of when price is moving near the norm or outside to extremes.
█ FEATURES
Indicator Features:
-2 Buy/Sell Signals.
-U Signals (UPRIGHT optimized).
-Exit Reminders.
-Alerts allowing Automation of Scalp Strategy.
-H/L Swings.
-Color Customization.
-Clean Mode.
-Inverse Fisher Transform Ribbon.
-RSI Bullish/Bearish Highlights.
-Options for More Signals (including: Oversold/Overbought Circles, %B Bull/Bear Squares and Triangles, and IFT Highlights).
Showing some of the signals close up.
Should look like this:
Enjoy!
Sincerely,
Mike
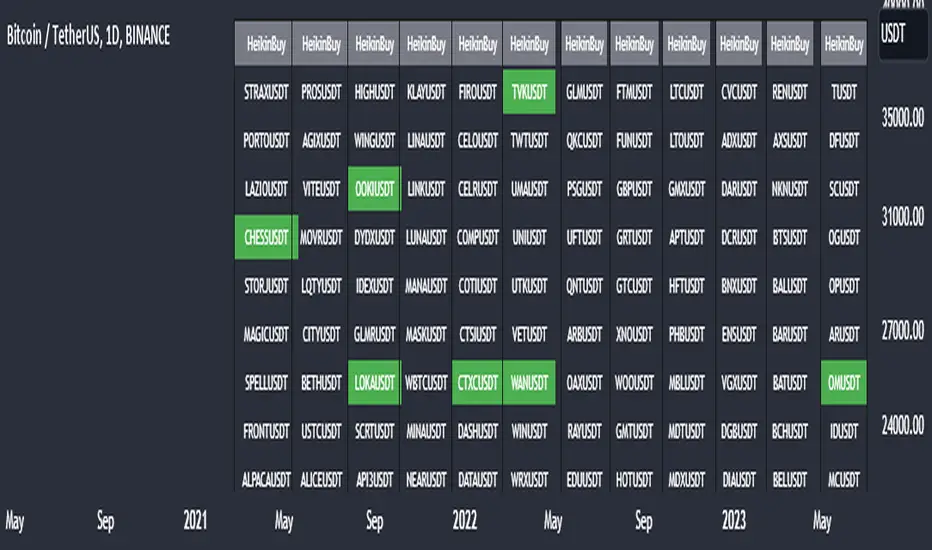
Heikin Ashi Master Buy Signal ScannerHeikin Ashi Master Buy Signal Scanner is an algorithm consisting of smoothed Heiken Ashi candles and moving averages.Moving averages use 5 basic moving averages. I preferably use ema for smoothing.In addition, the main purpose of this indicator is the preferred stock market and its shares, trading pairs, etc. scanning on a single screen and seeing the buy signals on a single screen.The buy signal appears on the screen as green.
With Column Width from the indicator properties, the width of the column of 30 symbols is adjusted, and the position of the column on the screen is adjusted with the Column Number.
With the indicator, a maximum of 30 symbols can be listed at once. However, this number can be increased according to your tradingview membership type. Especially if you are a premium member of tradingview, you can add as many indicators as you want to the chart without any limitation, and you can add as many symbols as your screen width to the chart. Heikin Ashi Master Buy signals you can see on a single screen.
In addition, the indicator gives you the opportunity to set the time zone you want and you can see the signals according to the time zone you want. All you need to do for this is to set the time zone from the indicator properties.
Now, if you wish, you can see examples of scans made on a single screen below.
Buy signals of 346 coins of Binance usdt trading pair on a single screen
Buy signals of 420 stocks of the Indian market on a single screen
Buy signals of 300 stocks of the NASDAQ on a single screen
Buy signals of 300 stocks of the BORSA ISTANBUL-BIST on a single screen
Buy signals on a single screen with 49 trading pairs in Forex