4/8/15 EMA + Classic & Camarilla PivotsEssentially this is what you can get on TOS but everything included in one chart.
Analyse fondamentale

Daily ATR SL/TP Labels on ChartATR-Based Stop Loss & Take Profit Calculator
This script calculates 20% of the Average True Range (ATR) to determine optimal Stop Loss and Take Profit levels. Designed to assist traders in setting precise risk parameters when placing Buy/Sell orders based on daily market volatility.
Key Features:
Computes 20% of ATR value for proportional risk management
Provides dynamic SL/TP levels aligned to current market conditions
Optimised for Daily timeframe analysis to capture full trading day range
Recommended Usage:
Apply on Daily (1D) timeframe for most accurate results, as this captures the complete intraday price movement and provides reliable volatility measurements for position sizing and risk management decisions.

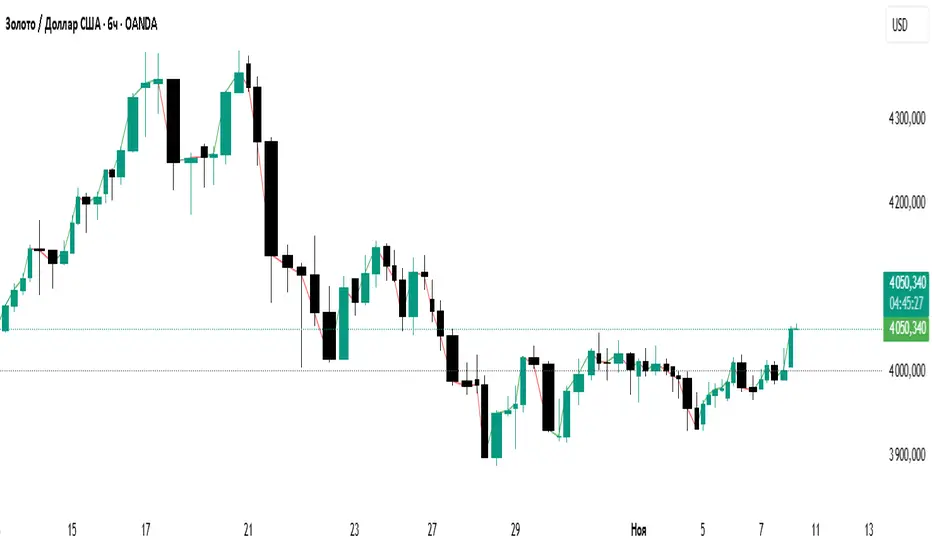
XAU/USD Weekly Volatility Strategy by WeTradeAIWeTradeAI - XAU/USD Weekly Volatility Strategy
This strategy is designed for Gold (XAU/USD) trading, leveraging a weekly market structure and volatility projection model. It dynamically identifies high-probability zones based on the prior week’s price action and adapts to intraday movement.
🔍 Core Logic:
Weekly High, Low & Midpoint: Defines structural balance for directional bias.
Projected Volatility Zones:
Green Zone: Upward projection from last week’s low.
Red Zone: Downward projection from last week’s high.
Half-Volatility Lines: Act as breakout or reversal triggers.
Monday Open: Serves as a temporary directional reference until midweek.
Daily High, Low, and Mid: Used for intraday stop-loss placement and validation.
🎯 Trade Entries:
Breakout Entries: Triggered when price breaks and holds above/below the Half-Vol levels.
Reversal Entries: Triggered by strong rejections near outer zones, reverting back toward equilibrium.
🛡️ Risk Management:
Dynamic Stop-Loss: Based on the previous day’s midpoint.
⏱️ Multi-Timeframe Usage:
4H – Weekly structure & context
1H – Trend alignment
15M – Precision entries

Performance (Improved + Position & Size) This indicator displays a performance heat-table on the chart, showing percentage returns for multiple timeframes such as 1W, 1M, 3M, 6M, 9M, 1Y and To-Date periods (MTD / QTD / YTD style).
The goal is to quickly visualize how the current symbol has performed across different timeframes in a compact and readable format.

Relative Price Strength - NIFTY MidcapThis script calculates the Relative Price Strength (RPS) of the current stock or instrument compared to the NIFTY Midcap 100 index. RPS is a ratio that helps traders identify whether a stock is outperforming or underperforming a benchmark index.

Direction LineThis is a simplified indicator for the TradingView platform, intended for beginner traders. It draws a line that follows the candle's closing price, coloring it green on an uptick (close > open) and red on a downtick. The indicator helps visualize the market impulse direction based on the basic concept of pivot levels, without unnecessary elements such as labels, alerts, or additional levels. Ideal for those who want to quickly understand the trend without data overload.
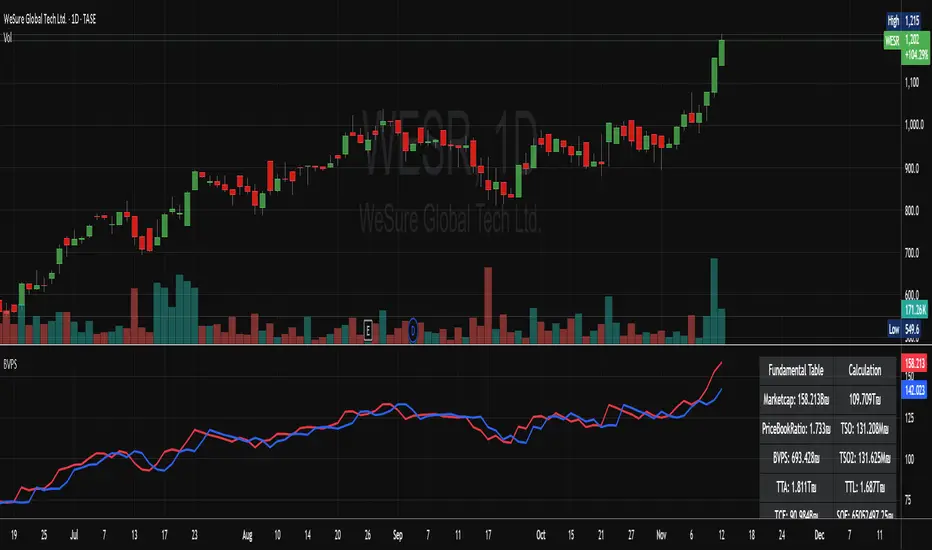
MarketCap + BVPSMarketCap + BVPS
Fundamental Summary Table Version 1 is currently being tested on the Israeli market and some stocks from the American market
Releasing a version after the data has been tested
And there is also interesting information that emerges from this indicator
עברית
טבלת סיכום פונדמנטלי גרסה 1 כרגע בדוקה על השוק הישראלי ועל כמה מניות מהשוק האמריקאי
משחרר גרסה לאחר שהנתונים נבדקו
וגם יש מידע מעניין שעולה מן האינדיקטור הזה! (מוזמנים לבדוק)
PipGuard LotMatePipGuard LotMate. Real-Time Risk & Lot Size Calculator
Indicator published by PipGuard.
PipGuard LotMate is an operational assistant that automatically calculates the optimal lot size in real time.
The logic is based on your risk per trade , simulated account balance , and stop-loss distance in pips .
It displays a compact, professional-looking table summarizing the key parameters of your risk plan perfectly integrated into your chart with a clean, modern design.
How it Works
• Automatic Risk Calculation:
The system operates in two modes:
1️⃣ Risk Percentage → calculates the risk as a fixed percentage of your account balance.
2️⃣ Risk Amount → lets you directly define the dollar amount ($) you wish to risk.
• Adaptive Pip Value:
The calculation automatically adjusts to the instrument in use (e.g., XAU, XAG, JPY, USD), ensuring an accurate pip value estimation across different markets.
• Interactive Table:
The table displays key data such as:
• Simulated Balance
• Calculation Mode
• Risk Percentage
• Risk Amount ($)
• Stop-loss Distance (pips)
• Recommended Lot Size , highlighted in PipGuard gold
How to Use
1. Set your simulated account balance .
2. Choose the calculation mode (percentage or fixed amount).
3. Define the stop-loss distance in pips.
4. Instantly view the recommended lot size in real time.
5. Use this information to maintain risk consistency across all trades.
💡 Perfect for traders seeking disciplined risk management, especially in high-volatility markets such as XAU/USD or leveraged currency pairs.
EXAMPLE OF USE
EXAMPLE OF USE
Settings
• Simulated Account Balance → Base balance for all calculations.
• Risk Percentage per Trade → Risk percentage applied to the balance.
• Risk Amount (in $) → Fixed amount to risk (active when *Risk Amount Mode* is selected).
• Number of Pips for Stop Loss → Average stop-loss distance in pips.
• Style Preset → Visual theme (*PipGuard Dark* or *Light*) to match your chart style.
• Table Size → Choose between *Small, Medium,* or *Large* display formats.
Limitations
• Calculations are theoretical and based on a simulated model.
• They do not account for broker commissions or slippage.
• All values are for educational and analytical purposes only .
Access
This script is designed for chart use and is free.
This script is publicly available as an educational risk management tool.
Educational tool for trade risk management and position size planning. Not financial advice.
Indicator published by PipGuard.

Session High and Lowmarks out previous NY session high/low, asian and london session high/low and updates automatically. Perfect indicator for overnight liquidity.

PE Fair ValueIn short, it’s an automated fair value estimator based on the price-to-earnings model, with full manual control if TradingView’s fundamental data is missing.
Summary:
1. Lets the user choose the EPS source – either automatically from TradingView fundamentals (EPS TTM) or a manual value.
2. Attempts to fetch the stock’s P/E ratio (TTM) automatically; if unavailable, it uses a manual fallback P/E.
3. Calculates:
Actual P/E = current price ÷ EPS
Fair Value = EPS × chosen (auto/manual) P/E
Percentage difference between market price and fair value
4. Plots the fair-value line on the chart for visual comparison.
5. Displays a table in the top-right corner showing:
EPS used
Target P/E
Actual P/E
Fair value
Current price
Difference vs fair value (colored green or red)
6. Creates alerts when the stock is trading above or below the calculated fair value.
7. Also plots the current closing price for reference.

EMA 9/15/45 + MACD Confirm + SupertrendThis indicator uses EMA 9, 15, 45 days along with combination of MACD and Supertrend

KriptoBotik 5 min TFCryptobot is effective on a 5-minute timeframe on any coin (with appropriate settings), with a grid of 10 averages, where each average is equal to the sum of previous entries, with a stop-loss. It can be configured for both local volatility and strong channel coverage, with adjustable entry amounts for each average and a percentage grid between averages. It can be connected to any exchange via API keys.

KriptoBotik 15 min TFCryptobot is effective on a 15-minute timeframe on any coin (with appropriate settings), with a grid of 10 averages (5 averages are sufficient with global settings), where each average is equal to the sum of previous entries, with a stop-loss. It can be configured for both local volatility and strong channel coverage, with adjustable entry amounts for each average and a percentage grid between averages. It can be connected to any exchange using API keys.
Ultimate Ichimoku Trend Board MTF – 6× Cloud Analyzer⚡️ Ultimate Ichimoku Trend Board MTF – 6× Cloud Analyzer
Unleash the full power of Ichimoku with this multi-timeframe trend dashboard ⚙️
Quickly identify whether each timeframe is Bullish 🟢, Bearish 🔴, or Inside the Cloud 🟠, and align your trades with the dominant trend like a pro.
🔥 Features:
✅ 6 customizable timeframes (M5 → H4)
✅ Clean & minimal dashboard — no chart clutter
✅ Instantly visualize market direction across all layers
✅ Perfect for scalpers, intraday, and swing traders
💡 See the Clouds. Read the Trends. Dominate the Market. 🌥💪

Earnings Lines Vertical – All Grey This provides a vertical grey line for prior earnings dates and also for any confirmed (not estimated) future earnings date

EPS Estimate Profile [SS]This is the EPS Estimate Profile indicator.
What it does
This indicator
Collects all EPS estimates over the course of a lookback and BINS them (sorts them into 10 equal sized categories).
Analyzes the returns from earnings releases based on the EPS estimate and the reaction.
Calculates the number of bullish vs bearish responses that transpired based on the EPS estimate profile.
Calculates the expected Open to High and Open to Low ATR based on the EPS estimate using regression.
Toggle to actual EPS release to compare once earnings results are released.
How to Use it
This indicator can be used to gain insight into whether an earnings release will be received bullishly or bearishly based on the company's EPS estimate.
The indicator allows you to see all historic estimates and how the market generally responded to those estimates, as well as a breakdown of how many times estimates in those ranges produced a bullish response or a bearish response to earnings.
Examples
Let's look at some examples:
Here is MSFT. MSFT's last EPS estimate was 3.672.
If we consult the table, we can see the average return associated with this estimate range is -4%.
Now let's flip to the Daily timeframe and take a look:
MSFT ended the day red and continued to sell into the coming days.
Let's look at another example:
MCDs. Last earnings estimate was 3.327, putting it at the top of the range with an average positive return of 4%.
Let's look on the daily:
We can see that the earnings had a huge, bullish effect on MCD, despite them coming in below their estimates.
If we toggle the indicator to "Actual" EPS release, to see the profile of Actual earnings releases vs response, we get this:
Since MCD under-performed, they were still at the top of the profile; but, we can see that the expected returns are more muted now, though still positive. And indeed, the reaction was still positive.
Distinguishing % Bullish/Bearish to Avg Returns
You will see the profile table displays both the average returns and the percent of bullish/bearish responses. In some cases, you will see that, despite a negative return, the profile reveals more bullish reactions than bearish.
What does this mean?
It means, despite there being more bullish responses, when bearish responses happen they tend to be more severe and profound, vs bullish responses likely are muted.
This can alert you to potential downside risk and help you manage risk accordingly should you elect to trade the earnings release.
ATR Prediction
You will notice in the bottom right corner of the screen a secondary table that lists the predicted open to high ATR and open to low ATR.
This is done using RAW EPS estimates (or raw ACTUAL estimates depending on which you select) and performing a regression to determine the expected ATR.
This is only for reference, the analysis should focus around the historic profile of return estimates and actual return values.
IMPORTANT NOTE: You MUST be on the Monthly timeframe to use this. Otherwise, you will get an error. If, on certain tickers with a huge history, such as MSFT and XOM or OXY, you get an error, you can simply reduce the lookback length to 80 and this will resolve the issue.
Conclusion
And that's the indicator!
A blend of some light math and fundamentals! A real joy honestly.
Hope you enjoy it!

Liqudity&Co Clean Sessionsindicator automatically plots high and low levels for all major trading sessions — Asia, London, and New York — helping traders identify key liquidity zones and structure points throughout the day. Designed for precision and clarity, it adapts seamlessly across timeframes and pairs, making it ideal for session-based strategies, sweep setups, and intraday market structure analysis.
Added level prices right on the lines for precise marking on any indice


Real Interest RateCalculates the real interest rate.
Highlights financial repression when the real rate is negative.
Adds visual clarity with color-coded plots and a shaded background.
Let me know if you'd like to add tooltips, alerts, or zone markers for deeper macro mapping.

Bybit BTCUSD.P 자동매매 전략 v12 (Pi Cycle 비율 필터)Abstract
Sigma Trinity Model is an educational framework that studies how three layers of market behavior interact within the same trend: (1) structural momentum (Rasta), (2) internal strength (RSI), and (3) continuation/compounding structure (Pyramid). The model deliberately combines bar-close momentum logic with intrabar, wick-aware strength checks to help users see how reversals form, confirm, and extend. It is not a signal service or automation tool; it is a transparent learning instrument for chart study and backtesting.
Why this is not “just a mashup”
Many scripts merge indicators without explaining the purpose. Sigma Trinity is a coordinated, three-engine study designed for a specific learning goal:
Rasta (structure): defines when momentum actually flips using a dual-line EMA vs smoothed EMA. It gives the entry/exit framework on bar close for clean historical study.
RSI (energy): measures internal strength with wick-aware triggers. It uses RSI of LOW (for bottom touches/reclaims) and RSI of HIGH (for top touches/exhaustion) so users can see intrabar strength/weakness that the close can hide.
Pyramid (progression): demonstrates how continuation behaves once momentum and strength align. It shows the logic of adds (compounding) as a didactic layer, also on bar close to keep historical alignment consistent.
These three roles are complementary, not redundant: structure → strength → progression.
Architecture Overview
Execution model
Rasta & Pyramid: bar close only by default (historically stable, easy to audit).
RSI: per tick (realtime) with bar-close backup by default, using RSI of LOW for entries and RSI of HIGH for exits. This makes the module sensitive to intra-bar wicks while still giving a close-based safety net for backtests.
Stops (optional in strategy builds): wick-accurate: trail arms/ratchets on HIGH; stop hit checks with LOW (or Close if selected) with a small undershoot buffer to avoid micro-noise hits.
Visual model
Dual lines (EMA vs smoothed EMA) for Rasta + color fog to see direction and compression/expansion.

PipGuard – FlashLevelsPipGuard – FlashLevels. Reactive Lines on New Local Highs and Lows
Indicator published by PipGuard.
PipGuard – FlashLevels automatically draws reactive lines every time a new high or low is formed within a user-defined bar range .
Each level consists of a dual-line setup (a main line plus a thicker, softer second line) and a price label for quick readability.
Lines can dynamically extend to the current candle and are automatically deleted once price breaks through them.
How it Works
• Level Detection:
When the price reaches the highest high or lowest low of the last *N* bars, the indicator marks a BuyStop (red) or SellStop (green) level.
• Dual-Line Design:
Each level features two synchronized lines the main one and a second, thicker and slightly faded one, for a clear and elegant visual style.
• Dynamic Management:
Lines can either extend to the current candle (live update) or remain fixed-length , depending on your preference.
Once price breaks a level , both lines and labels are automatically removed to keep the chart clean and accurate.
How to Use
1. Add the script to your chart.
2. Set the FlashLevels LENGTH (number of bars used for detection).
3. Choose whether to extend lines to the current candle or keep a fixed length .
4. Use the color coding and labels to distinguish BuyStop/SellStop and their exact price levels .
5. Integrate these reactive levels into your risk-management or trade trigger framework.
HOW TO USE
HOW TO USE
Settings
• FlashLevels LENGTH → Window used to detect new highs/lows.
• Length of Half-Line → Line length when live extension is disabled.
• Extend lines to the current candle? → Enables or disables dynamic extension.
• BuyStop/SellStop Color → Main line colors.
• Second Line Color → Thicker overlay line colors.
• Price Label Color → Text color for the price label.
Note: Both lines are synchronized in position and length to ensure visual consistency .
Limitations
• Levels are purely technical and depend on the selected bar range : shorter ranges can produce frequent updates .
• Lines are horizontal segments ; if you prefer levels that persist beyond the visible range, enable line extension.
• Past performance does not guarantee future results .
Access
This script is designed for chart use and is free.
Technical analysis tool designed to map dynamic price levels on new local extremes. Not financial advice.
Indicator published by PipGuard.

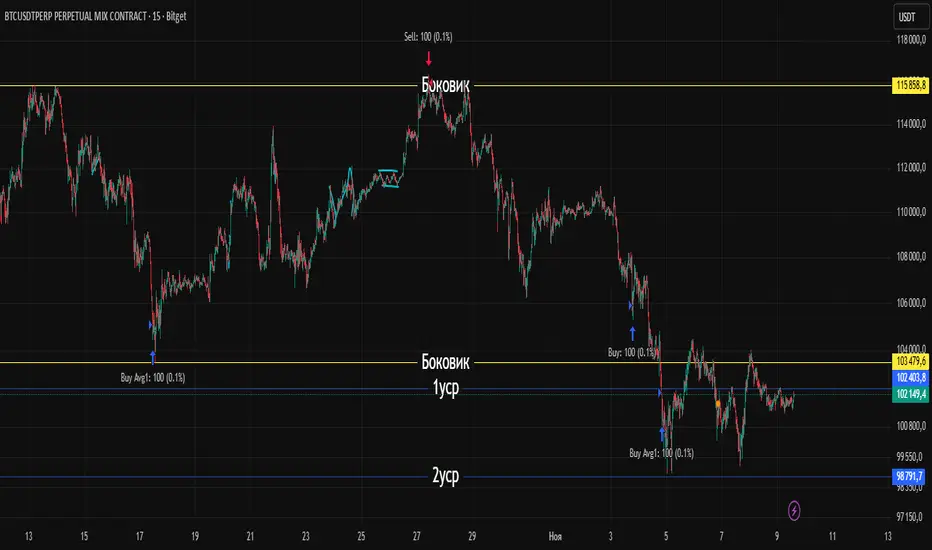
Ben's BTC Macro Fair Value OscillatorBen's BTC Macro Fair Value Oscillator
Overview
The **BTC Macro Fair Value Oscillator** is a non-crypto fair value framework that uses macro asset relationships (equities, dollar, gold) to estimate Bitcoin's "macro-driven fair value" and identify mean-reversion opportunities.
"Is BTC cheap or expensive right now?" on the 4 Hour Timeframe ONLY
### Key Features
✅ **Macro-driven**: Uses QQQ, DXY, XAUUSD instead of on-chain or crypto metrics
✅ **Dynamic weighting**: Assets weighted by rolling correlation strength
✅ **Mean-reversion signals**: Identifies when BTC is cheap/expensive vs macro
✅ **Validated parameters**: Optimized through 5-year backtest (Sharpe 6.7-9.9)
✅ **Visual transparency**: Live correlation panel, fair value bands, statistics
✅ **Non-repainting**: All calculations use confirmed historical data only
### What This Indicator Does
- Builds a **synthetic macro composite** from traditional assets
- Runs a **rolling regression** to predict BTC price from macro
- Calculates **deviation z-score** (how far BTC is from macro fair value)
- Generates **entry signals** when BTC is extremely cheap vs macro (dev < -2)
- Generates **exit signals** when BTC returns to fair value (dev > 0)
### What This Indicator Is NOT
❌ Not a high-frequency trading system (sparse signals by design)
❌ Not optimized for absolute returns (optimized for Sharpe ratio)
❌ Not suitable as standalone trading system (best as overlay/confirmation)
❌ Not predictive of short-term price movements (mean-reversion timeframe: days to weeks)
---
## Core Concept
### The Premise
Bitcoin doesn't trade in a vacuum. It's influenced by:
- **Risk appetite** (equities: QQQ, SPX)
- **Dollar strength** (DXY - inverse to risk assets)
- **Safe haven flows** (Gold: XAUUSD)
When macro conditions are "good for BTC" (risk-on, weak dollar, strong equities), BTC should trade higher. When macro conditions turn against it, BTC should trade lower.
### The Innovation
Instead of looking at BTC in isolation, this indicator:
1. **Measures how strongly** BTC currently correlates with each macro asset
2. **Builds a weighted composite** of those macro returns (the "D" driver)
3. **Regresses BTC price on D** to estimate "macro fair value"
4. **Tracks the deviation** between actual price and fair value
5. **Signals mean reversion** when deviation becomes extreme
### The Edge
The validated edge comes from:
- **Extreme deviations predict future returns** (dev < -2 → +1.67% over 12 bars)
- **Monotonic relationship** (more negative dev → higher forward returns)
- **Works out-of-sample** (test Sharpe +83-87% better than training)
- **Low correlation with buy & hold** (provides diversification value)
---
## Methodology
### Step 1: Macro Composite Driver D(t)
The indicator builds a weighted composite of macro asset returns:
**Process:**
1. Calculate **log returns** for BTC and each macro reference (QQQ, DXY, XAUUSD)
2. Compute **rolling correlation** between BTC and each reference over `corrLen` bars
3. **Weight each asset** by `|correlation|` if above `minCorrAbs` threshold, else 0
4. **Sign-adjust** weights (+1 for positive corr, -1 for negative) to handle inverse relationships
5. **Z-score normalize** each reference's returns over `fvWindow`
6. **Composite D(t)** = weighted sum of sign-adjusted z-scores
**Formula:**
```
For each reference i:
corr_i = correlation(BTC_returns, ref_i_returns, corrLen)
weight_i = |corr_i| if |corr_i| >= minCorrAbs else 0
sign_i = +1 if corr_i >= 0 else -1
z_i = (ref_i_returns - mean) / std
contrib_i = sign_i * z_i * weight_i
D(t) = sum(contrib_i) / sum(weight_i)
```
**Key Insight:** D(t) represents "how good macro conditions are for BTC right now" in a normalized, correlation-weighted way.
---
### Step 2: Fair Value Regression
Uses rolling linear regression to predict BTC price from D(t):
**Model:**
```
BTC_price(t) = α + β * D(t)
```
**Calculation (Pine Script approach):**
```
corr_CD = correlation(BTC_price, D, fvWindow)
sd_price = stdev(BTC_price, fvWindow)
sd_D = stdev(D, fvWindow)
cov = corr_CD * sd_price * sd_D
var_D = variance(D, fvWindow)
β = cov / var_D
α = mean(BTC_price) - β * mean(D)
fair_value(t) = α + β * D(t)
```
**Result:** A time-varying "macro fair value" line that adapts as correlations change.
---
### Step 3: Deviation Oscillator
Measures how far BTC price has deviated from fair value:
**Calculation:**
```
residual(t) = BTC_price(t) - fair_value(t)
residual_std = stdev(residual, normWindow)
deviation(t) = residual(t) / residual_std
```
**Interpretation:**
- `dev = 0` → BTC at fair value
- `dev = -2` → BTC is 2 standard deviations **cheap** vs macro
- `dev = +2` → BTC is 2 standard deviations **rich** vs macro
---
### Step 4: Signal Generation
**Long Entry:** `dev` crosses below `-2.0` (BTC extremely cheap vs macro)
**Long Exit:** `dev` crosses above `0.0` (BTC returns to fair value)
**No shorting** in default config (risk management choice - crypto volatility)
---
## How It Works
### Visual Components
#### 1. Price Chart (Main Panel)
**Fair Value Line (Orange):**
- The estimated "macro-driven fair value" for BTC
- Calculated from rolling regression on macro composite
**Fair Value Bands:**
- **±1σ** (light): 68% confidence zone
- **±2σ** (medium): 95% confidence zone
- **±3σ** (dark, dots): 99.7% confidence zone
**Entry/Exit Markers:**
- **Green "LONG" label** below bar: Entry signal (dev < -2)
- **Red "EXIT" label** above bar: Exit signal (dev > 0)
#### 2. Deviation Oscillator (Separate Pane)
**Line plot:**
- Shows current deviation z-score
- **Green** when dev < -2 (cheap)
- **Red** when dev > +2 (rich)
- **Gray** when neutral
**Histogram:**
- Visual representation of deviation magnitude
- Green bars = negative deviation (cheap)
- Red bars = positive deviation (rich)
**Threshold lines:**
- **Green dashed at -2.0**: Entry threshold
- **Red dashed at 0.0**: Exit threshold
- **Gray solid at 0**: Fair value line
#### 3. Correlation Panel (Top-Right)
Shows live correlation and weighting for each macro asset:
| Asset | Corr | Weight |
|-------|------|--------|
| QQQ | +0.45 | 0.45 |
| DXY | -0.32 | 0.32 |
| XAUUSD | +0.15 | 0.00 |
| Avg \|Corr\| | 0.31 | 0.77 |
**Reading:**
- **Corr**: Current rolling correlation with BTC (-1 to +1)
- **Weight**: How much this asset contributes to fair value (0 = excluded)
- **Avg |Corr|**: Average correlation strength (should be > 0.2 for reliable signals)
**Colors:**
- Green/Red corr = positive/negative correlation
- White weight = asset included, Gray = excluded (below minCorrAbs)
#### 4. Statistics Label (Bottom-Right)
```
━━━ BTC Macro FV ━━━
Dev: -2.34
Price: $103,192
FV: $110,500
Status: CHEAP ⬇
β: 103.52
```
**Fields:**
- **Dev**: Current deviation z-score
- **Price**: Current BTC close price
- **FV**: Current macro fair value estimate
- **Status**: CHEAP (< -2), RICH (> +2), or FAIR
- **β**: Current regression beta (sensitivity to macro)
---
## Installation & Setup
### TradingView Setup
1. Open TradingView and navigate to any **BTC chart** (BTCUSD, BTCUSDT, etc.)
2. Open **Pine Editor** (bottom panel)
3. Click **"+ New"** → **"Blank indicator"**
4. **Delete** all default code
5. **Copy** the entire Pine Script from `GHPT_optimized.pine`
6. **Paste** into the editor
7. Click **"Save"** and name it "BTC Macro Fair Value Oscillator"
8. Click **"Add to Chart"**
### Recommended Chart Settings
**Timeframe:** 4h (validated timeframe)
**Chart Type:** Candlestick or Heikin Ashi
**Overlay:** Yes (indicator plots on price chart + separate pane)
**Alternative Timeframes:**
- Daily: Works but slower signals
- 1h-2h: May work but not validated
- < 1h: Not recommended (too noisy)
### Symbol Requirements
**Primary:** BTC/USD or BTC/USDT on any exchange
**Macro References:** Automatically fetched
- QQQ (Nasdaq 100 ETF)
- DXY (US Dollar Index)
- XAUUSD (Gold spot)
**Data Requirements:**
- At least **90 bars** of history (warmup period)
- Premium TradingView recommended for full historical data
---
## Reading the Indicator
### Identifying Signals
#### Strong Long Signal (High Conviction)
- ✅ Deviation < -2.0 (extreme undervaluation)
- ✅ Avg |Corr| > 0.3 (strong macro relationships)
- ✅ Price touching or below -2σ band
- ✅ "LONG" label appears below bar
**Interpretation:** BTC is extremely cheap relative to macro conditions. Historical data shows +1.67% average return over next 12 bars (48 hours at 4h timeframe).
#### Moderate Long Signal (Lower Conviction)
- ⚠️ Deviation between -1.5 and -2.0
- ⚠️ Avg |Corr| between 0.2-0.3
- ⚠️ Price approaching -2σ band
**Interpretation:** BTC is cheap but not extreme. Consider as confirmation for other signals.
#### Exit Signal
- 🔴 Deviation crosses above 0 (returns to fair value)
- 🔴 "EXIT" label appears above bar
**Interpretation:** Mean reversion complete. Close long positions.
#### Strong Short/Avoid Signal
- 🔴 Deviation > +2.0 (extreme overvaluation)
- 🔴 Avg |Corr| > 0.3
- 🔴 Price touching or above +2σ band
**Interpretation:** BTC is expensive vs macro. Historical data shows -1.79% average return over next 12 bars. Consider exiting longs or reducing exposure.
### Regime Detection
**Strong Regime (Reliable Signals):**
- Avg |Corr| > 0.3
- Multiple assets weighted > 0
- Fair value line tracking price reasonably well
**Weak Regime (Unreliable Signals):**
- Avg |Corr| < 0.2
- Most weights = 0 (grayed out)
- Fair value line diverging wildly from price
- **Action:** Ignore signals until correlations strengthen

AI indicatorMCX:CRUDEOIL1! Improved by Agent
This indicator operated by our AI. We used fine-tune to improved it.
1. news agent: it will search news from bloomberg, and then self-improve.
2. price agent: it will connect the price api from exchange, and use langchain, langgraph to fixit.
3. blackswan
