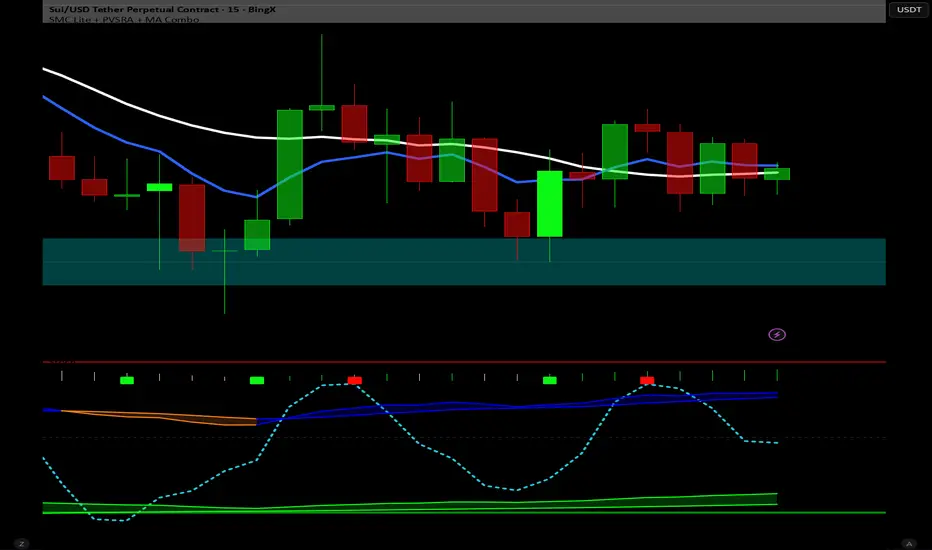
BTC 30 m Long singal Asset: Bitcoin only
Timeframe: 30 minutes
Entry Conditions (Long):
MACD histogram turns from red to green (negative to positive)
Stochastic K line crosses above D line AND this crossover happens below the lower band (20)
RSI is above the middle band (50)
K-macd

Project 1 - Complete with CMF and All IndicatorsProject 1 – Multi-Indicator Suite
This script combines several widely-used technical indicators into a single visual framework.
It is designed to help traders track momentum, trend strength, volume behavior, and money flow without switching between multiple tools.
Included components:
• MACD with dynamic color changes
• RSI with percentage change and directional marker
• ADX with trend-strength shading and Δ% calculation
• CMF (Chaikin Money Flow) with positive/negative flow tracking
• Volume Oscillator for short–long volume pressure
• Auto-updated labels for RSI, ADX, and CMF
• Lightweight visual lines to show momentum changes
Use cases:
• Trend confirmation
• Momentum diagnostics
• Volume-based pressure analysis
• Money-flow direction and strength
• Multi-factor confluence without indicator stacking
This tool does not generate buy/sell signals and does not imply trading outcomes.
It is a visual analytics suite built for discretionary technical analysis.

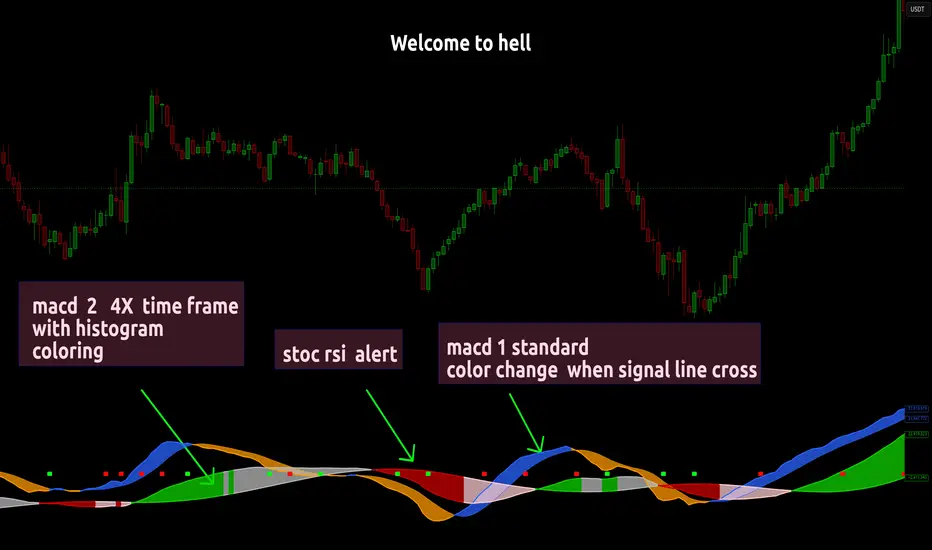
Dual MACD With Pilot Background + + Stoch RSI Alert HELL 2macd 1 chart time macd 2 4x chart time with over bought and over sold stoc rsi alerts
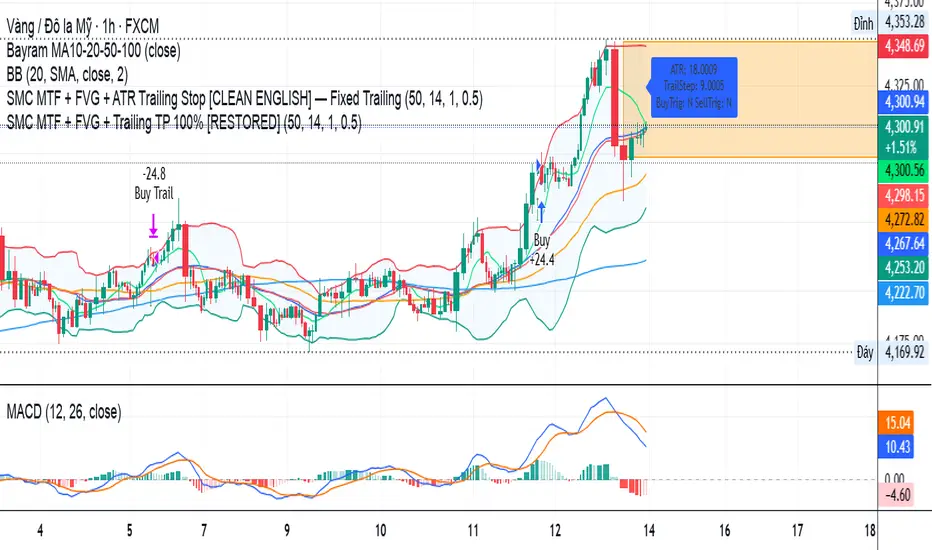
SMC MTF + FVG + Trailing TP 100% [FIXED]Component Description
Entry Timeframe: H1
Trend Filter: D1 (EMA50 vs EMA200)
Trend Filter Only enter BUY orders if EMA50 > EMA200 on D1 (uptrend)
Only enter SELL orders if EMA50 < EMA200 (downtrend)
Break of Structure (BOS) Identify the previous swing high/low breakout point
Order Block (OB) The candle area before BOS is marked with an orange box
Fair Value Gap (FVG) Check for the presence of a price gap to confirm Entry
Trailing TP Trigger trailing after reaching the desired R (in pips or ATR)
Hyper MACDThe Hyper MACD is a customizable momentum indicator exclusively designed for Scalping that blends traditional MACD logic with dynamic signal coloring, overbought/oversold detection, and WaveTrend overlays. It supports multiple moving average types and highlights key momentum shifts with visual markers and alerts.
The settings/alerts are self explanatory and are optimized for quick scalping, works for any timeframe.
Suggested rules are.
The MACD line and Signal line must be above the zero line to scalp
The price begins do decay when the Signal turns from white to orange, however if both the lines are above zero line, then its still game to scalp but cautiously.
The colors are telling on both the lines, blue indicates a bullish surge on both and green on macd and white on signal suggests the bullish trend continuation
It also prints take profit arrows along the way, and also possible trend reversals.

MACD FROM HELLthis is a double macd with 2 time frames macd 1 is chart macd 4 is 4X meaning the 1hr becomes the 4hr and it uses the histogram coloring for added detail ,, on top of that it has stochastic rsi Alerts set to trigger when k line goes above 99.9 or below 0.01 and exits ,, alert triggers on exit

WTC Step Buy Step Edition CbyCarlo📊 WT Cross Modified – Step Buy Step Edition (v4)
WTC_StepBuyStep_Edition is an enhanced, practical, and optimized version of the classic WaveTrend (WT) Cross Indicator.
Developed for the Step Buy Step project, this tool helps traders identify market momentum shifts, structural price zones, and potential reversal areas with high clarity and precision.
🔍 Concept & Purpose
This indicator builds upon the established WaveTrend / LazyBear logic and extends it with additional structural intelligence.
The goal is to make overbought/oversold phases and trend reversals easier to spot — while also highlighting historically validated price zones where the market has previously reacted strongly.
⚙️ Key Features
1️⃣ WT Cross Signals
WT1 (yellow) and WT2 (purple) visualize market momentum.
A WT1 cross above WT2 while below the Oversold zone (−53) can indicate potential Long opportunities.
A WT1 cross below WT2 while above the Overbought zone (+53) can indicate potential Short opportunities.
Signals only confirm after candle close to prevent repainting.
2️⃣ Dynamic “WT SignalZone” Panel
Displayed in the top-right corner, this panel shows the last three valid price levels derived from WT signals:
🟢 LonLev – Buy support levels from previous WT Long signals
🔴 ShoLev – Sell resistance levels from previous WT Short signals
These zones act as objective support/resistance structures, based on historical momentum turning points — not subjective lines.
3️⃣ Flexible Calculation Modes
Choose how levels are derived from each WT signal:
Pullback 50% → Midpoint of the signal candle (high+low)/2
Close → Close price of the signal candle
Next Open → Open of the following bar (ideal for system testing)
📈 How to Interpret the Indicator
Market Condition WT Event Meaning
WT1 < −53 & CrossUp Long Signal Potential reversal / buy zone
WT1 > +53 & CrossDown Short Signal Potential exhaustion / sell zone
Price revisits LonLev Support Re-entry or bounce zone
Price revisits ShoLev Resistance Profit-taking or short setup zone
This makes the tool highly effective for:
Swing traders
Zone-based trading strategies
Systematic re-entries
Identifying structural turning points
🧠 Advantages
No repainting (signals confirmed only after bar close)
Works on all timeframes (from intraday to weekly)
Clean overview without clutter or excessive chart markers
Excellent as a filter to confirm market context
💬 Best Use Case
Use WTC_StepBuyStep_Edition as a contextual confirmation tool.
It does not replace a full trading system — but it gives you objective, repeatable, and statistically relevant zones where the market has reacted before.
Combine it with price action, volume analysis, or trend tools for even stronger setups.
© Step Buy Step • Step-Buy-Step.com
Educational trading tool intended for market analysis.
Not financial advice.

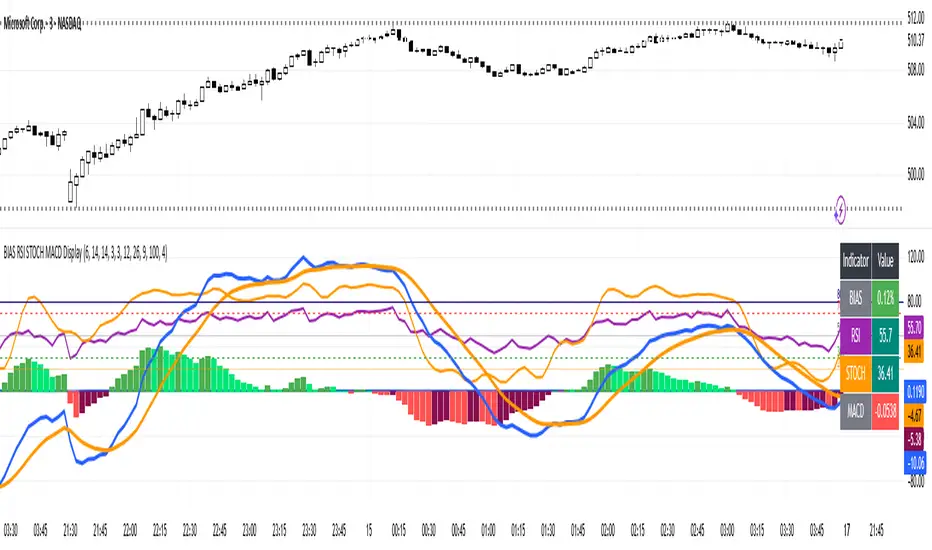
BIAS RSI STOCH MACD Displaysimple but effective to prevent chart clutter.
Hi Traders! Today I’m showing you a **custom indicator** that combines **BIAS, RSI, Stochastic, and MACD** in one easy-to-read panel. Let’s break it down:
1️⃣ **BIAS** – Shows how far the price is from its moving average.
* Positive BIAS → price is above the average.
* Negative BIAS → price is below the average.
2️⃣ **RSI (Relative Strength Index)** – Measures momentum.
* Above 70 → overbought
* Below 30 → oversold
* **50 line added** → midpoint for trend direction
3️⃣ **Stochastic (STOCH)** – Confirms momentum like RSI.
* Above 80 → overbought
* Below 20 → oversold
4️⃣ **MACD (Moving Average Convergence Divergence)** – Shows trend and momentum.
* Histogram colors indicate strength
* Lines show trend direction
5️⃣ **Visual Table** – On the top right, you can see all current indicator values at a glance, with color coding for easy interpretation.
6️⃣ **Plots & Levels** –
* BIAS, RSI, Stoch are plotted clearly
* RSI has **midline at 50** for trend reference
* Standard overbought/oversold levels highlighted
✅ **How to Use:**
* Look for RSI or Stoch crossing midline or extreme levels for potential entries.
* Check MACD histogram and lines for confirmation of trend strength.
* Use BIAS to see if price is stretched from the moving average.
This indicator is perfect for **momentum, trend, and mean-reversion traders**, giving multiple signals in one pane without clutter.
---
MACD Trend & Momentum Dashboard (Weighted, 3 TFs)This indicator provides a multi-timeframe MACD trend and momentum dashboard that works independently of your current chart timeframe. It displays MACD zero-line bias and MACD-vs-Signal trend state across three user-selectable timeframes, using clear color-coded cells for instant visual interpretation. A weighted scoring system combines all six signals into a single market bias classification (Strong Bullish → Strong Bearish). This helps traders quickly understand higher- and lower-timeframe alignment, market regime, and overall trend quality. Ideal for trend- and momentum-followers who want a clean, actionable market overview at a glance.

Multi-Confluence Signal System📊 OPTIMIZED MULTI-CONFLUENCE SIGNAL SYSTEM
A professional-grade trading indicator that combines multiple technical analysis methods to generate high-probability buy and sell signals. Designed for daily timeframe Bitcoin/crypto trading with optimized parameters based on real market backtesting.
🎯 KEY FEATURES:
- Multi-Confluence Scoring (8 components) - Each signal shows strength rating
- Smart Top & Bottom Detection - Catches reversals using price action patterns
- Ichimoku Cloud Integration - Dynamic support/resistance visualization
- Dual EMA System (20/50) - Clear trend identification
- RSI + MACD + Volume Confirmation - Multi-indicator validation
- Signal Alternation - Only shows directional changes (no repeated signals)
- Minimal Bar Spacing - Prevents signal clustering and overtrading
✅ OPTIMIZED FOR:
- Catching parabolic tops with rejection wicks
- Identifying capitulation bottoms in downtrends
- Avoiding false signals during consolidation
- 4-8 quality signals per 4-month period on daily charts
- Works in both trending and volatile markets
🔧 TECHNICAL COMPONENTS:
- EMA 20/50 trend system
- RSI (14) with adjusted overbought/oversold levels (68/32)
- MACD for momentum confirmation
- Ichimoku Cloud for trend context
- Volume analysis (1.3x threshold)
- Candlestick pattern recognition (engulfing, hammers, shooting stars)
- Capitulation detection for extreme moves
- Price extension filters (±5-10% from EMAs)
⚠️ BEST PRACTICES:
- Optimized for Daily timeframe
- Combine with your own risk management
- Higher scores = higher probability trades
- Wait for signal confirmation on candle close
- Use in conjunction with key support/resistance levels
💡 SIGNAL LOGIC:
BUY signals trigger on: Capitulation candles, extreme oversold + reversal patterns, MACD turnarounds in downtrends, or high confluence scores with bullish patterns
SELL signals trigger on: Rejection wicks at tops, bearish engulfings with overbought RSI, parabolic extensions, MACD reversals, or high confluence scores with bearish patterns
📈 Created through iterative backtesting and optimization on Bitcoin price action from 2024-2025.
⭐ Free to use • Leave feedback • Happy trading!

GSC MACD by TejasThis script is based Mr. Saleel Choudhary, GSC Academy MACD Concepts. This indicator is available only for the GSC Students and No one else.
GSC MACD by TejasThis is an indicator based on Mr. Saleel Choudhary, GSC Academy MACD signals. This indicator is only and only available to GSC Students and Nobody else.
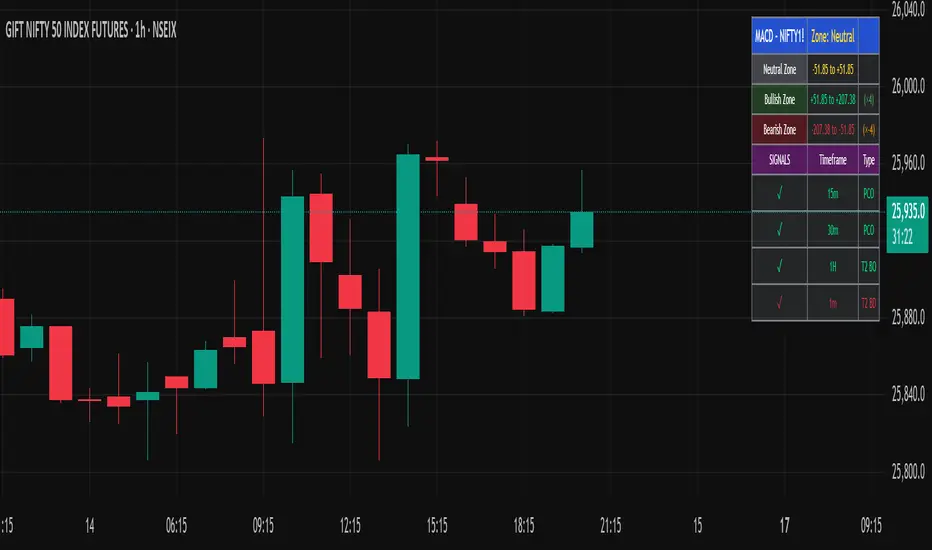
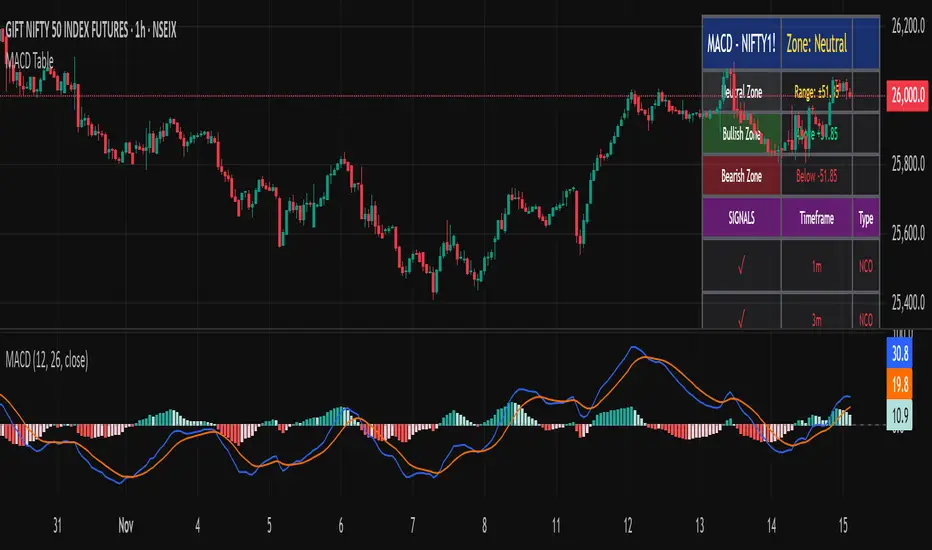
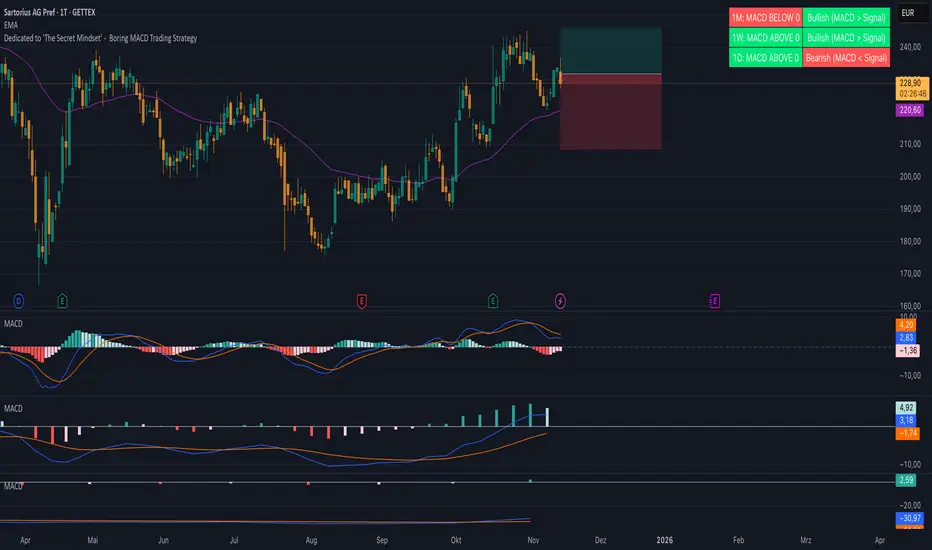
Boring MACD Trading Strategy - Dedicated to 'The Secret Mindset'This indicator displays the MACD status across three selectable timeframes, regardless of the chart timeframe you are currently viewing.
For each timeframe, it shows whether the MACD line is above or below the zero line, indicating bullish or bearish momentum.
It also shows whether the MACD line is above or below the signal line, revealing the current trend condition as bullish, bearish, or neutral.
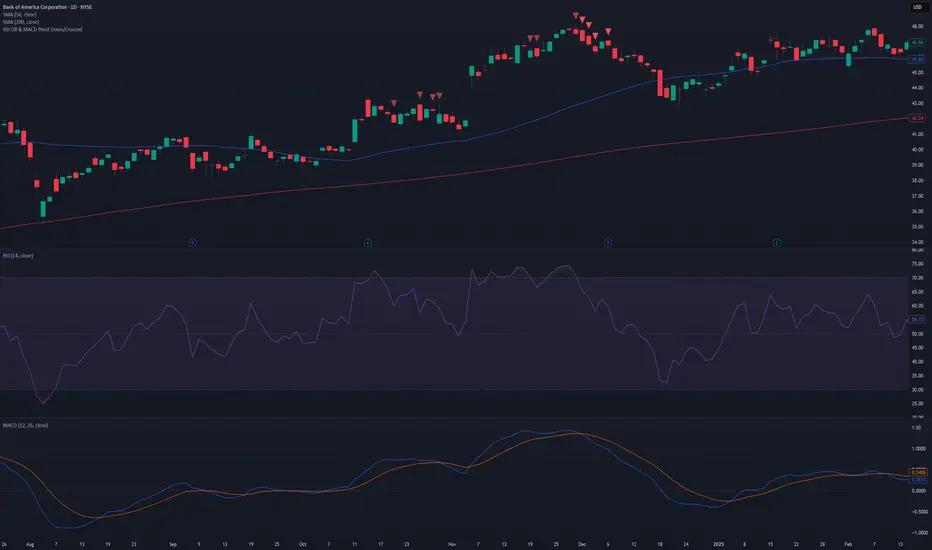
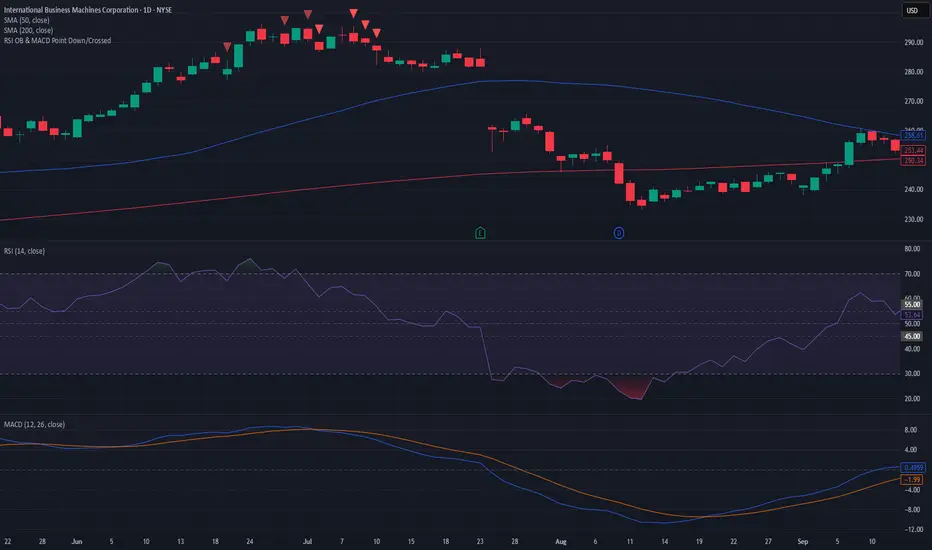
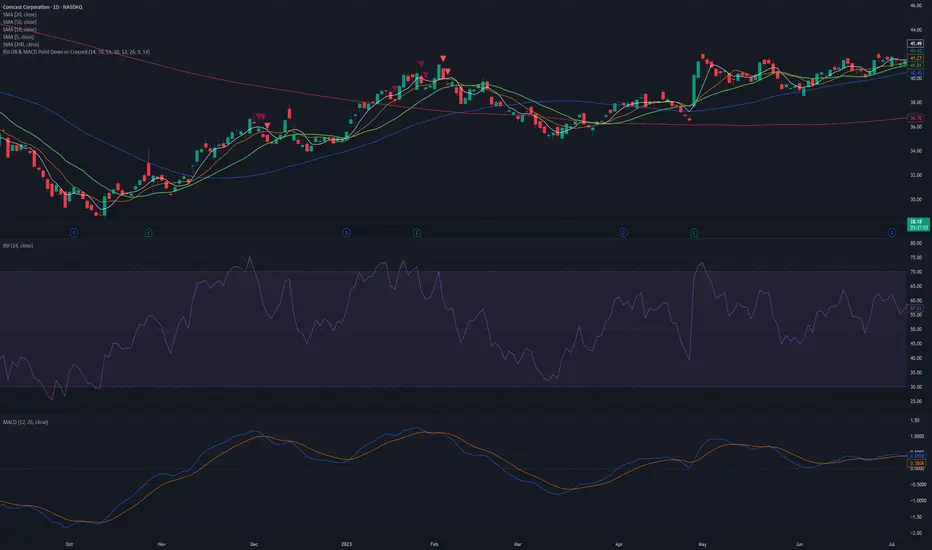
RSI OB & MACD Point Down or Crossed - PSPine script screener indicator for RSI OB and MACD point down or cross.
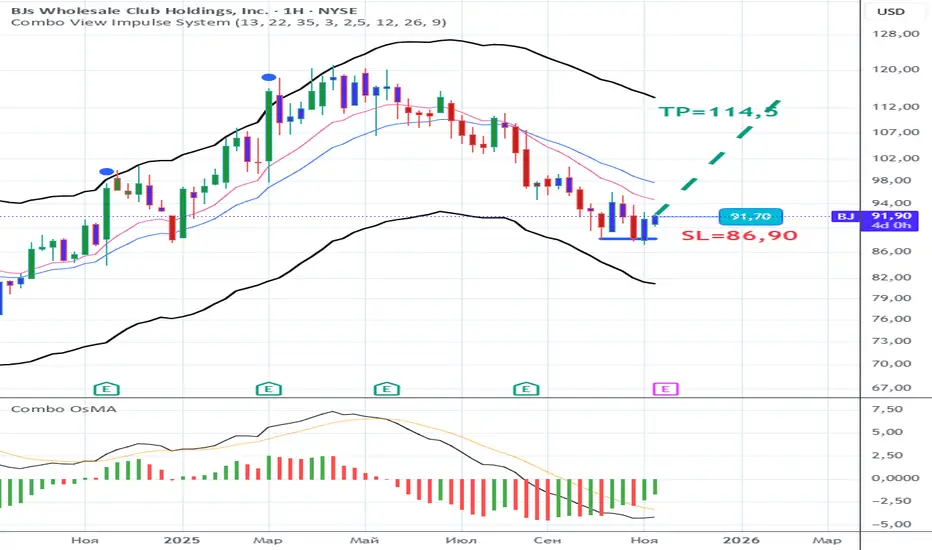
Combo OsMAMACD + OsMA Combo shows classic MACD (12,26,9) lines together with a colored OsMA histogram. Histogram bars change color based on momentum: one color for increasing bars, another for decreasing. Helps visualize trend strength and momentum shifts.

RSI + MACD Multi-Timeframe StrategyThis strategy combines the Relative Strength Index (RSI) from the daily timeframe with the Moving Average Convergence Divergence (MACD) from the 4-hour timeframe to generate precise long entry and exit signals.
The system uses a multi-timeframe approach to align longer-term trend conditions with shorter-term momentum shifts — allowing traders to catch dips with confirmation and exit before reversals.
🧠 Strategy Logic
✅ Long Entry Condition:
- RSI on the daily (1D) timeframe is oversold (below your defined threshold)
- MACD on the 4H timeframe crosses above the signal line
→ A long trade is opened when these two align
✅ Long Exit Condition:
- RSI on the daily timeframe is overbought
- MACD on the 4H timeframe crosses below the signal line
→ The long trade is closed when these two conditions are met
💡 This strategy currently supports long entries only. Short logic can be added if needed.
📊 Indicator Components
🔹 RSI (Relative Strength Index):
- A momentum oscillator that measures the speed and magnitude of price changes.
- Helps identify overbought (potential sell) and oversold (potential buy) conditions.
- Applied on the 1D timeframe (by default) to reflect broader market trend or exhaustion levels.
🔹 MACD (Moving Average Convergence Divergence):
- A trend-following momentum indicator based on moving averages.
- The MACD Line (fast EMA - slow EMA) crossing above the Signal Line indicates bullish momentum.
- Used here on the 4-hour timeframe (by default) for shorter-term momentum confirmation.
🔹 Multi-Timeframe (MTF) Logic:
- Uses request.security() to pull higher timeframe data (1D for RSI, 4H for MACD).
- Ensures no repainting, as it only uses closed candles from the higher timeframe.
- Aligns longer-term signals with shorter-term entries, reducing false signals.
📈 Plotting Options
The script includes a plot selector input allowing you to toggle between:
- RSI Plot (with overbought/oversold lines)
- MACD Plot (MACD line and signal line)
- This helps visualize signal conditions clearly on your chart.
🛠 Customization
- RSI & MACD settings are fully configurable
- RSI and MACD timeframes can be adjusted independently
⚠️ Disclaimer
This strategy is provided for educational and informational purposes only.
It is not financial advice or a recommendation to buy or sell any asset.
Past performance does not guarantee future results. Always test strategies in a simulated environment before live use, and consult with a licensed financial advisor for investment decisions.

MACD - Ostinato TradingMACD oscillator from Ostinato Trading, the classic momentum indicator. With this particular code you can superpose two different MACD and add a background to display cross of second indicator if you don't want to display it completely.
