Market Session Boxes with Volume Delta [algo_aakash]This script highlights four key forex trading sessions — Tokyo, London, New York, and Sydney — by drawing color-coded boxes directly on the chart. For each session, it shows:
High and low of the session
Total volume traded
Volume delta (bullish vs bearish pressure)
Optional extension of session highs/lows into future candles
Cleanly labeled time range and stats
Users can:
Select which sessions to display
Customize session times (in UTC+0)
Choose colors per session
Toggle session labels and extension lines
Use Case: Designed to help intraday and short-term traders visualize market rhythm, liquidity zones, and session-based volatility. The volume delta metric adds an extra layer of sentiment analysis.
This tool works best on intraday timeframes like 15m, 30m, or 1H.
Disclaimer:
This indicator is for educational and visual analysis purposes. It does not constitute trading advice or guarantee results. Always conduct your own analysis before making trading decisions.
Londonsession

London/NY Sessions [jpkxyz]London/NY Sessions Indicator Guide
This indicator tracks the forex market's most active trading periods: London session, New York session, and their overlap.
This characteristics of the London and New York trading sessions are well documented and many traders use them as a key element in their trading strategies. It is most relevant in forex trading, however it is to an extend also applicable in cryptocurrencies.
London Session (08:00-16:00 UTC)
Most active trading session (35% of daily forex volume)
Highest trading volume and liquidity
Major price movements and trend development
Significant institutional participation
New York Session (13:00-20:00 UTC)
Second most active trading period
High institutional order flow
Major US economic releases
Significant impact on USD pairs
London/New York Overlap (13:00-16:00 UTC)
The most active period in forex markets:
Maximum market liquidity
Highest daily trading volume
Strong price movements
Tightest spreads
Peak institutional activity
This indicator helps traders:
Visualize key trading sessions
Track session highs and lows
Monitor overlap dynamics
Identify potential support/resistance levels (session highs/lows)

KillZones & Sessions [TradingFinder] Volume | Asia, London & NY🔵 Introduction
🟣 Session
The forex market operates 24 hours a day, 5 days a week, with only Saturdays and Sundays being off; traders often focus on one of the forex trading sessions instead of trying to trade in all markets 24 hours a day.
Trading sessions are time intervals during which a specific financial market is active and trades are conducted. The Asia, London, and New York sessions are the most important trading sessions throughout the 24-hour period, during which a significant amount of money and liquidity enters the market.
🟣 Kill Zone
Traders in financial markets profit from the difference between the price at which they buy or sell and the current market price. Traders have different time horizons for trading.
Among these, some traders engage in daily or even hourly trading and must operate during times when the market has desirable trading volumes and significant price movements.
Kill zones are segments of a session with higher trading volumes and price fluctuations compared to the rest of the session.
🔵 How to Use
🟣 Session Time
The "Asia Session" consists of two sessions: "Sydney" and "Tokyo." The beginning of this session, according to the "UTC" time zone, is at 23:00 and ends at 06:00. Similarly, the beginning of the "Asia KillZone," according to the "UTC" time zone, is at 23:00, and it ends at 03:55.
The "London Session" consists of two sessions: "Frankfurt" and "London." The beginning of this session, according to the "UTC" time zone, is at 07:00, and it ends at 14:25. Similarly, the beginning of the "London KillZone," according to the "UTC" time zone, is at 07:00, and it ends at 09:55.
The beginning of the "New York am" session, according to the "UTC" time zone, is at 14:30, and it ends at 19:25. Similarly, the beginning of the "New York am KillZone," according to the "UTC" time zone, is at 14:30, and it ends at 16:55.
The beginning of the "New York pm" session, according to the "UTC" time zone, is at 19:30, and it ends at 22:55. Similarly, the beginning of the "New York pm KillZone," according to the "UTC" time zone, is at 19:30, and it ends at 20:55.
Important : To prevent session overlap, the working hours of each session have slightly changed.
🔵 Features
🟣 Simultaneous Session and Kill Zone
With this indicator, you can simultaneously view the kill zone and session. High and low lines are used to indicate sessions, while filled areas with color represent kill zones. If you do not want to see kill zones, you can turn off the display settings.
🟣 Candle, Time, and Volume
Using the "More Info" feature, you can see the number of candles, elapsed time, and traded volume within the colored filled area.
🔵 Settings
•Show More Info: To display "More Info," you need to turn on this feature and turn it off whenever you don't need it.
• You can also customize these settings for each session separately :
o Display or hide session.
o Choose session color.
o Set session time range.
o Display or hide kill zone.
o Set kill zone time range.

Sessions KillZones Library [TradingFinder]🔵 Introduction
"The Forex Trading Sessions" highlight the active periods across different markets where significant trading volume and influence on the forex market are evident. The primary trading sessions globally include the "Asian Session," "London Session," and "New York Session."
A "Kill Zone" refers to a segment within a session characterized by high trading volume and notably sharper price movements. Consequently, there's a higher probability of encountering price action setups within these zones. Traders capitalize on this phenomenon in pursuit of more successful trading outcomes.
If you aim to integrate sessions or kill zones into your indicators or strategies, utilizing this library can amplify the precision and efficiency of your Python script development.
🔵 How to Use
First, you can add the library to your code as shown in the example below:
import TFlab/SessionAndKillZoneLibrary_TradingFinder/1
🟣 Parameters
SessionDetector(Session_Name, Session_Time, KillZone_Time, Session_Show, KillZone_Show, AreaUpdate, MoreInfo, Session_Color, Info_Color) =>
Parameters:
•Session_Name (string)
•Session_Time (string)
•KillZone_Time (string)
•Session_Show (bool)
•KillZone_Show (bool)
•AreaUpdate (string)
•MoreInfo (bool)
•Session_Color (color)
•Info_Color (color)
Session_Name : You must enter the session name in this parameter.
Session_Time : Enter here the start and end time of the session, which should be based on the UTC time zone.
KillZone_Time : Enter the start and end times of the kill zone, which should be based on the UTC time zone, here.
Session_Show : You can control whether or not to show the session using this entry. You must set true to display and false to not display.
KillZone_Show : Using this input you can control whether the kill zone is displayed or not. You must set true to display and false to not display.
AreaUpdate : If you want the session to be determined based on the time and high and low of the session itself, you must enter "Session" and if you want the area to be determined based on the time and high and low of the kill zone, you must enter "Kill Zone".
MoreInfo : If you want more information, you should set this entry to true, otherwise set to false. This information includes the number of candles in the area, the length of time in the area and the volume of transactions in the area.
Session_Color : Enter your desired color to display the session at this section. It is recommended to use bright and sharp colors.
Info_Color : Enter your desired color to display more information in this section.
🔵 Function Outputs
The outputs of this function are direct and indirect.
🟣 Indirect outputs
These outputs include session display, kill zone display, and time and volume information of session or kill zone.
🟣 Direct outputs
There are 8 direct outputs, which are:
Session Time : If the Session is active, it outputs 1, and if the Session is inactive, it outputs 0.
Kill Zone Time : If the Kill Zone is active, it outputs 1, and if the Kill Zone is inactive, it outputs 0.
Open : Session opening price.
High : The highest price of the session.
Low : The lowest price of the session.
Close : The last price of the session.
Low Touch Alert : If "Area Update" is in "Kill Zone" mode, if the price reaches the lowest price of the kill zone in the same session after the end of the kill zone, this output will be true. You can use this output to create an alert.
High Touch Alert : If "Area Update" is in "Kill Zone" mode, if the price reaches the highest price of the kill zone in the same session after the end of the kill zone, this output will be true. You can use this output to create an alert.
Important : To use "Open", "High", "Low" and "Close", "Area Update" must be in "Session" mode.

Sniper BreakoutThis indicator is based on 3 indicator :=
1) Forex Market Session 2) Ema 200 3) Volume
This indicator is for Forex market ..in Forex market (ex- Eur/Usd ) price often (67%) do rotation in every session means example :let suppose a trade take trade in asian session and have 30 pips stop loss 67 % chance price will come back to entry price after London session or New York session so trade have less chance to make trade without hitting stop loss
in this indicator we are using Forex market session indicator to get session range start to end ..this indicator will only search opportunity in London And New York Session range and that can be customize from input section . user can select time zone and time of session from input section indicator and color of session .
next indicator using 200 length Exponential Moving Average for trend identification .if close price is above 200 Ema means trend is upside moving & if close price is below 200 Ema means price is moving downside .user can change length and source of Ema from input section .
Third and most important part is volume indicator when a session start (Example-London session it keep Look back 6 previous candle and compare volume imbalance between look back candle .look back candle can be customize from input section default look back candle input is (6).
next we are using trade range time to only show trade on certain time because often market convert into trading range so given specific input time it only take trade when volume and price is rising or falling .time range can be selected from input section .
Trade Entry Buy Signal -if price is either London or New York session and price is above 200 Ema and volume not in imbalance last number of candle it give Feb (first entry buy ) we keep save high price of every candle after Feb (label ) signal .if any candle break above Feb label it show a confirm buy signal ..Below in example as we can see
Example Image Buy Signal -
in this above example step -1 we searching imbalance of volume and price as we can see imbalance of volume and price on green candle .next we look price is above 200 ema .next step(2) we got Feb (first entry buy ) signal this is not a confirm buy signal .we save high of candle next candle high close above previous candle high we got confirm buy signal .
Trade Entry Sell Signal - if price is either London or New York session and price is below 200 Ema and volume not in imbalance last number of candle it give Feb (first entry Sell ) we keep save low price of every candle after Fes (label ) signal .if any candle break below Fes label it show a confirm sell signal ..Below in example as we can see
step-1 starting of london session we start getting imbalance between price and volume .price is getting rejected but volume is rising on green candle we got fes (first entry sell signal ).next we save low of fes candle but price close above that low of candle we dont get confirm sell entry next price break below low of previous candle so open a new sell signal ..
Example 3 - No Confirm buy/sell Signal
In this above Image example we did not get any confirm signal...we got first entry buy signal but price did not close high of candle in london session .so that day chance price can go any side ..
Example 4 -Feb signal and later confirm buy entry
in this above example we got imbalance of volume and feb(first entry buy signal) but we dont get any confirm buy signal price is just going high then previous candle ..later we see price crossover high of previous candle we got confirm buy signal
Use Of Indicator - This indicator helps traders identify potential trade setups by signaling the first entry points and confirming them later. It's particularly useful for avoiding getting caught in price rotations and aligning trades with significant volume and price movements. Traders should analyze price action and news before confirming a trade.

Sessions Lite [TradingFinder] New York, London, Asia, NYSE Forex🔵 Introduction
A trading session is one of the basic concepts in the financial market that refers to specific time periods. In fact, a session means hours during the day and night, during which traders in a certain part of the world conduct their transactions.
Although the "Forex" and "CFDs" market is open 24 hours a day and it is possible to trade in it, but in some hours the activity in this market decreases so much that many traders prefer not to trade and only watch the market. On the other hand, there are specific times when the market is very busy and dynamic, and many traders tend to trade during these hours of the day and night.
Trading sessions are usually divided into three main categories, which are "Asian", "European" and "North American" sessions. These trading sessions are also called the "Tokyo", "London" and "New York" sessions, respectively. But they also categorized these sessions in more detailed ways such as "Sydney session", "Shanghai session" or "NYSE session".
🔵 Tokyo trading session (Asian session)
After the weekend that happens on Saturday and Sunday, the Forex market starts with the Asian session. In this continent, most of the transactions are done in the Tokyo session, and for this reason, it is usually called the Asian session or the Tokyo session. However, other countries such as Australia, China and Singapore also do a lot of trading in this session.
The Tokyo session has a lower volume of transactions compared to the London and New York sessions, and therefore the liquidity is lower. In this session, most of the Forex currency pairs move in a price range. For this reason, different people use the ups and downs with the trading strategy in the range and get profit.
The low liquidity of the Tokyo session means that trading spreads are also higher during these hours. Besides, most of the transactions of this session are done in the early hours and at the same time as the planned news release.
In the Tokyo or Asia session, the best currency pairs to trade are the "Japanese yen", the "Australian dollar", and the "New Zealand dollar".
"Nikkei" index is also a good option for trading. If you trade in the Tokyo session, you should also be aware of the release of economic news and data from Australian, New Zealand and Japanese financial institutions.
🔵 London trading session (European session)
After the Asian session, it is time for the European session. In this period of time, transactions are very large and many European markets are involved. However, the European session is usually known as the London session.
Because of its specific time zone, London is not only known as the Forex trading center in Europe, but it is also known as the Forex trading center in the world. The London session overlaps with two other major trading sessions in the world, Asia and America. This means that most of the Forex transactions are done in this session. According to the latest statistics, 32% of Forex transactions are related to the London session, which shows that about a third of the activity performed in Forex takes place during this period.
This will increase the volume of Forex transactions and increase liquidity. An event that causes the spread of transactions to decrease. Of course, high liquidity also leads to greater volatility, which is desirable for many traders.
In the European session, the pound and euro currencies and the "DAX", "FTSE100", and "CAC40" indices are known as the best tradable assets. Also, traders of this session should pay attention to the news and data published by the "European Central Bank" and the "Bank of England". The news of countries like Germany, France and Italy are also very important.
🔵 American trading session (New York session)
When the New York session begins, several hours have passed since the end of the Tokyo session, but the European session is in the middle. In this session, they usually affect the financial activities carried out in America, but they also affect other countries such as Canada, Mexico and several South American countries.
The "US dollar" and stock indices such as "S&P", "Dow Jones" and "Nasdaq" are the most important assets that are traded in this session.
The early hours of the American session have a lot of liquidity and volatility due to the overlap with the European session, but with the end of the European session, the activity in the American session also decreases.
You can trade all major Forex currency pairs in the New York trading session. In this session, the "Federal Reserve", as the most important central bank in the world, is the institution that you should pay attention to its news and data.
The trading session indicator is an analytical tool in the financial markets that is used to display and analyze specific trading periods during a day. These indicators are generally useful for determining support and resistance levels during any trading session and for detecting different trading patterns.
For example, usually these indicators display the open and close price levels, the highest and lowest prices during a trading session. Also, you may notice various price patterns such as price channels, price phase phases and market trend changes during different trading sessions using these indicators.
🔵 cause of construction
In particular, the session light indicator version is designed and built for those traders who use many different tools on their chart at the same time. These traders can include "Volume Traders", "ICT traders", "Day Traders" and... These individuals can use "Session Lite" without disturbing the display of their other trading tools such as "Order Blocks", "Liquidity", "Zigzag", "FVG" etc.
But in general, there are several reasons for making tools like trading session indicators in financial markets, some of which include the following :
1. Analysis of specific time frames : Some traders and investors like to consider specific time frames for price analysis and review. For example, analyzing price changes during each trading session can help analyze trading patterns and identify trading opportunities.
2. Recognize different price patterns : Different price patterns may be observed during trading sessions. Trading session indicators can help to make better trading decisions by analyzing these patterns and their strengths and weaknesses.
3. Identifying Support and Resistance Levels : These tools may help to identify support and resistance levels during any trading session which can be helpful in deciding whether to enter or exit the market.
🔵 How to use
The Session Lite indicator displays 8 sessions by default. Asia session, Sydney session, Tokyo session, Shanghai session, Europe session, London session, New York session and New York Stock Exchange (NYSE) session are the sessions that are displayed.
You can activate or deactivate the display of each session by using the tick button next to the name of each session.
Two gray vertical dashes are also displayed by default, which indicate the beginning of the European session and the New York session. This feature is available for all sessions, but it is enabled by default only for these two sessions, and you can activate it for the rest of the session. You can enable or disable the display of this line by using the Start Session tick key.
Likewise, the information table is displayed by default, which includes the open or closed information of each session and the start and end times of each session. These timings are based on the UTC time zone.
Accordingly, the schedule of trading sessions is as follows :
Asia session from 23:00 to 06:00
Sydney session from 23:00 to 05:00
Tokyo session from 00:00 to 00:06
Shanghai session from 01:30 to 06:57
European session from 07:00 to 16:30
London session from 08:00 to 16:30
New York session from 13:00 to 22:00
New York Stock Exchange (NYSE) session from 14:30 to T 22:00
Important note : the beginning of the European session coincides with the opening of the Frankfurt market.
🔵 Settings
• In the settings section, there are customization capabilities according to the type of use of each user. The settings related to showing or not showing the box of each session, the start indicator of each session, setting the start and end time of the session and choosing the desired color to display each session are among the things that can be set from this section.
• At the end of the settings, you will see the "Info Table" option; By disabling this option, the "sessions" clock table displayed on the upper right side will be disabled.

Session breakThis indicator will show future lines before each session start. It will only show London session and US session start.
You can change the color of the lines and time as per day light savings.

Forex Kill Zones - SMC IndicatorsWhat are Kill Zones?
Kill Zones are specific Time Windows of opportunity during the Session that have the potential for the highest volatility and where looking for trading opportunities is ideal.
The Forex Kill Zone Indicator is specifically designed for the Forex Market. What differentiates this script from other Kill Zones scripts is that this script is based on NY Midnight as the basis for the start of the day.
This is not the usual below-average Kill Zone indicator because this indicator does not only show the 3 main Kill Zones or Sessions, but it also offers extra Kill Zones that are called "Asian Range (AR)", "Central Bank Dealing Range (CBDR)", and "FLOUT".
Another key differentiator of this indicator's functionality is that it shows the highs and lows of each Kill zone allowing SMC traders to monitor Time-Based Liquidity above the highs and lows of each trading session.
Another added benefit of this indicator is the Standard Deviations features for the AR, CBDR, and FLOUT that we added. The Standard Deviations act as key levels where there is a high probability of price reacting when in confluence with 1H or higher key levels (PD Arrays). The Standard Deviations are not pivot levels but are ranges above and below the Kill Zones that rely on TIME and PRICE in their calculations.
Finally, we have also incorporated a Notification function to remind the trader of the start of the trading Kill Zones to not miss out on potential trade opportunities.
Key Functionalities
1) Universal Time Reference:
Every day starts at 00:00 NY Midnight, irrespective of the trader's local time, Instead of the Standard GMT Midnight. This allows all Kill Zones to be in line with the New York start of the day at Midnight, as thought by ICT.
Weekend Highlighter
This feature highlights time from Sunday Market Open at 5 PM NY Time to 00:00 NY Midnight.
It's useful for identifying the non-trading or the low volatility periods when trading should be avoided.
Features Breakdown
Lookback Period
Defaulted to 60 trading days, aligning with “IPDA Data Ranges”, which is ideal for backtesting.
Adjustable for trading, and it's recommended to keep it at 20 trading days to focus on most recent data only.
24-hour Daily Intervals
The 24-hour intervals are not the same as the usual daily candle. Instead, the start of each trading day is anchored to the 00:00 NY Midnight.
Highlights "Days of the Week" labels, "Weekend" Trading Time, and the daily high-low ranges based on the start of trading day mark being at 00:00 NY Midnight.
London Kill Zone (Green)
Starts from 01:00 NY Time to 05:00 NY Time.
London closes at 12:00 NY Time.
Highlight the high and low of the London Kill Zone to Identify Time-Based Liquidity above and below the London Kill Zone Range.
Marks the London Close Session to mark the end of London End of the trading day, where volatility drops.
Highlights the time when there is the highest volatility during the London Session Kill Zone.
New York Kill Zone (Blue)
Starts from 07:00 NY time to 10:00 NY Time.
Marks The CME Open at 08:30 (the opening of the Bond Market).
Highlight the high and low of the New York Kill Zone to Identify Time-Based Liquidity above and below the NY Kill Zone Range.
Highlights the time when there is the highest volatility during the New York Session.
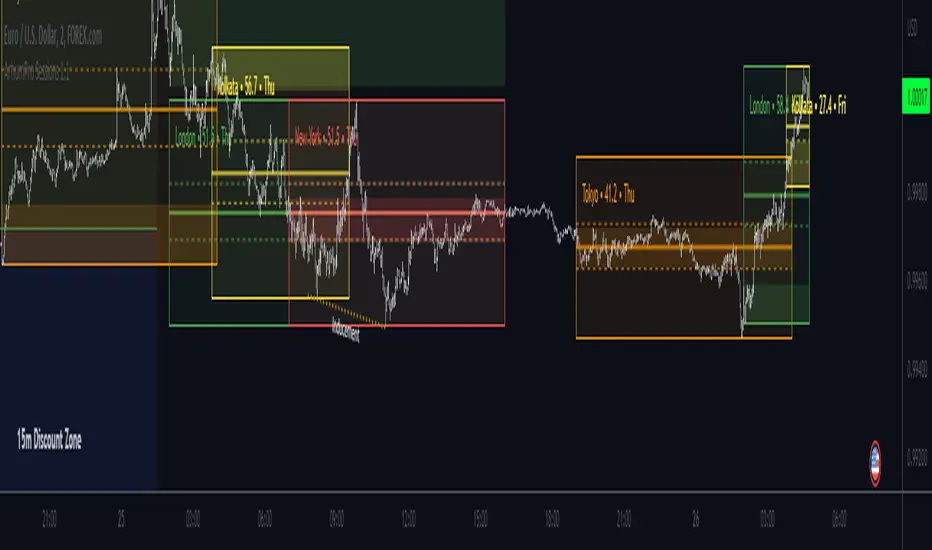
The Central Bank Dealing Range or "CBDR" (Orange)
Starts From 14:00 NY Time to 20:00 NY Time.
Highlight the high and low of the CBDR Kill Zone to Identify Time-Based Liquidity above and below the CBDR Kill Zone Range.
Also, there is an added ability to add the CBDR Standard Deviations above and below the CBDR.
Can also extend the CBDR Standard Deviations key levels until the end of the next day's London Kill Zone.
What are the CBDR Standard Deviations?
The Standard Deviations are extensions of the CBDR above and below the CBDR original range. It takes the high and low of the range and adds the range above and below the original range by x times.
The CCBDR Standard Deviations are NOT pivot levels. They are used as points of reference where we could expect the price to react when in confluence with higher timeframe reference points.
The idea behind them is that if the price is Bearish, the price could rally to +1 CBDR Standard Deviation below dropping lower. As shown in the image below on Thursday, the two vertical lines before the start of Thursday mark the CBDR Kill Zone, then the price rallied to +1 CBDR SDv and then dropped.
Asian Range "AR" Kill Zone
Starts from 20:00 NY Time to 00:00 NY Time.
Highlight the high and low of the AR Kill Zone to Identify Time-Based Liquidity above and below the AR Kill Zone Range.
Also, there is an added ability to add the AR Standard Deviations above and below the AR.
This KillZone should be primarily used when CBDR exceeds 40 pips.
Similar to the CBDR, the AR Standard Deviations also can be used as points of reference where we could expect the price to react when in confluence with higher timeframe reference points.
The AR Standard Deviations can also be extended until the end of the next day's London Kill Zone.
FLOUT Range
It Combines AR and CBDR, spanning from 14:00 NY Time to 00:00 NY Time.
The FLOUT should only be used when both AR and CBDR have small ranges of less than 10 pips combined.
Highlight the high and low of the FLOUT Kill Zone to Identify Time-Based Liquidity above and below the FLOUT Kill Zone Range.
The FLOUT Standard Deviations also can be used as points of reference where we could expect the price to react when in confluence with higher timeframe reference points.
The Flout Standard Deviations can be extended until the end of the next day London Kill Zone.
Bonus Features
Daily & Weekly Open Price Levels
The Open Price levels draw a horizontal line from the start of the trading day at 00:00 NY midnight, and it extends it towards the end of the trading day.
This is useful for understanding where the price is relative to the daily candle.
When Bullish, the trader should look for setups at or below the daily or weekly open price.
When Bearish, the trader should look for setups at or above the daily or weekly open price.
Whether to choose the Daily or Weekly open price depends on the trader's trading style. If the trader is day trading or scaling, then it's more appropriate to choose the Daily Open Price.
However, Day Traders can also use the Weekly candle to align with the Weekly Candle's expected range direction.
On the other hand, if the trader is a Swing Trader and wants to capitalise on the weekly candle's trend, then it's more appropriate to choose the Weekly Open Price.
However, Swing Traders can also use the Daily Open Price when looking to take a trade to time better entries with a high risk-to-reward ratio.
Notifications
The trader can also receive alerts as a reminder at the start of the desired session to not miss out on the start of the trading session.

London BreakOut ClassicHey there, this is my first time publishing a strategy. The strategy is based on the London Breakout Idea, an incredibly popular concept with abundant information available online.
Let me summarize the London Breakout Strategy in a nutshell: It involves identifying key price levels based on the Tokyo Session before the London Session starts. Typically, these key levels are the high and low of the previous Tokyo session. If a breakout occurs during the London session, you simply follow the trend.
The purpose of this code
After conducting my research, I came across numerous posts, videos, and articles discussing the London Breakout Strategy. I aimed to automatically test it myself to verify whether the claims made by these so-called trading gurus are accurate or not. Consequently, I wrote this script to gain an understanding of how this strategy would perform if I were to follow its basic settings blindly.
Explanation of drawings on the chart:
Red or Green Box: A box is drawn on our chart displaying the exact range of the Tokyo trading session. This box is colored red if the trend during the session was downward and green if it was upward. The box is always drawn between the high and the low between 0:00 AM and 7:00 AM UTC. You can change the settings via the Inputs "Session time Tokyo" & "Session time zone".
Green Background: The green background represents the London trading session. My code allows us to make entries only during this time. If we haven't entered a trade, any pending orders are canceled. I've also programmed a timeout at 11 pm to ensure every trade is closed before the new Tokyo session begins.
Red Line: The red line is automatically placed in the middle of our previous Tokyo range. This line acts as our stop loss. If we cross this line after entering a trade but before reaching our take profit, we'll be stopped out.
When do we enter a trade?
We wait for a candle body to close outside of the previous Tokyo range to enter a trade with the opening of the next candle. We only enter one trade per day.
Where do we put our Take Profit?
The code calculates the exact distance between our entry point and the stop loss. We are trading a risk-reward ratio of 1:1 by default, meaning our take profit is always the same number of pips away from our entry as the stop loss. The Stop Loss is always defined by the red line on the chart. You can change the risk-reward ratio via the inputs setting "CRV", to see how the result changes.
What is the purpose of this script?
I wanted to backtest the London breakout strategy to see how it actually works. Therefore, I wrote this code so that everybody can test it for themselves. You can change the settings and see how the result changes. Typically, you should test this strategy on forex markets and on either 1Min, 5 Min, or 15 Min timeframe.
What are the results?
Over the last 3-6 months (over 100 trades), trading the strategy with my default settings hasn't proven to be very successful. Consequently, I do not recommend trading this strategy blindly. The purpose of this code is to provide you with a foundation for the London Breakout Strategy, allowing you to modify and enhance it according to your preferences. If you're contemplating whether to give it a try, you can assess the results from the past months by using this code as a starting point.

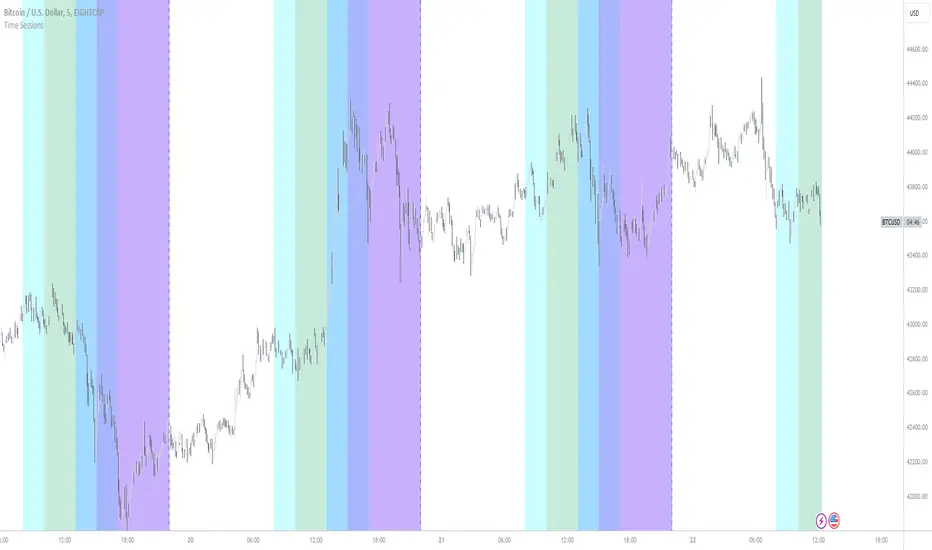
New York, London and custom trading sessionsHi Traders
The script :
The Time sessions script plots the trading sessions of both New York and London markets (background fills), In addition to the above the script also plots a user defined trading session period (vertical lines). All plots may be toggled true or false inorder to ensure you can focus on the respective market / markets / custom session.
Market sessions are useful for technical or quantitative analysis, as the majority of trading activity and net daily volume occurs in these zones, in fact the U.S./London market overlap tends to have the greatest volume accumulation across that range of time / bars than that range at any other time within the daily session. For FX traders it may also be important to take into account for many currency pairs the average exchange rate pip movement is greatest within these zones.
The custom session, is intended to be used for traders who trade only within specific intervals within the market session or day for 24/7 traded asset classes
Additional notes :
Not as of now, I have only added three optional trading sessions. If you would like to change the sessions, copy the scripts code and change the "ctm_session" default time range value, insuring the second time value is 1 min > than the first.
As always i Hope this is a useful script, and I will be updating this script in the near future.
Diddly - Charts (Asian, London & New York Session + Weekdays)Overview:
Diddly Charts is for providing intraday context to where we are in the market. It does this through a series of ranges displayed throughout the day, typically broken down into the Asian, London, and New York sessions.
This indicator also highlights key market structures like monthly, weekly, and previous day's highs and lows. Lines are provided for weekday and weekend separators, with the days of the week at the bottom of the chart, making it extremely useful for traders when identifying weekly cycles.
Usage:
All aspects of this indicator are changeable within the settings, allowing you to utilise the elements that are most important to your trading strategy.
The default layout is extremely useful for currency pairs, where traders use the London and New York boxes as windows of when to engage with the market. The times of these trading sessions can be changed to suit the trading periods that you want to trade.
Adhering to trading windows can help improve discipline to ensure that you are only taking entries within the time periods that match your trading strategy.
Some traders prefer a cleaner interface and don't want any indicator to detract from the price action they are reading, this can be achieved through changing the colour and their transparency in settings. In this example, you will see different labels used to annotate key structures, these can be changed to something that is relevant to your strategy in the settings.
It can also be used for trading Stocks where sessions are broken down into pre-market, market hours and post-market. This can be helpful to see those stocks that breakout of pre-market session highs and lows and also provide trading windows to keep traders out of trades that do not comply with their trading strategy.
Using higher time frames like a 4 hour chart or even the 1 hour chart, the intraday sessions are hidden away so traders can get a broader perspective without the clutter when zooming out. Although there are options to turn it on if you would prefer.
Here on a zoomed out 1 hour chart we have the option to only display the weekly line separator, which can help get an overview of weekly cycles.
Helpful Information
The main setting that you may want to change is at the top of the indicator settings, which is asking "what asset type" is the symbol being looked at. The indicator needs to know how to display the session range information. For example for currencies, the range size will be displayed in pips. For stocks or Futures it would display the financial amount. Beyond the visual display of information, this setting has no other impact on the indicator behaviour. The default setting is "Currencies".
We often get asked what the labels that appear on the chart mean. These can all be changed to your requirements, but by default what you will see when you apply the indicator to the chart is:
Under the Asian Range appears a couple of labels.
A = x : This is the range size of the session in pips for forex or amount for other assets, from the lowest to the highest price traded during that window.
ADR = y : This is the Average Daily Range over the last 21 days for this ticker
Under the London and New York session you will see a L = x or NY = y . This is the range size of each session in pips for forex or amount for other assets.
Structure Labels
YH = Yesterday's High
YL = Yesterday's Low
WH = Current Week's High
WL = Current Week's Low
MH = Current Month's High
ML = Current Month's Low
We greatly appreciate the support and feedback from the Trading View community, and we are dedicated to continuing to improve our indicators with your support.
We want to help you manage risk, and that's why we emphasise that trading is risky and any technology used to support our trading decisions is based on information from the past. We encourage traders to take responsibility for their trading businesses and always prioritise risk management.

PT Levels SessionsVersion 1.0 - PT Levels offers visual for Daily, Weekly, Monthly, Quarterly Yearly range.
Some sauces:
PT Range - Daily open, Monday High, Monday Low, Weekly Open
Weekend range, Wednesday range, CME Open, CME Close, NY Range, London Range & Asia Range
Strategy:
Price tends to gravitate between the Daily level when playing intraday scalps. If playing the weekly, you want to be above the weekly pivot to punt longs & under the weekly level to punt shorts. More likely than not, when the price hits a monthly or yearly level, we get a noticeable reaction off it.
These levels will give you an idea of where the price can react if reached. Consider them pivotal areas. We included a toggle that will help you go between the candle's High/Low to the candle's Open/Close. Both features are unique when scalping & swinging. The Level Sessions will paint a beautiful visual for your day-to-day trading & the Open/Close will help you determine where price maxed opened & closed for that specified timeframe.
If analyzing the crypto markets - Try to pay attention to price action on the weekend. We included a weekend range to offer a visual of the HIGH/LOW during the weekend when the volume is low & price is easier swayed.
Feel free to contact us for any suggestions. Check our indicator suite for the rest of our developed tools.

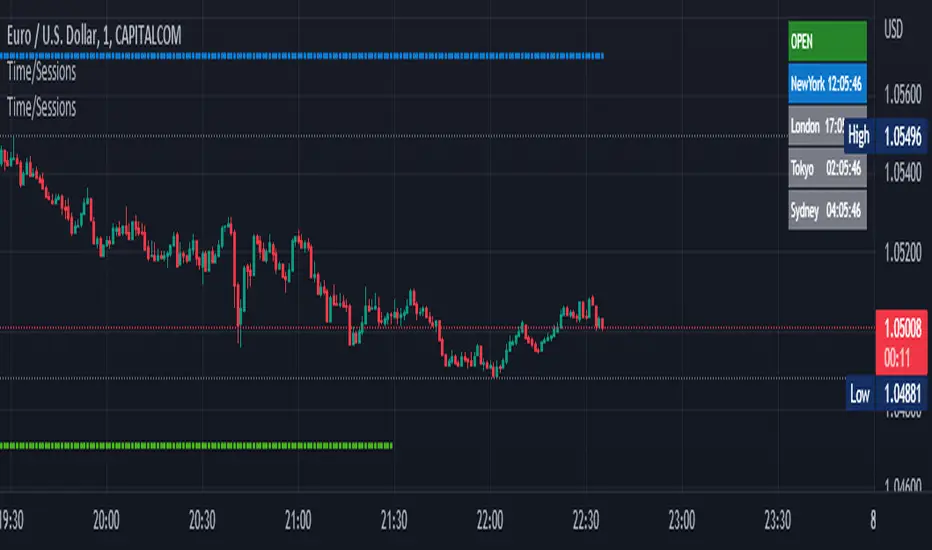
Time Zone / Market SessionsTime Zone / Market Sessions indicator is a handy tool to display current major Market Open / Close condition along with present time at that Exchange. Sydney, Tokyo, London, New York market sessions are included. Clear display of Overlap Zones and Kill Zones.. Can be used to estimate market Pumping and Dumping. Alerts can be set when a market opens.
Time is Displayed in Table Layout
Active Market is displayed as Dots on top and bottom
You can select as Timeline or Table display
Overlap is clearly displayed on top and bottom without any mess
Gray color in Table layout Shows Closed Markets
You are free to reuse this code No Limitations.
Kill Zones are indicated in Table format. When some of the markets are closed
Alerts included for market openings
Session candles & reversals / Flowly Indicators— Overview
Like traditional candles, session based candles are a visualization of open, high, low and close values, but based on session time periods instead of typical timeframes such as daily or weekly. Session candles are formed by fetching price at session start (open), highest price during session (high), lowest price during session (low) and price at session end (close). On top of candles, session based moving average is formed and session reversals detected. Session reversals are also backtested, using win rate and magnitude metrics to better understand what to expect from session reversals and which ones have historically performed the best.
By default, following session time periods are used:
Session #1: London (08:00 - 17:00, UTC)
Session #2: New York (13:00 - 22:00, UTC)
Session #3: Sydney (21:00 - 06:00, UTC)
Session #4: Tokyo (00:00 - 09:00, UTC)
Session time periods can be changed via input menu.
— Reversals
Session reversals are patterns that show a rapid change in direction during session. These formations are more familiarly known as wicks or engulfing candles. Following criteria must be met to qualify as a session reversal:
Wick up:
Lower high, lower low, close >= 65% of session range (0% being the very low, 100% being the very high) and open >= 40% of session range.
Wick down:
Higher high, higher low, close <= 35% of session range and open <= 60% of session range.
Engulfing up:
Higher high, lower low, close >= 65% of session range.
Engulfing down:
Higher high, lower low, close <= 35% of session range.
Session reversals are always based on prior corresponding session , e.g. to qualify as a NY session engulfing up, NY session must have a higher high and lower low relative to prior NY session , not just any session that has taken place in between. Session reversals should be viewed the same way wicks/engulfing formations are viewed on traditional timeframe based candles. Essentially, wick reversals (light green/red labels) tell you most of the motion during session was reversed. Engulfing reversals (dark green/red labels) on the other hand tell you all of the motion was reversed and new direction set.
— Backtesting
Session reversals are backtested using win rate and magnitude metrics. A session reversal is considered successful when next corresponding session closes higher/lower than session reversal close . Win rate is formed by dividing successful session reversal count with total reversal count, e.g. 5 successful reversals up / 10 reversals up total = 50% win rate. Win rate tells us what are the odds (historically) of session reversal producing a clean supporting move that was persistent enough to close that way too.
When a session reversal is successful, its magnitude is measured using percentage increase/decrease from session reversal close to next corresponding session high/low . If NY session closes higher than prior NY session that was a reversal up, the percentage increase from prior session close (reversal close) to current session high is measured. If NY session closes lower than prior NY session that was a reversal down, the percentage decrease from prior session close to current session low is measured.
Average magnitude is formed by dividing all percentage increases/decreases with total reversal count, e.g. 10 total reversals up with 1% increase each -> 10% net increase from all reversals -> 10% total increase / 10 total reversals up = 1% average magnitude. Magnitude metric supports win rate by indicating the depth of successful session reversal moves.
To better understand the backtesting calculations and more importantly to verify their validity, backtesting visuals for each session can be plotted on the chart:
All backtesting results are shown in the backtesting panel on top right corner, with highest win rates and magnitude metrics for both reversals up and down marked separately. Note that past performance is not a guarantee of future performance and session reversals as they are should not be viewed as a complete strategy for long/short plays. Always make sure reversal count is sufficient to draw reliable conclusions of performance.
— Session moving average
Users can form a session based moving average with their preferred smoothing method (SMA , EMA , HMA , WMA , RMA) and length, as well as choose which sessions to include in the moving average. For example, a moving average based on New York and Tokyo sessions can be formed, leaving London and Sydney completely out of the calculation.
— Visuals
By default, script hides your candles/bars, although in the case of candles borders will still be visible. Switching to bars/line will make your regular chart visuals 100% hidden. This setting can be turned off via input menu. As some sessions overlap, each session candle can be separately offsetted forward, clearing the overlaps. Users can also choose which session candles to show/hide.
Session periods can be highlighted on the chart as a background color, applicable to only session candles that are activated. By default, session reversals are referred to as L (London), N (New York), S (Sydney) and T (Tokyo) in both reversal labels and backtesting table. By toggling on "Numerize sessions", these will be replaced with 1, 2, 3 and 4. This will be helpful when using a custom session that isn't any of the above.
Visual settings example:
Session candles are plotted in two formats, using boxes and lines as well as plotcandle() function. Session candles constructed using boxes and lines will be clear and much easier on the eyes, but will apply only to first 500 bars due to Tradingview related limitations. Rest of the session candles go back indefinitely, but won't be as clean:
All colors can be customized via input menu.
— Timeframe & session time period considerations
As a rule of thumb, session candles should be used on timeframes at or below 1H, as higher timeframes might not match with session period start/end, leading to incorrect plots. Using 1 hour timeframe will bring optimal results as greatest amount historical data is available without sacrificing accuracy of OHLC values. If you are using a custom session that is not based on hourly period (e.g. 08:00 - 15:00 vs. 08.00 - 15.15) make sure you are using a timeframe that allows correct plots.
Session time periods applied by default are rough estimates and might be out of bounds on some charts, like NYSE listed equities. This is rarely a problem on assets that have extensive trading hours, like futures or cryptocurrency. If a session is out of bounds (asset isn't traded during the set session time period) the script won't plot given session candle and its backtesting metrics will be NA. This can be fixed by changing the session time periods to match with given asset trading hours, although you will have to consider whether or not this defeats the purpose of having candles based on sessions.
— Practical guide
Whether based on traditional timeframes or sessions, reversals should always be considered as only one piece of evidence of price turning. Never react to them without considering other factors that might support the thesis, such as levels and multi-timeframe analysis. In short, same basic charting principles apply with session candles that apply with normal candles. Use discretion.
Example #1 : Focusing efforts on session reversals at distinct support/resistance levels
A reversal against a level holds more value than a reversal by itself, as you know it's a placement where liquidity can be expected. A reversal serves as a confirming reaction for this expectation.
Example #2 : Focusing efforts on highest performing reversals and avoiding poorly performing ones
As you have data backed evidence of session reversal performance, it makes sense to focus your efforts on the ones that perform best. If some session reversal is clearly performing poorly, you would want to avoid it, since there's nothing backing up its validity.
Example #3 : Reversal clusters
Two is better than one, three is better than two and so on. If there are rapid changes in direction within multiple sessions consecutively, there's heavier evidence of a dynamic shift in price. In such case, it makes sense to hold more confidence in price halting/turning.

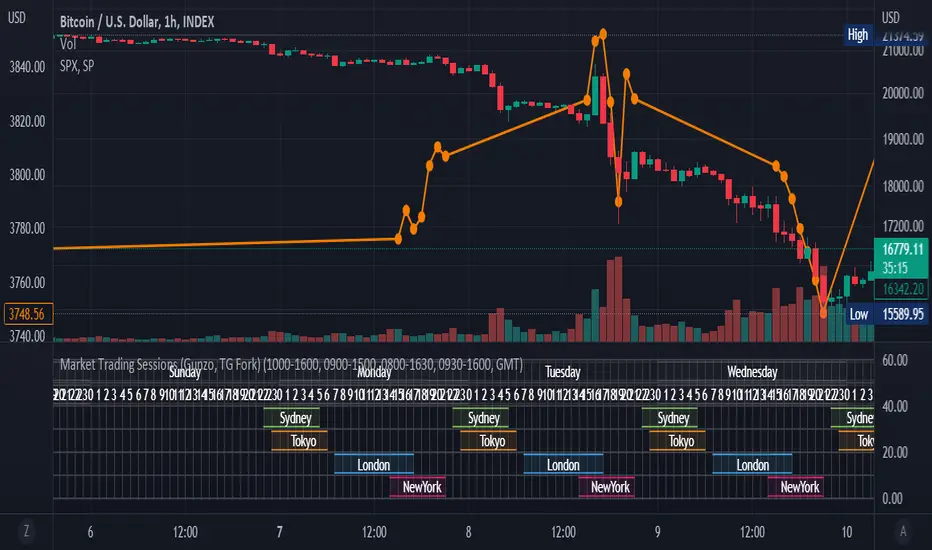
Market Trading Sessions (TG Fork)Visualize trading sessions opening hours of several international exchanges on a grid. Contrary to other indicators, this one automatically aligns the session with the current chart's timezone.
This is helpful for bar replay or manual backtesting, to spot patterns of correlations (this can also be used in conjunction with correlation indicators, see my other indicators).
Original indicator by Gunzo, if you like this indicator, please show the original author some love:
This indicator is also inspired by the following indicators:
ZenAndTheArtOfTrading with
UnknownUnicorn468659 with
This fork implements the following features:
Converted to PineScript v5.
Adapted default color palette to dark mode, as is the default in TradingView now.
Fix drawing issues, now the design shows as it was originally meant to be.
Fixed mistiming issue that made some sessions display with a delay compared to the real session, especially the first session was bar at the start of the session was not displayed.
Inputted the accurate timings for each session, instead of the default 0800-1600 in the original indicator.
Essentially, you can just add this indicator and it should work out of the box. If not, please let me know, and I'll try to fix it!
Market Sessions [Kaspricci]A simple indicator to show you the opening hours of the main markets in London, New York, Tokio and Sydney. It is not shown in your main chart window and as such does not make the chart more difficult to read.
You can turn each market on and off individually and also change the start and end time, if you wish so. All based on GMT timezone, but will be translated into your local timezone.
Happy to receive your feedback.

Trading Sessions [ArtiumPro]ArtiumPro Sessions is packed with tons of features and alerts to help you with your trading. It is public so enjoy it!
- History - Yes or No, No will show the most current session only.
- Pre-Sessions Range with Opening Range Breakout Alerts
- Pre-Sessions Range Can Be Listed From 15 minutes To 4 hours
- Sessions Line Style - Solid, Dash, or Dots
- Sessions Box - Default 1 Can Be Increased
- Sessions Closed Icon - Yes or No, No will show an icon on all previous sessions not active
- Pip Session Ranges
- Lookback (minutes) will color code opening range settings which you can also use for testing previous sessions ranges to help with strategies
Sessions Alerts
- Sessions Start/End
- Opening Range Breakouts
- Price Crossed Session's High/Low After Session Closed
Time Zones Supported:
- America/Los_Angeles - America/New_York - America/El_Salvador - America/Chicago - America/Argentina/Buenos_Aires
- Europe/London - Europe/Berlin - Europe/Moscow
- Asia/Dubai - Asia/Bangkok - Asia/Hong_Kong - Asia_Tokyo
- Australia/Bribane - Austalia/Sydney
- India/Kolkota
New York Session
London Sessions
Asian Sessions
Indian Sessions
Session High Low
This indicator shows Session High Low line and prices.
1: Session range is adjustable based on your timeframe. Nomore confusing timezone settings.
You can choose your timezone then set your Session start and end time.
Script will show you the following session high and low lines which is extendable until next session.
2: All historical lines and price levels are can be partially or fully hidden.
And line colors are adjustable so you can use suitable color on your chart.
Based on session you choose this script can be used as a session break strategy AKA (Asian session break, London session break strategy).
You can create your own trading Session and high lows.
Personally I monitor how price reacts on London session high lows during the NewYork trading session.
In this chart Session starts at 8am (London open) and closes at 12:30 (NewYork open). Script is showing high lows only in this session range.
Always double confirm with your trading style. It's not a Financial advice.
Inputs:
1: Hide history - Hides all historical lines and prices that means you can see only todays session.
2: Show price - Shows price level of session high lows. You can hide price level if you want to see only lines.
3: Session time - You can set your time range of session.
4: Start time - Session start time. You can see vertical line on your chart or you can hide line.
5: End time - Session end time. You can see vertical line on your chart or you can hide line.
6: Line extend time - End of the high low lines. You can draw line until the end of the session or you can draw short line.
7: All line and price colors are optional.
Thank you.

Fx Session RangeHello traders ,as you know the session timing plays a major role in trade execution.
I was searching for a good session indicator for a very long time but I was not satisfied with the indicators which are already available on Trading view. So I decided to code one my self.
This indicator is based on the timing provided by the website www.forex.timezoneconverter.com and time is set according to Ney York time zone.
I have added almost all major sessions including (Sydney , Tokyo and Frankfurt) and almost all features which I could.
I hope you guys 👍this indicator .
Incase you notice any bug or want any features added, let me know in comment section or you can Dm me as well.
Thank you all , enjoy :D
Futures Exchange Sessions 2.0Description
Successor to Futures Exchange Sessions indicator. Completely rebuilt code from the ground up. Every feature has been redesigned and refactored to be the most beneficial while allowing for complete configuration by the user.
This indicator displays Futures Sessions as live boxes that expand dynamically as price moves over the time interval. These boxes make liquidity levels extremely easy to spot and visualize. It helps the user identify market structure and develop their own bias of price action. Everything about the Session boxes can be configured. Box color, border color, border style, and border width are all individually controllable. Each Future Session can be turned on or off at any time. Also, each box has their own text label (Asian Session, London Session, New York Session) and this text can be moved around the box, change color, and change size.
Previous days highs and lows (major liquidity levels) are always important to the futures trader. This indicator now allows the user to individually display the three previous days highs and low levels as lines with optional label. Each line can be independently toggled on or off and like always, every conceivable customization option is available to the user. And the labels can be moved to the right (via the Input Settings) to allow unobstructed views of candles.
The midnight EST open and 8:30 AM EST open horizontal lines (developed by the Inner Circle Trader) are returning in this indicator. But the biggest improvement is that the lines stop at the current bar or the last bar of the trading day. Additionally, the time lines are displayed on previous days so the user can easily see how the candles reacted to these important times of the day.
The Session boxes and the horizontal time lines now can be set to only display a certain number of day back. If the user wants just to see Session boxes for the previous day only, they can do that. If the user wants to see the last 15 days of boxes or lines it is very easy to increase the days back in the settings. Currently, the max days back is 80 calendar days.
Additional Images
Easily visualize and understand price action across time
Everything is customizable so the user can easily match this indicator to their color preferences
Special Notes
To turn off box session text set opacity to 0%
Boxes and horizontal time lines only display when timeframe is <= 30 minute

Futures Exchange SessionsIn the 24-hour trading of the futures market, this indicator provides the user with full customization concerning the most important factor: time. This indicator is centered around three main visualizations: labels, backgrounds, and lines that minimalistically allows the user to keep track of the many time intervals that occur during a futures market 24-hour trading cycle. It also artfully displays the previous days highs and lows. And everything can be individually toggled and configured so the user can get exactly what they want.
Labels
There are three main futures market sessions in a 24-hour period: the London, New York, and Asian Sessions. Each session is given an independent label for the open and close times. The six labels (LO, LC, NYO, NYC, AO, AC) can be individually toggled on or off, the label background color changed, the text switched between black or white, and the height can be lowered or raised. These customizations are intended to give the user full control of the session they are interested in at the moment.
Backgrounds
Backgrounds are the heart of this indicator. There are different colored transparent backgrounds for each of the futures sessions. So the user can clearly see the session they want to highlight without cluttering their chart and getting in the way of analyzing the candles.
If you are familiar with the London and New York killzones, these backgrounds are each individually configured.
If you are familiar with the Inner Circle Trader’s (ICT) NY Morning and Afternoon sessions, these are available. Also, most times weird price action occurs during the lunch hour of these sessions. The London and New York have a background for their respective lunch hours so the user is never caught of guard during these periods.
Lines
The markets are constantly looking for liquidity. To help the user see runs on liquidity, this indicator projects the previous days highs and lows on to the current day with a line and a price label. The line make it very easy to see where price may be headed. See the image below for the perfect example of this phenomenon. Each of the lines can be independently controlled by color, style, and width. And even the labels can be toggled on or off if the user would prefer just to see the lines. Lastly, there is a line that marks the midnight open price in EST.
Special Notes
This indicator is specifically designed for futures tickers.
All of the backgrounds are not designed to be turned on a once (there are many that overlap). They are designed to give the user ultimate control over exactly what timeframe backgrounds to display on their charts.
The labels only appear when timeframe is 1 hour or less.

KVKZKVKZ = KV'S KILLZONES
This Indicator, break the charts into session: ASIAN, LONDON, NEW YORK.
-The 1st two vertical lines (red) indicates the ASIAN RANGE
-The 2nd two vertical lines (red & green) indicates the LONDON session
-The 3rd two vertical lines (green & blue) indicates the NEW YORK session
-The will be no trading in between the two red vertical lines
-A fake move is expected to happen in between the 2nd red vertical line and green line, this fake move is known as the JUDAS SWING by ICT, you can YouTube Judas Swing and check out his concepts
-There are two automatically moving horizontal lines (orange), that plots the ASIAN high and lows, these levels are expected to be manipulated in the London session, and this is called the Judas Swing
-the purple lines are known as Institution Zones, basically just levels 30pips above and below the ASIAN range
-this indicator works well with GBPUSD, EURUSD, USDCHF
-this indicator doesn’t work well with USDJPY, AUDUSD, NZDUSD
INPUTS:
HOUR 1: 17
MIN 1 : 0
HOUR 2: 0
MIN 2 : 0
HOUR 3: 6
MIN 3 : 0
HOUR 4: 12
MIN 1 : 0
THIS INDICATOR IS NOT A HOLY GRAIL, BUT IF YOU CAN READ PRICE ACTION WELL, THESE SESSIONS BREAK DOWN COULD BE VERY USEFULL.
Extras:
dot = dotted lines
dsh = dashed lines
sol = solid lines
NOTE: time has to be set to NY time.

World Markets Open/Close BackgroundIndicator fills background color on the chart for different markets around the world.
This can be helpful in some markets to understand after hours and premarket price action. User can study if there is correlation between highs/low in whole session or open/close of different markets.
Tokyo, Hong Kong and Shanghai are Asian Markets in Red are combined
Bombay, London and NYSE are individually plotted.
Times can be changed for each session to include the entire session, or selected block of 15 minutes.
Less than 15 minutes will need to be changed in the default value of the code which is why I'm publishing it open source.
All coded default times for each market are in CST.
Background color can be turned off individually under the Style tab, and can also be unchecked under Inputs and can just be used for source for further coding.
My intentions for this script is to use it and its variable value to plot the highs and lows just in the specific times in a session and to more easily visualize those sessions with color coding.
I hope this is useful
Cheers!
