ANN BTC MTF Golden Cross Period MACDHi, this is the MACD version of the ANN BTC Multi Timeframe Script.
The MACD Periods were approximated to the Golden Cross values.
MACD Lengths :
Signal Length = 25
Fast Length = 50
Slow Length = 200
Regards.
Convergence / Divergence de la moyenne mobile (MACD)

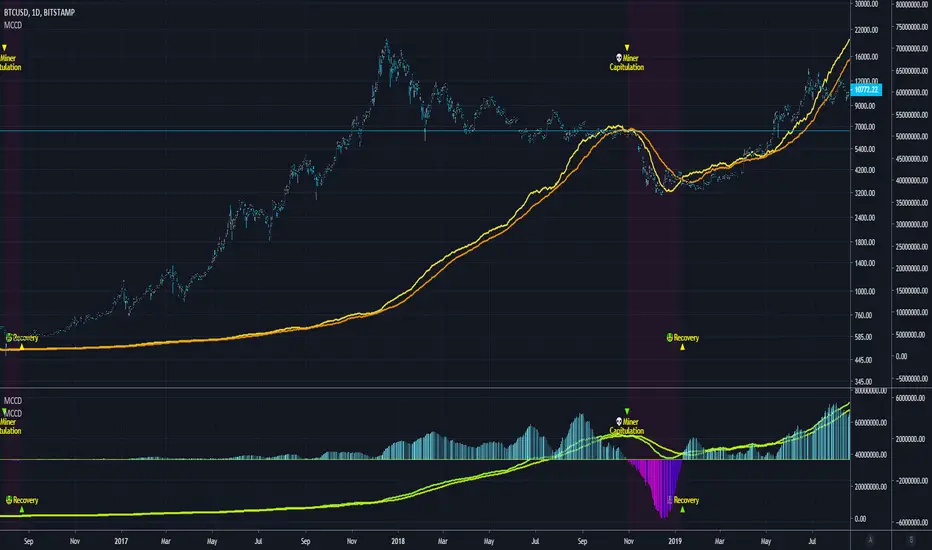
Blockchain Fundamentals - MCCD - Miner Capitulation Conv/Div🔗Blockchain Fundamentals - MCCD - Miner Capitulation & Convergence Divergence
(a.k.a. Hash Ribbons)
Intro
Miner Capitulation has been talked about alot recently in the news and on twitter. I wanted to join the in fun and add my own spin on things.
Description
This shows the 30 (yellow) and 60 (orange) day moving average of the hash rate of bitcoin. I added an option to show the convergence/divergence of the two moving averages in a visual manner similar to the MACD.
I also added the ability to select both the length and type of MA used in the calculation of the capitulation so you can experiment.
Other additions include bar coloration by trade state, and background highlighting of capitulation periods.
Editable Capitulation/Recovery plots will show clearly when the crosses happen.
The way to replicate my display is to add the indicator twice below the chart and combine in the same pane. First indicator displays the averages by default. The second one you enable convergence/divergence display option and uncheck the rest.
Last I add the indicator one more time and dragged it on chart. Do not combine the scales into one, of else it will ruin the scale (you want them separate scales). Its just showing you possibilities, use whatever works for you!
👍 We hope you enjoyed this indicator and find it useful! We post free crypto analysis, strategies and indicators regularly. This is our 73rd script on Tradingview!
💬Check my Signature for other information
Bollinger Bands on MacdOnly longs when Macd line is above Bollinger Band and shorts when Macd line is above Bollinger Band, this will avoid many problems.
thumbs up!!!

Mirror TSI-MACD by Trader JayI was playing around with the TSI-MACD and surprisingly it works quite well as a mirror.
There are 2 ways this can be used
1. Enter long when Blue line crosses up the Red
2. Exit long when Green line crosses the blue
or
1. Enter long when Blue line crosses up the Red
2. Exit long when Blue line crosses back down below the Red

Ori Visual MACDMACD is about a relationship between two Moving Averages. Visual Macd draws these two moving averages and shows MACD with color on them. It is helpful for understanding MACD.

McGinley Dynamic Convergence/Divergence [ChuckBanger]This is a MACD version with MaGinley Dynamic indicator invented by John R. McGinley. MaGinley Dynamic can be used as a moving average and is a highly reliable indicator. Here i use it instead of EMA witch normally is used to calculate MACD.
For more information of MaGinley Dynamic
www.investopedia.com
Schaff Trend Cycle w/ MACD HistogramWhat Is Schaff Trend Cycle? (Reference from Investopedia)
The Schaff Trend Cycle (STC) is a charting indicator that is commonly used to identify market trends and provide buy and sell signals to traders. Developed in 1999 by noted currency trader Doug Schaff, STC is a type of oscillator and is based on the assumption that, regardless of time frame, currency trends accelerate and decelerate in cyclical patterns.
How STC Works
Many traders are familiar with moving average convergence/divergence (MACD) charting tool, which is an indicator that is used to forecast price action and is notorious for lagging due to its slow responsive signal line . By contrast, STC’s signal line enables it to detect trends sooner. In fact, it typically identifies up and downtrends long before MACD indicator.
While STC is computed using the same exponential moving averages as MACD, it adds a novel cycle component to improve accuracy and reliability. While MACD is simply computed using a series of moving average, the cycle aspect of STC is based on time (e.g. number of days).
It should also be noted that, although STC was developed primarily for fast currency markets, it may be effectively employed across all markets, just like MACD. It can be applied to intraday charts, such as five minutes or one hour charts, as well as daily, weekly, or monthly time frames.
What's included the indicator?
Zero MACD lag algorithm (can be enabled/disabled)
MACD Histogram (has a different calculation to show the trend clearly. Can revert to original algo but will not truly reflect the current trend.)
Histogram peaks
STC pivots
How to use this indicator?
Use the STC overbought/oversold to determine trend strength.
Use the MACD zeroline crossover to determine the trend if bull/bear
For risky trades:
Long or cover when STC shows a bullish pivot. Exit or short on STC bear pivots
For conservative trades:
Long when MACD histogram crosses above midline. Exit or short on STC bear pivots
Settings:
Default is Fast - 5, Slow - 20. You can turn it up to Fast - 10, Slow - 30.
You can enable or disable certain features if you dont like to see them.

PHI MACDPhiCube calibrated 3-line MACD with candle coloring function at intersections! NOTE: Interesting to use in conjunction with PHI EMAs + MAs.
Personal Preferences: I use the Series 4 parameters, averages 72 17 34 and 144, but you can set it in the Flow Diffuser parameters 55 21 34 and 144, or according to your preferences.
Hope you like it!

MACD Pro Suite (Zeiierman)█ Overview
MACD Pro Suite (Zeiierman) redefines the classical MACD by transforming it into an adaptive market-behavior engine, instead of relying on a static fast–slow EMA configuration, the suite channels price through an efficiency matrix, a momentum acceleration core, and a multi-regime normalization layer. The result is a MACD architecture capable of shifting seamlessly between a volatility-conditioned oscillator, a probabilistic compression model, or a smooth, distribution-aware trend profiler, all emerging from the same underlying structure.
The MACD Pro Suite extends far beyond traditional MACD behavior by interpreting market structure in real time and adapting its responses to shifting conditions. It can detect subtle momentum transitions, quantify trend stability, reveal hidden inefficiencies in price movement, and highlight early regime shifts that standard oscillators completely overlook. Its dynamic normalization engine ensures consistency across different market environments, allowing the signal to remain clear during high volatility, low volatility, compression phases, expansions, and trend accelerations.
The system is designed to identify high-quality momentum turns, confirm trend continuity, and expose weakening market pressure before it becomes visible in price. It also reveals imbalances, impulses, and structural breaks with a level of precision that makes it valuable for discretionary traders seeking refined context and for systematic traders building rule-based models.
A built-in dashboard consolidates these behavioral states into an intuitive visual panel, making it easy to read market conditions at a glance and convert complex internal analysis into actionable insight.
⚪ Why This One Is Unique
MACD Pro Suite runs on a Hybrid Efficiency–Momentum engine that reshapes how the MACD responds to trend quality, noise, and impulse strength. This engine can operate in three distinct modes, letting the indicator shift between efficiency-driven behavior, momentum-driven behavior, or a balanced hybrid.
A multi-regime normalization system transforms the MACD into a stable, adaptive signal. It can operate as a volatility-balanced measure, a probability-styled compression model, a distribution-aware signal, or an ultra-smooth structural trend reader, all from the same core data. A real-time acceleration mechanism continuously adjusts the internal smoothing weights based on momentum intensity, giving the engine dynamic responsiveness as market conditions evolve.
Additional layers enhance this behavioral core:
Divergence mapping
Price inefficiency detection
Impulse markers
Adaptive exit structures
Significant move gradient zones
A multi-timeframe dashboard for immediate state awareness
█ Main Features
⚪ Efficiency Sources
Each efficiency source delivers a different style of structural interpretation, letting the MACD engine emphasize trend, pressure, or cyclical rotation depending on the chosen configuration and market environment.
Hybrid Efficiency–Momentum Core
In this mode, the MACD engine blends an efficiency-weighted price stream with momentum-based acceleration. The indicator adapts simultaneously to trend cleanliness, directional strength, and impulse intensity, giving it a balanced and highly reactive behavior profile.
Enhanced Momentum Core
Here, the engine uses raw price as the base input but applies a dynamic acceleration mechanism that adjusts internal EMA responsiveness in real time. The MACD becomes more reactive during strong momentum phases and more controlled during choppy, low-quality movement.
Efficiency Core
This framework routes the input through an efficiency pipeline where price, directional strength, or cyclic momentum is transformed into a cumulative efficiency path before MACD is calculated. It emphasizes structural clarity by suppressing noise and amplifying meaningful movement within the market.
⚪ MACD Shaping & Normalization Framework
Volatility Balanced Modes
These modes transform the MACD into a volatility-adjusted signal that automatically adapts to changing market conditions. The result is a cleaner and more stable read that adjusts naturally to expanding and contracting volatility while still preserving clear directional intent.
Tight Compression Modes
These shaping options re-scale MACD into compact 0 to 1 style ranges that are re-centered into a clean negative one to positive one structure. They produce a tightly controlled oscillator that highlights relative movement rather than raw amplitude.
Position Centered Modes
Here, the MACD is normalized using distribution-based scaling, allowing it to understand where it sits within its own movement range. This makes shifts in pressure and momentum easier to read and highlights when the indicator is moving into unusually strong or weak conditions.
Distribution Aware
These modes apply distribution-based transforms and robust statistical scaling. They stabilize MACD during irregular or skewed market conditions while preserving high-quality turning points
Volatility Filtered and Ultra Smooth Modes
These variants use multi-component volatility estimates and smoothed normalization to produce an exceptionally smooth MACD line. They maintain structure and trend behavior while filtering out low-value noise.
Robust Volatility Filtered
Ultra-Smooth Volatility Filter
⚪ Significant MACD Move
The Significant MACD module identifies when the MACD line enters a meaningful high-importance zone by evaluating its recent amplitude and confirming that momentum has held inside a defined activity region. Once active, a thicker overlay highlights periods where MACD is operating within this significant regime, while neutral phases use a base color for clear visual separation.
These highlights show when MACD is pressing into one of its internal pressure zones, helping you distinguish between ordinary momentum rotation and moments when the underlying push becomes strong enough to deserve attention. It is especially useful for spotting expansion phases, confirming breakouts, or identifying trend legs with real follow-through potential.
⚪ Signals
The suite includes directional signals that track meaningful shifts in market pressure and help highlight emerging turns or continuation strength, offering clear guidance when the market begins to turn or strengthen.
⚪ Divergences
When enabled, the suite automatically scans for regular bullish and bearish divergence between MACD and price. It identifies and marks structural pivot points where momentum and price begin to disagree. Because the MACD engine is built on efficiency and momentum rather than raw price alone, it can surface uncommon or non-traditional divergence structures that do not appear on standard indicators, often with noticeably higher accuracy.
Regular Bullish Divergence
MACD forms a higher low while price sets a lower low, signaling potential upward rotation.
Regular Bearish Divergence
MACD forms a lower high while price sets a higher high, indicating possible weakening momentum.
⚪ Price Inefficiency
The Price Inefficiency engine evaluates how balanced or imbalanced market movement is by analyzing a composite stream built from price, normalized MACD, normalized Signal, and smoothed structure. It measures how efficiently the market is progressing and identifies when movement becomes unstable, irregular, or out of sync with its underlying trend profile.
Blue diamonds plotted along the MACD zero line highlight periods where inefficiency is detected. This layer exposes subtle structural imbalances that often precede volatility bursts, failed moves, or regime transitions, giving traders early insight into when the market is behaving cleanly and when it is slipping into disorder.
⚪ Impulse Markers
The Impulse module identifies statistically extreme expansions in a smoothed, price-derived momentum stream. It highlights moments when momentum surges beyond normal behavior, marking them as either positive or negative impulses.
⚪ Visual Multi-Timeframe Dashboard
Along the right edge of the pane, a compact dashboard summarizes the MACD environment across 5M, 15M, 1H, 2H, 4H, and 1D. Each column reflects a key behavioral element derived from the MACD Pro Suite:
MACD Value – raw MACD pressure showing strength, weakness, or extreme displacement
MACD Signals – directional bias such as Long, Short, or neutral transitions
Histogram Signals – bull/bear momentum pulses extracted from the histogram structure
Divergence – bullish or bearish conflicts between MACD behavior and price movement
Inefficiency – imbalance zones where price behaves unstably or inefficiently
Impulse Moves – active bullish or bearish momentum bursts detected in real time
Think of it as a “MACD climate map.” Instead of flipping through multiple charts, you get an instant visual read on whether lower timeframes support the higher-timeframe environment or move against it. This makes multi-timeframe alignment straightforward and helps you decide when conditions favor aggressiveness, patience, or stepping aside entirely.
█ How to Use
The MACD Pro Suite is built to be exceptionally flexible. Because its core engine adapts to trend quality, volatility conditions, structural efficiency, and momentum strength, it can be shaped into almost any style of MACD behavior you need. From smooth trend-profiling to tight compression signals, from volatility-balanced structure to aggressive momentum tracking, the suite can be tuned to match your strategy, timeframe, and market environment.
Rather than forcing you into one interpretation of MACD, the framework gives you a set of behavioral modes that respond intelligently to changing conditions. It can act as a trend tool, a reversal detector, a structure mapper, or a regime classifier depending on how you configure it. This agility is what makes the suite useful for discretionary traders and system builders alike.
⚪ Classic MACD Trading
In its traditional form, MACD is used to track shifts in momentum and trend direction. The MACD line crossing above the Signal line often signals upward pressure, while crossing below suggests momentum is weakening or rotating downward. The histogram shows the distance between the two, making acceleration or deceleration easy to see at a glance.
These same interpretations apply directly within the MACD Pro Suite. Even with its advanced engines and normalization layers, the MACD and Signal lines still behave intuitively: crossovers mark directional shifts, zero-line transitions indicate broader trend bias, and histogram contractions or expansions reveal early momentum changes. This means you can trade it just like a classic MACD while benefiting from a far more adaptive and stable internal engine.
⚪ Fading Momentum Trading
MACD helps you spot fading momentum by watching the MACD line lose its slope and drift back toward the signal line. When the line stops accelerating and starts flattening, it’s a clear sign the trend is running out of strength. You also see fading momentum when both lines start moving back toward the midline, showing the impulse behind the trend is weakening even if the price hasn’t reversed yet.
Fading Momentum + Signals
If you spot fading momentum together with one of our Signals, it becomes a much stronger confirmation that the move is losing strength. When MACD momentum fades at the same time a Signal fires, the probability of a pullback or reversal increases significantly.
Fading Momentum + Divergences
The same applies when fading momentum aligns with divergences. If price makes a new high or low but the MACD line or histogram makes a weaker high/low, the divergence confirms that momentum is not supporting the move. Combined with fading MACD momentum, this is one of the strongest early warnings of an upcoming reversal.
⚪ Volatility and Breakout Trading
Volatility and breakout trading focus on how the market expands and contracts rather than on direction alone, and MACD Pro reacts beautifully to these shifts. When volatility increases, the MACD line tends to widen, steepen, or oscillate more aggressively. This makes it easier to see when the market is entering a high-energy phase that can lead to sharp breakouts or fast directional moves. As volatility cools, the MACD Pro begins to tighten and compress, with both the line and histogram pulling back toward equilibrium. This compression signals a contraction phase, often the calm before the next expansion.
You can spot volatility expansion when the MACD line or histogram behaves noticeably differently from recent behavior, such as sudden widening, rapid swings, or strong impulse signatures. These changes often highlight a volatility burst building beneath the surface. When that burst fades and the MACD compresses again, the market is usually preparing for a decisive move.
Settings used for Volatility and Breakout Trading:
Example Setting 1
MACD Moving average type: WMA
MACD Shaping: Raw MACD Behaviour
Momentum Multiplier: 6
Example Settings 2
MACD Shaping: Robust Volatility Filter
Momentum Multiplier: Increase toward 5
Example Setting 3
MACD Shaping: Distribution Balanced
Increase Momentum Multiplier: to exaggerate volatility bursts
Increase Efficiency Length: to filter minor fluctuations
⚪ Overbought / Oversold Trading
Overbought and oversold trading focuses on identifying when the price has stretched too far and is likely to rotate back toward balance. With the right shaping, the MACD can behave more like a bounded oscillator, making it easier to spot exhaustion on both sides of the range. When using tighter shaping or position-weighted behavior, the MACD becomes more responsive to market extremes while suppressing noise.
You can interpret overbought conditions when the MACD begins pressing into the upper region of its shaping range, showing that bullish momentum is becoming stretched. When it leans into the lower region, it signals oversold conditions and weakening bearish pressure. These zones help highlight exhaustion points, mean-reversion opportunities, and areas where a reversal or rotation is becoming increasingly likely.
Example settings:
MACD Shaping: Volatility Balanced
MACD Shaping: Tight 0–1 Band
MACD Shaping: Position Weighted
█ How It Works
⚪ Hybrid Efficiency–Momentum Engine
The core engine blends efficiency analysis with momentum dynamics, creating an adaptive MACD input stream that shifts between efficiency-centric, momentum-driven, or hybrid behavior depending on the selected mode.
Calculation: Builds the MACD input from either an efficiency-weighted cumulative path or a momentum-driven price stream, chosen by the engine mode.
⚪ Adaptive Momentum Response
A real-time responsiveness layer adjusts how quickly MACD reacts based on changes inside its structure. It becomes more responsive during fast-moving phases and naturally smooths itself during slower or noisy conditions.
Calculation: Computes a normalized responsiveness factor from structural deviation and injects it into the smoothing weights of the MACD EMAs.
⚪ Normalization & Behavior Shaping
A multi-regime shaping system re-scales and re-centers MACD using volatility filters, distribution transforms, compression modes, and ultra-smooth normalization to create consistent behavior across assets and volatility regimes.
Calculation: Applies shaping formulas to both MACD and Signal, then re-centers outputs to zero for unified interpretation.
⚪ Directional Signals
A lightweight structural reversal system highlights meaningful directional shifts, assisting with entries, exits, and bias confirmation during momentum transitions.
Calculation: Uses volatility-adjusted logic to detect directional flips and plot Up or Down markers.
⚪ Divergence Layer
The divergence engine detects structural disagreement between MACD and price, often surfacing uncommon divergence patterns thanks to the efficiency–momentum architecture.
Calculation: Identifies MACD pivots, aligns them with price pivots, and validates divergence through comparative structural thresholds.
⚪ Price Inefficiency Engine
This module evaluates imbalance in market structure by merging price behavior with internal MACD signals, highlighting unstable or disordered movement phases.
Calculation: Computes an inefficiency score from a blended composite source and maps imbalance intensity through adaptive thresholds.
⚪ Impulse Module
A momentum-intensity detector reveals statistically significant bursts in directional pressure, marking early expansion phases or exhaustion points.
Calculation: Extracts local extremes from a smoothed momentum field and confirms persistent surges through a cluster-based filter.
⚪ Significant MACD
This layer isolates high-importance momentum zones, making strong structural moves stand out clearly against routine oscillation.
Calculation: Evaluates MACD’s recent amplitude range and confirms when it enters a significant activity region, then applies enhanced visual styling.
-----------------
Disclaimer
The content provided in my scripts, indicators, ideas, algorithms, and systems is for educational and informational purposes only. It does not constitute financial advice, investment recommendations, or a solicitation to buy or sell any financial instruments. I will not accept liability for any loss or damage, including without limitation any loss of profit, which may arise directly or indirectly from the use of or reliance on such information.
All investments involve risk, and the past performance of a security, industry, sector, market, financial product, trading strategy, backtest, or individual's trading does not guarantee future results or returns. Investors are fully responsible for any investment decisions they make. Such decisions should be based solely on an evaluation of their financial circumstances, investment objectives, risk tolerance, and liquidity needs.

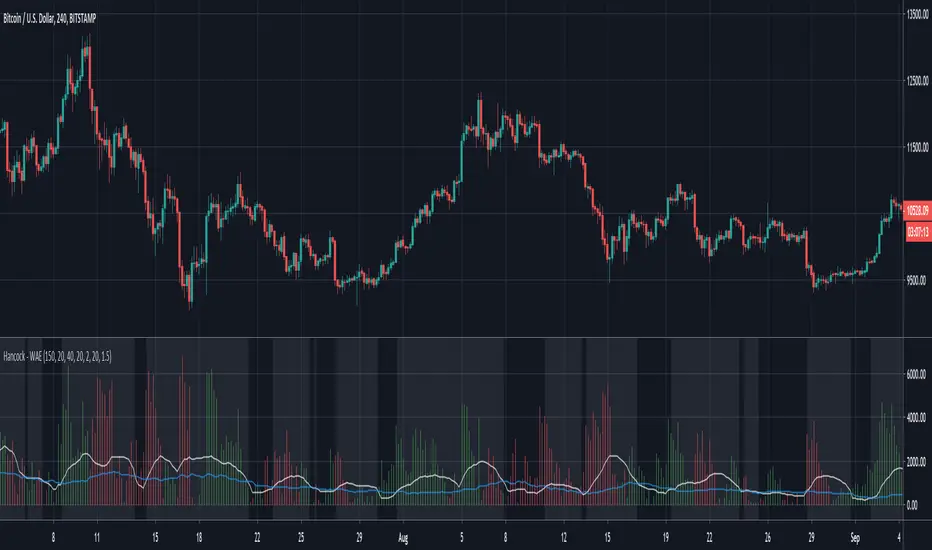
Hancock - WAEThis is a version of the LazyBear Waddah Attar Explosion indicator that incorporates the LazyBear Squeeze Momentum Indicator. Full credit goes to LazyBear for this and i've added links to his indicators used for a further explanation.
This histogram is a plot of the difference between the current and previous MACD multiplier by the sensitivity value. Green indicates an up trend and red indicates a down trend.
The white line is the lower BB subtracted from the upper BB and signals should be taken when the histogram is greater than this line.
The blue line is taken from the Squeeze Indicator and is the Keltner Channel. If the white line is less than the blue line it can be considered a squeeze and the background color of the indicator is coloured to indicate when not in a squeeze.
Happy trading folks!
Hancock
MAC-Z VWAP with divs & MACD Leader [ChuckBanger]This script is VWAP version of my MAC-Z indicator:
Right now it is my personal favorite. You can use it to spot divergences in both histogram and on the MAZ-Z line. You can also trade the MAC-Z line and its signal line crossovers. It also has MACD Leader crossover built in. MACD leader crossovers is indicated with a vertical line. Green for bullish and red for bearish.
Other signals
Green + = Bullish Divergence (Strong signal)
Red - = Bearish Divergence (Strong signal)
Green + = Hidden Bullish Divergence (Weak signal)
Red - = Hidden Bearish Divergence (Weak signal)
Green dot = Histgram crosses over zero line (Bullish signal)
Red dot = Histgram crosses below zero line (Bearish signal)

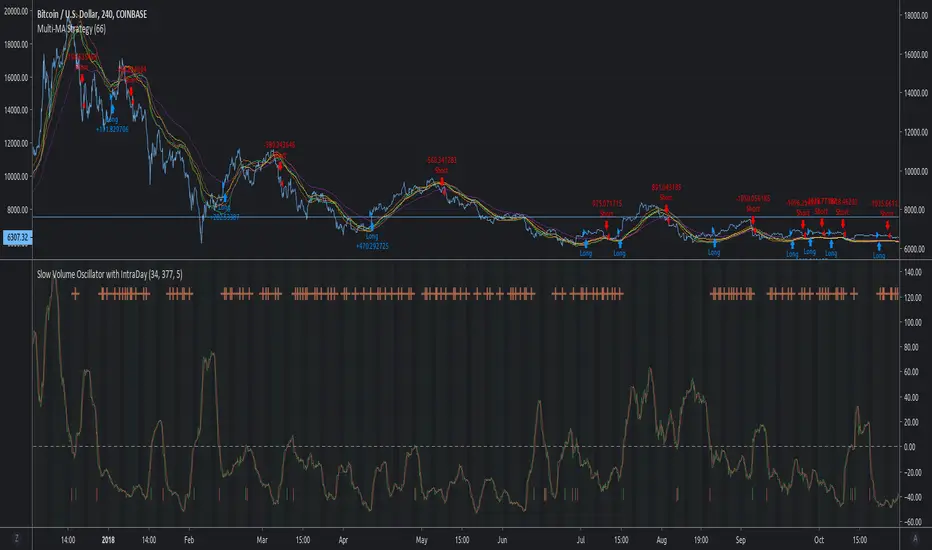
MACD Multi-MA StrategyThis script applies the average of each major MA (SMA, RMA, EMA, WVMA, WMA) to the MACD formula.
The logic is simple. When all 5 MA's are in agreement in direction, then then script will notify users of change.
I posted this as a strategy to help show how logic does in back test. If you use my simple yet effective solution to find take profit locations, you can blow this back testing out of the water!!!
To set alerts simply turn script into study
//@version=2
study(title="MACD Multi-MA Study", overlay=false)
src = close
len1 = input(8, "FAST LOOKBACK")
len2 = input(144, "SLOW LOOKBACK")
/////////////////////////////////////////////
length = len2-len1
ma = vwma(src, length)
plot(ma, title="VWMA", color=lime)
length1 = len2-len1
ma1 = rma(src, length1)
plot(ma1, title="RMA", color=purple)
length2 = len2-len1
ma2 = sma(src, length2)
plot(ma2, title="SMA", color=red)
length3 = len2-len1
ma3 = wma(src, length3)
plot(ma3, title="WMA", color=orange)
length4 = len2-len1
ma4 = ema(src, length4)
plot(ma4, title="EMA", color=yellow)
long = ma > ma and ma1 > ma1 and ma2 > ma2 and ma3 > ma3 and ma4 > ma4
short = ma < ma and ma1 < ma1 and ma2 < ma2 and ma3 < ma3 and ma4 < ma4
alertcondition(long == true, title='MACD LONG SIGNAL', message='MACD LONG!')
alertcondition(short == true, title='MACD SHORT SIGNAL', message='MACD SHORT!')
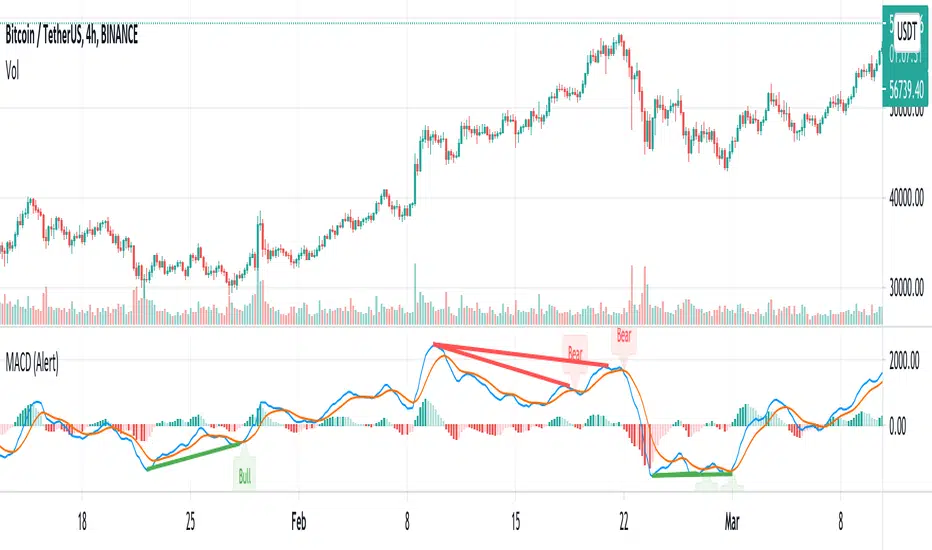
MACD w/ Divergences (Alert)To best use the MACD Divergence indicators, adjust the following settings accordingly.
• MACD Bullish Divergence Under: <0 (lower for larger volatility and more bearish markets)
• MACD Bearish Divergence Above: >0 (higher for larger volatility and more bullish markets)
Key Notes:
1. Set "Once Per Bar" instead of "Once Per Bar Close" alert.
The strategy already uses prior bar close (instead of current bar close) for calculation. This ensures that the signals will stay as they are after fired off, even when the current bar price is still changing.
2. It's OKAY to see the "alert may trigger differently than expected" warning.
Reason why you are seeing this warning is because we used a function called valuewhen() in our strategy. This function does not look at the entire history of data and has several limitations. For instance, on a 30min resolution, at the end of 2018, the function will be able to find past occurrences of BTC exceeding 16k. However, the function won't be able to find such occurrences at the end of 2019. Since our strategy is only concerned with very recent events, these limitations will not impact our results or cause repainting. You can find out more about this in the TradingView Wiki .
MACD w/ DivergencesTo best use the MACD Divergence indicators, adjust the following settings accordingly.
• MACD Bullish Divergence Under: <0 (lower for larger volatility and more bearish markets)
• MACD Bearish Divergence Above: >0 (higher for larger volatility and more bullish markets)
THIS SCRIPT DOES NOT REPAINT AND IS COMPLETELY FREE.
Goodluck Trading!

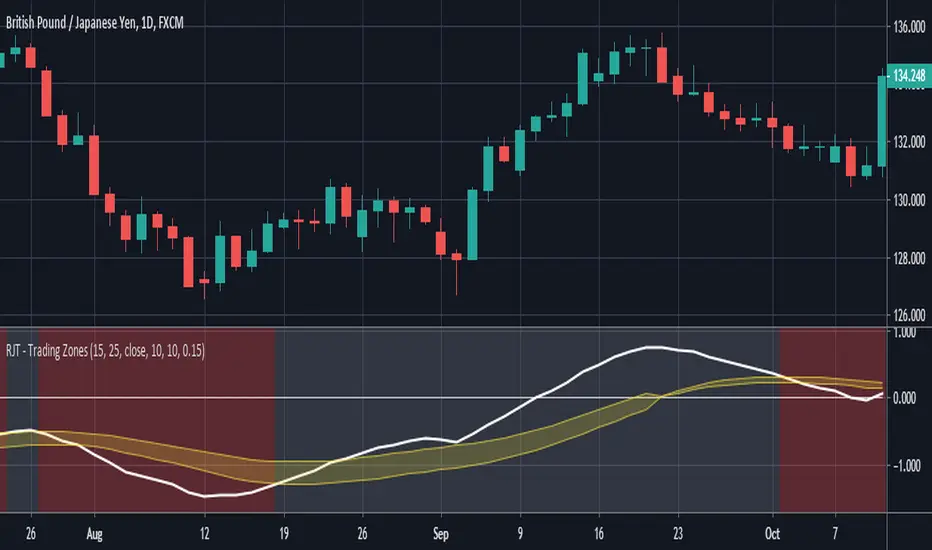
RJT - Trading ZonesThis is the Visual Indicator component of my Trading Zones System; other indicators are the Trade Visualiser and Trader Placer.
This indicator is based around a convergence and divergence of moving averages. As the signal line moves into the yellow "zone" from below a long position is opened. This position is closed and reversed when either the upper or lower boundary is crossed downwards by the signal line. This is all reversed for short trades.
The channel is created by adding a factor of previous values, from a configurable period, to an exponential moving average of the signal line.
Best used on the Daily timeframe of any Forex or Commodity market, but is successful on all timeframes.
Go Long when background turns from Red to Green.
Go Short when background changes from Green to Red.
Signal Smoothing = Length of signal period
Signal Look back period = Period of look back for highest value (when long, lowest value when short) to create channel width
Channel multiple= Multiple of highest value to be added to EMA of Signal to create zone (larger number = wider zone)
Mirror MACD by Trader JayThis is my take on the metatrader indicator, the mirror macd. Works pretty good on Forex, haven't tested on anything else
Enter long after the Blue Line Cross Up the Red Line and EXIT after the Green line Cross Up the Red Line (above the Blue Line).
For the opposite position : ENTER SELL after the Red Line Cross Down.

[SignalFI] MACD PrimeWelcome! As part of our continual process to build and enhance trusted existing indicators, we're proud to release MACD Prime to the PRIME series for those traders that rely on the popular divergence mechanics traditional MACD provides.
MACD Prime provides a default MACD structure using the popular 12,26 EMAs and a 9 lockback signal line as the core of the indicator's functionality. In this way, you will get a consistent view for what you're use to, but of course we've added additional functionality that can be used to increase the value this view provides when trading.
ADDITIONAL Functions:
1) MACD Fast and Slow EMA sources are selectable, thus allowing the user to select OHLC variants as the source input for the 12/26 trendlines.
2) Background Coloring is based on a secondary "Signal" color which be default has been set to 6. This length is configurable, and providing a leading edge to the typical "MACD Cross". Said simply, the background color will change with the trend BEFORE a default MACD cross occurs. This may provide early warning of a MACD cross, and allow for additional entry/exit signals to manifest depending on other confluence with price and trend information.
3) MACD Trend Lines. In accordance with the PRIME series MACD Prime comes bundled with Trend Line support and resistance pivots that provide additional context for how the MACD may act based on a previous and projected trend line information. By default projections are turned off, but can be enabled from within the menu options. These trendlines can be used to spot divergences as well, and can be tuned within the option to increase resolution or decrease noise provided by trend lines.
All other standard functions persist, including the typical MACD line, MACD Signal Line, and MACD Histogram.
SignalFI was created to help traders and investors to effectively analyze the market based on the Golden Mean Ratio (Fibonacci numbers), plan a trade and ultimately execute it. To help inform and educate market decisions we developed a set of Trading Indicators which are available on TradingView.
SignalFI indicators are just that, indicators. Our indicators are generally configured to use completely historical data (negating repaint), and we advise all alerts created with SignalFI indicators to be fired upon "close" of the current candle. Our indicators can provide valuable context and visualization support when performing market analysis and executing buy and sell decisions. However. we are not financial experts, and all information presented on this site or our other media outlets are for educational purposes only.

MACD Indikator v1If you make a loss, I am not responsible for it. Please use this with caution.
==================================================================================================================================================
MACD - Strategy
Considering cross the lines and Top / Buttoms.
==================================================================================================================================================
Do realize that the indicator is not 100% accurate and please use this with caution. Please read the disclaimer below before using this indicator or the services (Telegram/ Twitter , Trading View etc.) services associated with this indicator:
Disclaimer:
No Investment Advice Provided
Any opinions, chats, messages, news, research, analyses, prices, or other information contained here are provided as general information for educational and entertainment purposes only and do not constitute investment advice. My bullshit statements should not be relied upon as a substitute for an extensive independent market research before making your actual trading decisions. Opinions, market data, recommendations or any other content is subject to change at any time without notice. I will not accept liability for any loss or damage, including without limitation any loss of profit, which may arise directly or indirectly from use of or reliance on such information.
I do not recommend the use of technical analysis or any analysis as a sole means of trading decisions. I do not recommend making hurried trading decisions. I have no clue about PAST PERFORMANCE or any INDICATIVE FUTURE RESULTS.
THE script and its associated services ARE PROVIDED "AS IS", WITHOUT WARRANTY OF ANY KIND, EXPRESS OR IMPLIED, INCLUDING BUT NOT LIMITED TO THE WARRANTIES OF MERCHANTABILITY, FITNESS FOR A PARTICULAR PURPOSE AND NONINFRINGEMENT. IN NO EVENT SHALL THE AUTHORS OR COPYRIGHT HOLDERS BE LIABLE FOR ANY CLAIM, DAMAGES OR OTHER LIABILITY, WHETHER IN AN ACTION OF CONTRACT, TORT OR OTHERWISE, ARISING FROM, OUT OF OR IN CONNECTION WITH THE SOFTWARE OR THE USE OR OTHER DEALINGS IN THE SOFTWARE, WEBSITE, SCRIPT, SIGNALS.

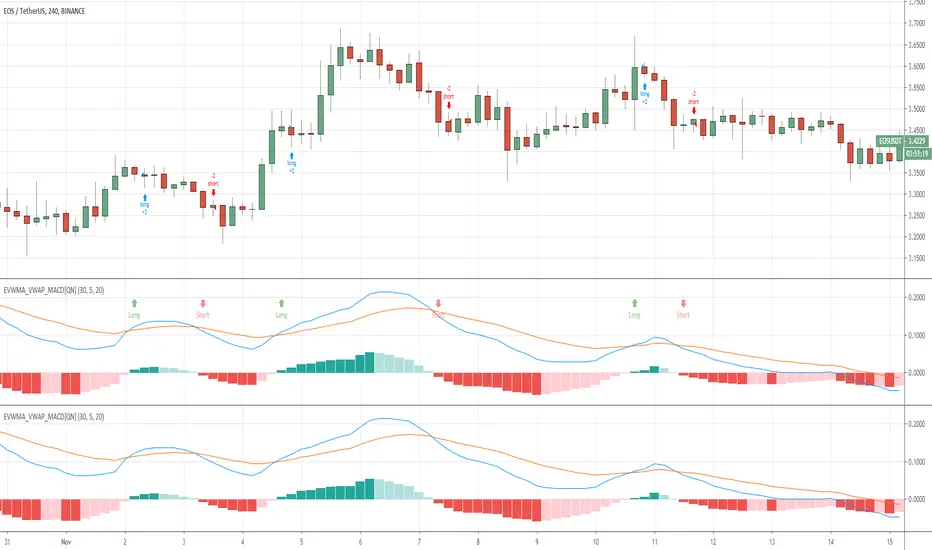
EVWMA VWAP MACD Strategy [QuantNomad]Based on comment of @coondawg71 I tried to compare VWAP and EVWMA.
Both are sort of moving averages so I decided to create a MACD based on these 2 indicators.
In parameters you can set EVWMA Length and 2 smoothing lengths for "macd" and "signal".
Strategy seems to work pretty good at 2h-8h timeframes for crypto.
What do you thing about it?

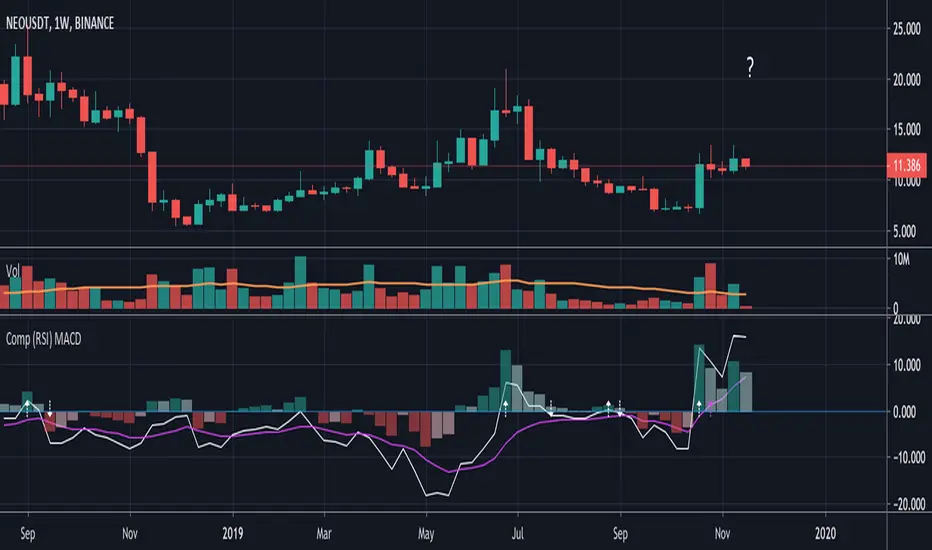
Compare (RSI) MACDHere I've created an indicator which can be used together with my "Compare (RSI) Ticker 3x" Indicator.
It makes it much easier to see the movements between the "RSI Ticker 1" and "RSI Ticker 2/3".
- The white line is the "MACD" of Ticker 1, which is the difference between the "RSI Ticker 1" and "RSI Ticker 2/3".
- The purple line is the "Signal" line, an EMA of the "MACD". (Length is adjustable)
- The "0-line" is the "RSI Ticker 2/3" line, when Ticker 2 is chosen, this will be blue coloured, when Ticker 3 is chosen it will be red.
Because 2 MACD in 1 indicator is way too messy, you only can choose the comparison against Ticker 2 OR Ticker 3.
- In "Settings" > "Inputs" you can enable/disable the second or third Ticker
(If Ticker 2 is enabled, Ticker 3 is disabled and vice versa)
- The second Ticker has multiple choices
- The third you can type any Ticker you want, for example CRYPTOCAP:BNB, BINANCE:ETHUSDT, NASDAQ_DLY:NDX or whatever,
just start typing and you'll see the possibilities (You also can choose between "Cryptocurrencies", "Index", "Forex", ...)
- When the "MACD" crosses the "0-line", arrows will appear, white ones for "MACD", purple ones for the "Signal" line.
- The "Histogram" makes it easier to see the difference between "MACD" and "Signal" line.
- The source of this indicator is adjustable
- When the second chosen Ticker is the same as the first Ticker, of course you will be seeing lines
(because there is no difference between the 2 Tickers, the EMA is visible though)
If you use both "Compare (RSI) Ticker 3x" AND "Compare (RSI) MACD", of course be aware that you have the same Ticker 2 or 3 in each indicator!

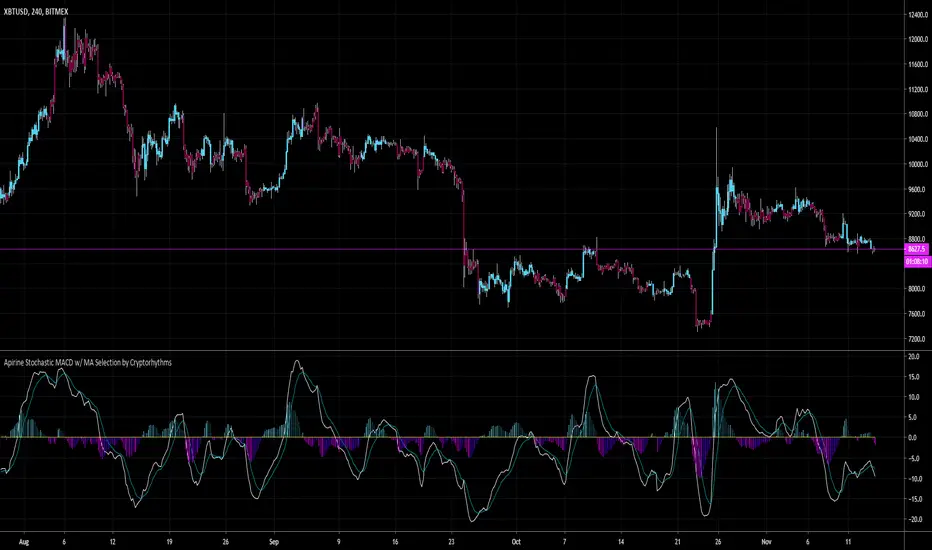
Apirine Stochastic MACD w/ MA Selection by Cryptorhythms📊 Apirine Stochastic MACD w/ MA Selection by Cryptorhythms
Intro
Had to re-release due to moderation.
This happens to be my first open source indicator, hope you all enjoy it!
Description
This indicated is ported from November 2019 issue of TASC. “The Stochastic MACD Oscillator” in this issue, author Vitali Apirine introduces a new indicator created by combining the stochastic oscillator and the MACD . He describes the new indicator as a momentum oscillator and explains that it allows the trader to define overbought and oversold levels similar to the classic stochastic but based on the MACD .
Options
-You can enable bar coloration for trade state (signal conditions setup in the "long" and "short" variables).
-You can choose histogram or columns for the convergence/divergence display.
-You can turn on/off and adjust the overbought / oversold zones.
-You can choose what type of moving average to use in the calculation from a small selection of options. This gives you more flexibility to adapt the indicator to your needs.
👍 We hope you enjoyed this indicator and find it useful! We post free crypto analysis, strategies and indicators regularly. This is our 70th script on Tradingview!
🤐Check my Signature for other information