Convergence / Divergence de la moyenne mobile (MACD)
Range Force Impulse The "Range Force Impulse" indicator combines 4 useful indicators into one, freeing up chart real-estate and giving the trader insight into trend health, bull/bear commitment, range and volatility all at a glance.
The indicator consists of the following:
Direction - True Range and Average True Range columns shown above and below 0 depending on direction of the period's price
-- TR (gray) shows the current period's trading volatility
-- ATR (Impulse colors, see below) shows an EMA of TR over a specified length
-- Can be used to determine stops and targets (Example: Stop loss at prev close - ATR, Target at 2x ATR)
Index - Alexander Elder's EMA of (change(close) * volume), shows crosses above 0 (green) and below 0 (red), and intermediate signals
-- Shows bull vs. bear interest/commitment/dominance
-- Elder recommends EMA length of 2 for daily chart buy/sell signals, and 13 for weekly chart bull/bear dominance & trend direction signals
-- Intermediate signals are shown above 0 when falling (salmon), or below 0 when rising (pale yellow)
System - Range columns are colored using Alexander Elder's censorship system (green: do not short, red: do not long, blue: is up to you)
-- Shows overall trend health (Macd histogram and EMA up/down changes)

Multi momentum indicatorScript contains couple momentum oscillators all in one pane
List of indicators:
RSI
Stochastic RSI
MACD
CCI
WaveTrend by LazyBear
MFI
Default active indicators are RSI and Stochastic RSI
Other indicators are disabled by default
RSI, StochRSI and MFI are modified to be bounded to range from 100 to -100. That's why overbought is 40 and 60 instead 70 and 80 while oversold -40 and -60 instead 30 and 20.
MACD and CCI as they are not bounded to 100 or 200 range, they are limited to 100 - -100 by default when activated (extras are simply hidden) but there is an option to show full indicator.
In settings there are couple more options like show crosses or show only histogram.
Default source for all indicators is close (except WaveTrend and MFI which use hlc3) and it could be changed but for all indicators.
There is an option for 2nd RSI which can be set for any timeframe and background calculated by Fibonacci levels.

Histogram Trends Strategy by SedkurThis gives to you buy-sell signal with MACD's histogram trends.
Use "Fast and Slow length" and "Trend of Histogram Number" inputs to take less or more signal.
"Trend of Histogram Number" : This means how many histogram bars the trend continues before trading.

MACD Strategy by SedkurThis gives to you buy-sell signal with MACD histogram value.
Use "Fast and Slow length" and "Buy or Sell Histogram Value" inputs to take less or more signal.

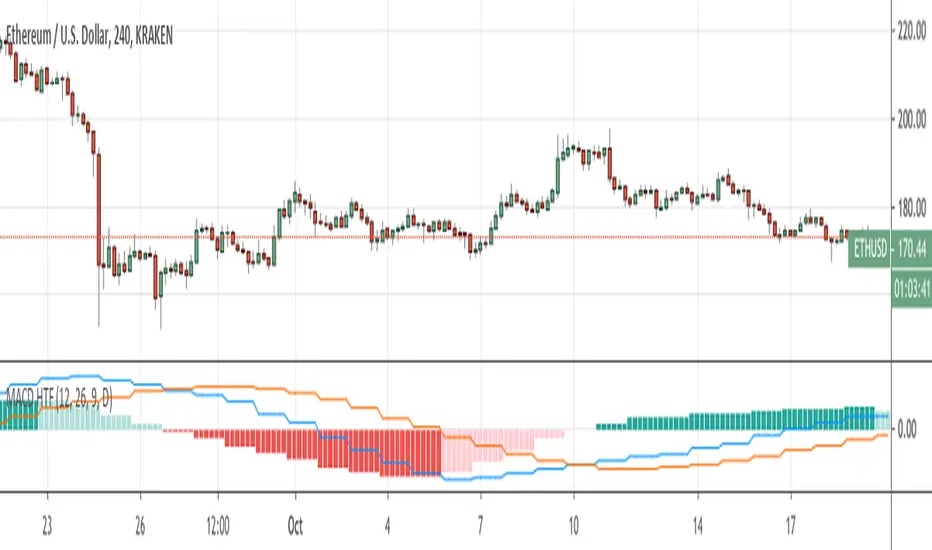
MAC-Z [ChuckBanger]Here I show the relationship between the MACD and Z-Score in a indicator called MAC-Z. MACD is short for moving average convergence/divergence and is in it self showing the relationship between two EMA. The Z-Score in contrast is related to Bollinger Bands and in MAC-Z the Z-score is the difference between the current price and a moving average divided by the standard deviation of price over the same time period.
MAC-Z has its best use in the short term time frames in my opinion compared to MACD. Here i show from current time of writing how effective it is.
More info on MAC-Z:
cssanalytics.wordpress.com
Also take a look at MACD Leader:

Derivative Oscillator Cu [ID: AC-P]The "AC-P" version of the Derivative Oscillator is my personal customized version of Constance Brown's Derivative Oscillator (using Everget's implementation of it as the base), with the the following modifications and additions:
VWAP Indication - option to show whether the price input option is above or below the Daily VWAP (red triangles = price input is below vwap, green triangles = price input is above vwap)
Bullish and Bearish phases from shayankm's Waddah Attar Explosion V2 () is included as indication dots (bullish = blue dots, bearish = yellow dots) below/above the Derivative Oscillator histogram
Coral Trend from Lazybear () is included as indication dots (red/green dots below/above the Derivative Oscillator histogram
Input source options for vwap, Waddah components (MACD, Bollinger Upper/Lower)
Centerline option for Coral trend, and Horizontal center option for the Derivative Oscillator with circle indication (optional - provided as option for flexibility in use with overlaying with other indicators)
This indicator is a hybrid, with a combination of leading indicators and lagging trending indicators combined into one. Specifically, a few of the other indicators I use are lacking in the momentum and trend department, and this is one of the indicators I use to address that:
VWAP provides trend information on lower timeframes from a high timeframe interval (D)
Coral Trend provides additional confirmation to VWAP trend wise, and is adjustable
Waddah Attar Explosion provides a third level of confirmation for trending moves, taking into account shorter and longer timeframes (FastEMA and SlowEMA parameters).
Script base for the Derivative Oscillator is credited to Everget () and LazyBear ().
Source attribution to Constance Brown for the Derivative Oscillator formula/indicator:
// Brown, Constance.
// Reference 1: “The Derivative Oscillator: a New Approach to an Old Problem,” Journal of Technical Analysis (Winter-Spring 1994) 45–61.
// Reference 2: Technical Analysis for the Trading Professional. New York, NY: McGraw-Hill, 1999.
Information on the Derivative Oscillator:
www.investopedia.com

Modified Stochastic MACD Oscillator - Vitali ApirineFor all MACD enthusiasts out there, hot off the press, I present this next generation "Modified Stochastic MACD Oscillator" employing PSv4.0, originally formulated by Vitali Apirine for TASC - November 2019 Traders Tips. Just when you may have thought it was the end of the evolutionary line for MACD technology, it's not! Basically it's a NEW hybridization of a MACD and stochastic rolled into one, maintaining scale symmetry to support overbought/oversold defined levels across time frames and assets, unlike the ordinary MACD. On the ordinary MACD, this is virtually impossible to do properly, and trust me, I have tried with zero success. My less than 40 line implementation, at initial release, is a heavily modified version of the original indicator using novel techniques, surpassing not only Apirine's original intended design, but also the "contemporary MACD" provided by TV, visible on the bottom of the chart.
Utilizing the "Power of Pine", I included the maximum amount of features I could surmise in an ultra small yet powerful package. I provided an abundance of control over each feature as an attempt to create another heavenly MACD experience in an open source package, only rivaled by my "Ultimate MACD Super Pack". Configurations are displayed above in multiple scenarios that should be suitable for most traders. Of notable mention, I rescaled the oscillator more towards a zero mean unity scale, while still leaving the waveforms completely intact.
Features List Includes:
Dark Background - Easily disabled in indicator Settings->Style for "Light" charts or with Pine commenting
AND much, much more... you have the source!
For those of you who are new to Pine Script, this script also may help you understand advanced programming techniques in Pine and how they may be utilized in a most effective manner. I would like to see Tradingview become the go to platform for the best MACD indicators attainable with this contribution to the TV community. This is commonly what my dense intricate code looks like behind the veil, and if you are wondering why there is no notes, that's because the notation is in the variable naming. If you wish to contribute additional ideas, please do so below in the comments about all things MACD in Pine.
NOTICE: Copy pasting bandits who may be having nefarious thoughts, DO NOT attempt this, because this may violate Tradingview's terms, conditions and/or house rules. "WE" are always watching the TV community vigilantly for mischievous behaviors and actions that exploit well intended authors for the purpose of unscrupulously increasing brownie points in reputation scores. Hiding behind a "protected" wall may not protect you from investigation and account penalization by TV staff. Be respectful, and don't just throw a meaningless feature in there branding it as "your" gizmo. Fair enough? Alrighty then... I firmly believe in "innovating" future state-of-the-art indicators, and please contact me if you wish to do so.
The comments section below is solely just for commenting and other remarks, ideas, compliments, etc... regarding only this indicator, not others. When available time provides itself, I will consider your inquiries, thoughts, and concepts presented below in the comments section if you do have any questions or comments regarding this indicator. When my indicators achieve more prevalent use by TV members, I may implement more ideas when they present themselves as worthy additions. As always, "Like" it if you simply just like it with a proper thumbs up, and also return to my scripts list occasionally for additional postings. Have a profitable future everyone!

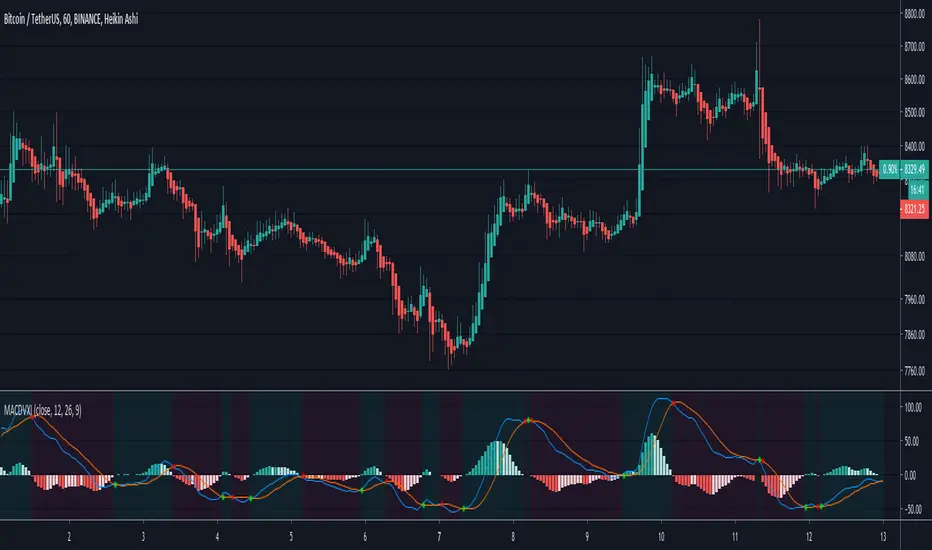
Schaff Trend Cycle [ChuckBanger]The Schaff Trend Cycle is a method, developed by Doug Schaff and based on the concept that trends also have repeating high and low patterns, or cycles. This is a modified MACD line, run through a modified stochastic algorithm and smoothed with Wilders’ smoothing in order to estimate the final Schaff Trend Cycle (STC) indicator. Its purpose is to identify the direction, in which a trend cycle is moving and possible peaks and bottoms within this cycle.
If this is interesting you should also take a look at MACD Leader:
For more info about Schaff Trend Cycle Indicator:
www.investopedia.com

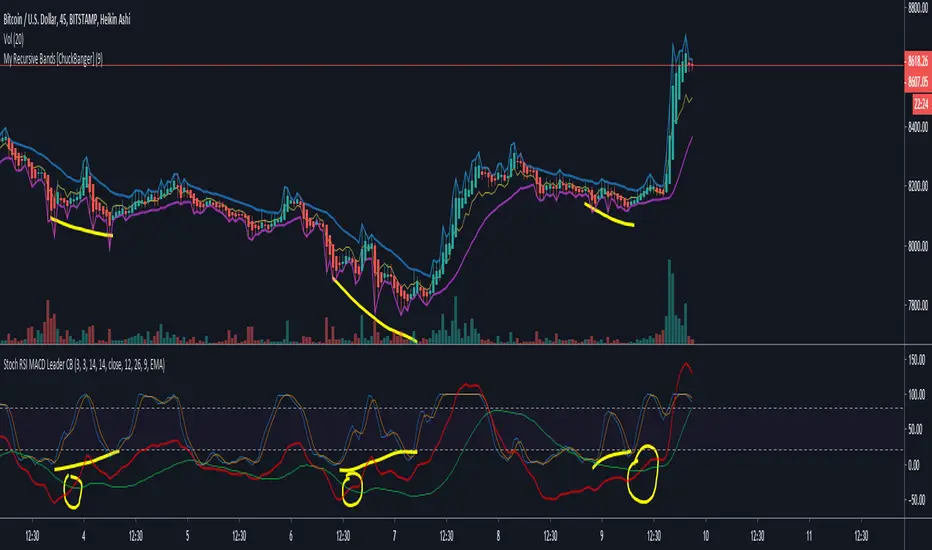
Stochastic RSI and MACD leader [ChuckBanger]Here I have combined Stochastic RSI with my MACD leader.
MACD leader and Stochastic RSI works well together and they are powerful in combination with My Recursive Bands. It is up to you to back test this properly before you use it in real life trades. But in my opinion it is very powerful.
Because of MACD nature it's a little messy when you turn on the MACD's histogram so I commented that out.
MACD Leader:
My Recursive Bands:
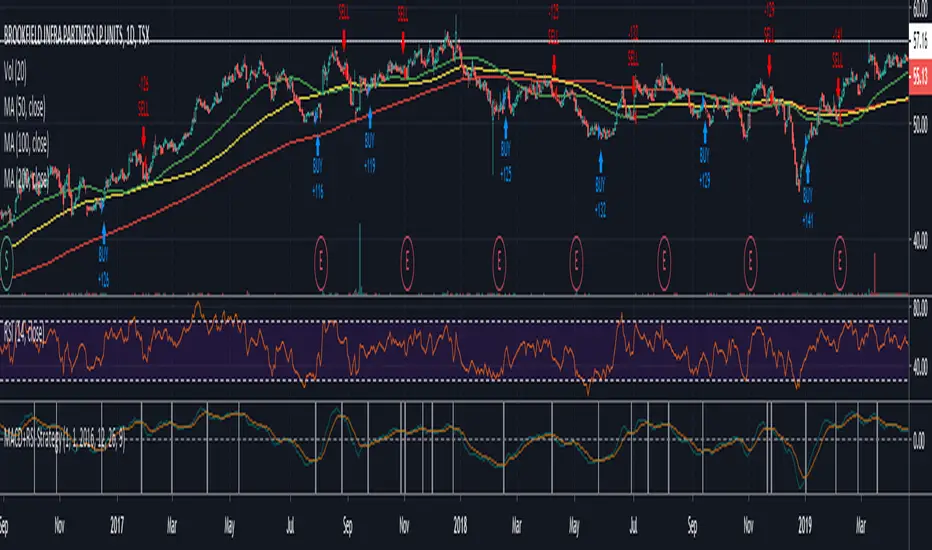
Easy to Use MACD+RSI Strategy
BEGINNERS REJOICE!
Easy to use strategy test using MACD with RSI as a confirming indicator. The code is structured to make it easy to manipulate the variables to your choosing.
EASY TO CHANGE CODE VARIABLES
LINE 2 = Change the amount you invest every trade and the currency
LINE 8/9/10 = Change the defval of each of these lines to backtest from a certain date
LINE 16/17/18 = Change the MACD sensitivity by changing the defval on each line
LINE 21 = Change the value after close toadjust the sensitivity of the RSI
LINE 37/39 = Change/remove the < and > variables for macdLine and rsivalue after the crossover/crossunder to adjust your buying point further.
As a beginner you may not feel comfortable with shorting stocks, therefore LINE 5 was added to only allows long positions.
Funny how a simple indicator can return such a high profitability. Couple this with some trend/exit strategies and you'll have something really special!
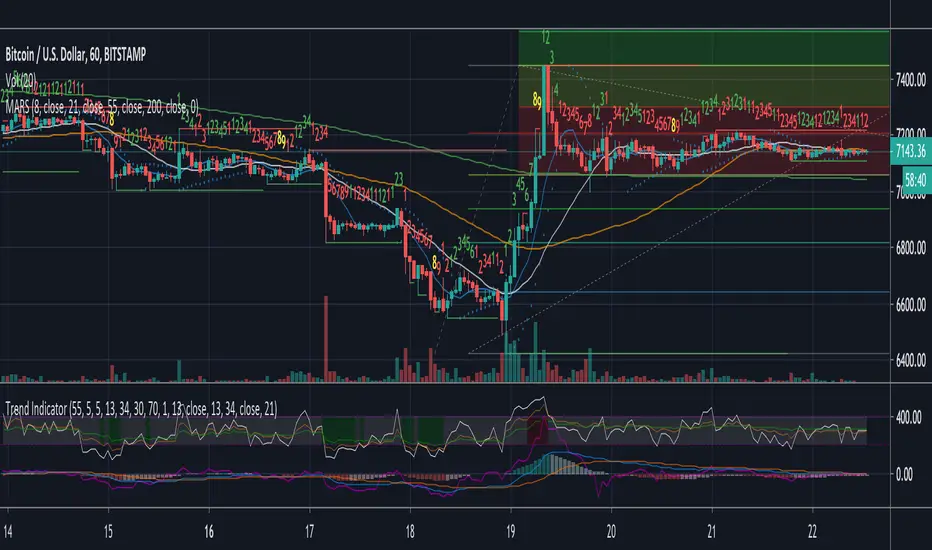
Trend Indicator
A Simple indicator combining 3 of the most popular Oscillators RSI, MacD and Momentum to help see reversals or the continuation of a trend. Designed with the COINBASE:BTCUSD chart in mind but there's not reason it shouldn't work on any other asset.
The indicator has two main parts:
- The gray area at the top between the purple dotted lines is 3 RSI's in one (5, 13, 34) These have been moved up from the RSI's original position to avoid cluttering the MacD and make the lines easier to read. Just like with the regular RSI the lower dotted line indicates oversold and the top dotted line indicates an overbought condition.
To identify this more easily the background changes to green when the middle (13 period) RSI is oversold and red when it's overbought.
*Note* On some very small timeframes the position may need to be adjusted in order to make them easier to see.
This section of the indicator is designed to give early warning signs of markets reversing by the faster white line with confirmation from the orange and green lines.
- The bottom section of the indicator has two parts. The first is a modified MacD which is slightly longer term than the original. This is to act as confirmation or entry/take profit points on divergence or if either of the lines within the MacD crossover or the histogram goes from one color to the other. The histogram is also helpful for trend-following as it lets you gauge if the momentum is gaining or losing strength.
The last part of the indicator is simply a momentum line to indicate in which direction the momentum is heading. It's designed as a confirmation of the other indicators and shouldn't be used on it's own.
All individual indicators that make up the trend indicator have been tweaked slightly to use numbers from the fibonacci sequence rather than the originals.
This indicator is best used in combination with volume and moving averages.
- Look for reversals on low volume near a moving average or key historical point.
- Look for breakouts on high volume if the oscillators line up.
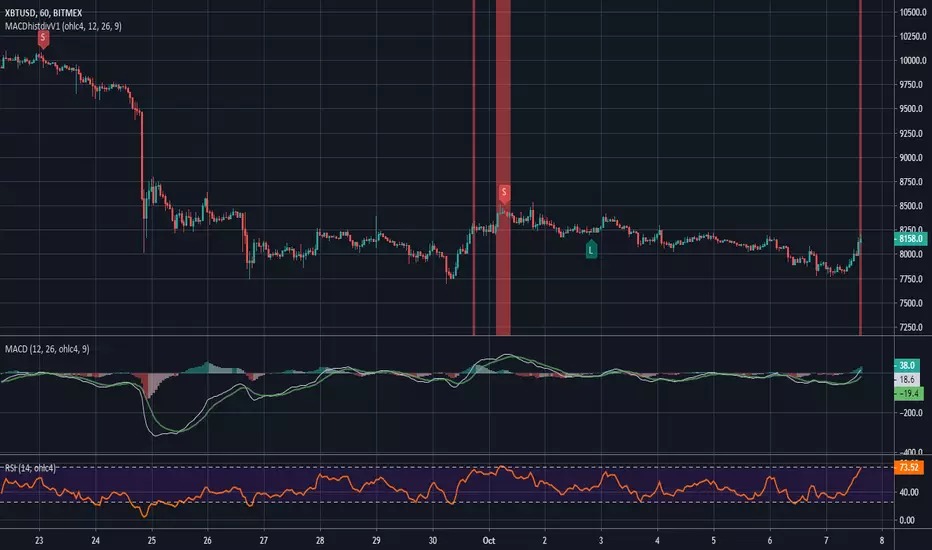
MACD and RSI divergence by Rexio v2Hi everyone!
I wrote this indicator for intraday trading and it cannot be use only by itself you need to at least draw some S/R lines to make it useful. It is based at MACD histogram and gives signal when it sees divergence on MACD/RSI/MACD's Histogram (or all at once - settings) when macd's histogram switchs trend. Im using it to playing with a trend most of the time looking for hidden divergence at higher time frame and after that looking for regular divergence at lower time frame.
Im not a computer programist nor professional trader so it is only for educational purposes only.

MACD histogram divergence by Rexio v1Hi everyone!
I wrote this indicator for intraday trading and it cannot be use only by itself you need to at least draw some S/R lines to make it useful. It is based at MACD histogram and gives signal when it sees divergence on MACD's Histogram when macd's histogram switchs trend. Im using it to playing with a trend most of the time looking. It highlights candles which can give good singnals to play with a trend (its based on ema200 and RSI overbought and oversold zones).
Im not a computer programist nor professional trader so it is only for educational purposes only.
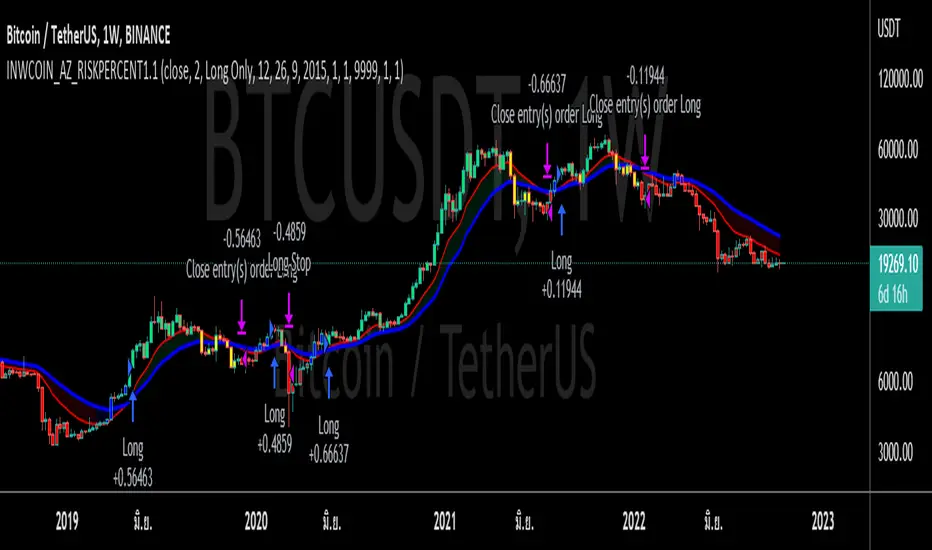
inwCoin ActionZone Risk% Strategy=========================
English
=========================
CDC Action Zone strategy with improved exit logic
Buy = Candle turn from blue to green
Sell = Price close below EMA 18
* Action Zone is just way to put MACD on chart for easily read
Original entry/exit logic is
Green = Buy
Red = Sell
Working great for BTC TF Daily.
==========================
Thai
==========================
"เทรดไรบ่อยๆ ปีนึงเทรดครั้งสองครั้งก็พอแล้ว -- มาเทรดเอาตัง ไม่ได้เอาเท่"
คำพูดสุดคลาสสิคของคุณลุงโฉลก ซึ่งเมื่อท่านเทรดไปบ่อยๆ ก็พบว่า ... เออ จริงของแก
เทรดไรบ่อยวะ นั่งทับมือ กันเฉยๆ น่ะเป็นไหม
ตัวนี้ผมเอา Action Zone เดิม มาปรับปรุง ให้เราสามารถเลือก Risk % ได้ จากเดิมที่เป็นการเข้าแบบทั้งก้อน ตอนนี้ก็ให้เข้าแบบ vary ได้แทน