[RenkoCore] PublicWhen it comes the Renko chart, we all know it has its advantages & disadvantages compared to the candle-stick chart. My aim of this was to alleviate some of the disadvantages by providing some sort of structure on Renko chart. These set of tools may hopefully help your trading journey on Renko chart.
Helpful tips:
a) Enable wicks on your Renko settings, this indicator needs wicks to work.
b) Choose correct size (I recommend traditional size option) for your Renko chart as well as for your instrument.
c) Keep it on 1-second time frame, anything other than that doesn't work on TradingView's Renko. This is important as price will not repaint.
d) If you want to see bigger picture (like 4hr/daily on candle-stick chart), just increase your Renko size, but still keep it on 1-second timeframe.
This toolset includes couple different methods to provide some structures as explained below:
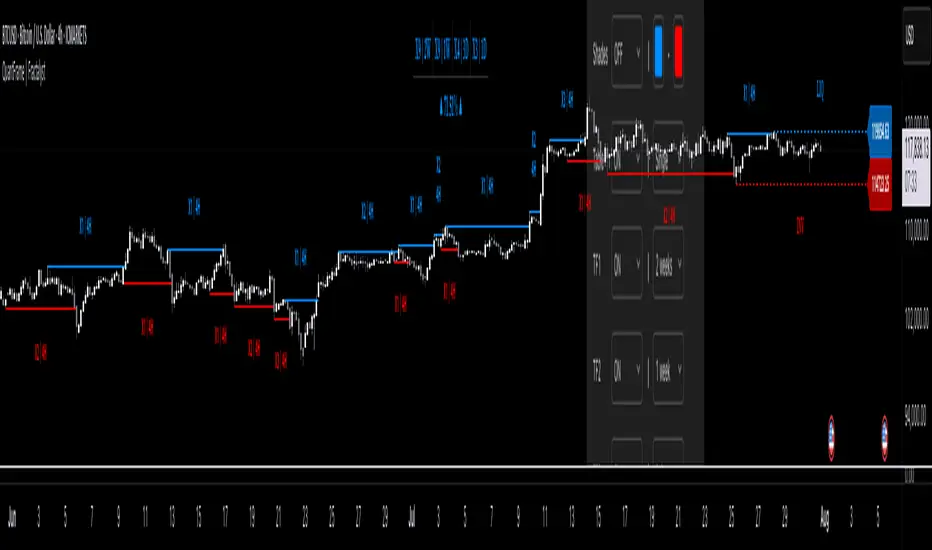
1. 📌 Balance | Price Action Equilibrium Zones
Overview
The Balance is a visual framework designed to evaluate directional bias and internal structure in price action. It measures net bullish/bearish momentum within a configurable rolling window, while highlighting key structural turning points based on multiple custom sensitivity levels. This tool helps traders stay in sync with market rhythm by emphasizing balance, imbalance, and inflection zones.
🔧 How It Works:
Inflection Tiers
Three customizable rounds of pivot-based divergence detection—labeled as 1°, 2°, and 3°—automatically identify regular bullish and regular bearish pivot structures. Though may not be always accurate, these structural signals are intended to keep user's focus to continually reflect emerging internal market shifts.
Balance Limit
Monitors directional bar disparity within a customizable retrospective span. When the net balance exceeds ±50% of the range, the line turns green to suggest strong directional bias. A red fill zone between these thresholds indicates equilibrium or no-trade conditions.
Volatility Based Reversal (Candle Reversal Detector)
This tool scans for extreme price movements relative to local volatility baselines, helping traders detect possible tops and bottoms before major price reversals or pauses. Compares current price action to the lowest recent volatility anchor or if price sharply dips below the highest recent volatility anchor.
🧠 Use Case Recommendations:
Discretionary trading to visually confirm balance and momentum shifts.
Confluence strategies, combining the balance counter with trend indicators or support/resistance levels.
Structure mapping, to highlight exhaustion zones or emerging reversals based on internal divergences.
Avoid using this tool in isolation. It is most effective when combined with broader market context or other confirmation layers.
2. 📌 Primary Level Detection
Overview
This is a precision tool for detecting dynamic price zones where significant market reversals may begin. Using a blend of momentum, price tension, and volatility structure, it identifies potential top and bottom areas — and tracks them with adaptive channel levels that evolve in real time.
🔧 How It Works:
Combines price action, RSI-based bias, and volatility deviation to identify moments when price is overextended.
Reacts only to major changes — reducing false positives in choppy markets.
Levels persist on the chart until a new valid reversal is confirmed, giving you visual structure and actionable areas to work with.
🧠 Use Case Recommendations:
Trading reversals, reversion-to-mean, or liquidity sweeps
Confirming entries from other indicators (like divergence, order blocks, or support/resistance)
Analyzing volatile markets where rapid direction changes are common (e.g., crypto, futures, scalping)
3. 📌 Secondary Level Detection
Overview
This tool highlights where price may be overextended and due for a short-term reversal, based on recent price structure.
🔧 How It Works:
It uses dynamic bar-count and swing conditions to identify potential price turning points after extended directional moves or strong sequence of bars in same direction.
Levels persist on the chart until a new valid reversal is confirmed, giving you visual structure and actionable areas to work with.
🧠 Use Case Recommendations:
Trading reversals, reversion-to-mean, or liquidity sweeps
Confirming entries from other indicators (like divergence, order blocks, or support/resistance)
⚠️ Important Notes:
This indicator does not repaint. All pivots and plots are based on closed candles and verified conditions.
This tool does not provide trade signals. It is a structural analysis tool intended to assist in discretionary decision-making. This indicator is for informational and educational purposes only. Use in combination with your own trading strategy, risk management, and market context. The signals generated do not guarantee outcomes and should not be used in isolation.
It is not intended to be financial advice or a recommendation to buy or sell any security or asset. Trading involves risk. Always do your own research and consult with a licensed financial advisor before making any trading decisions. Past performance is not indicative of future results.
The author is not responsible for any losses incurred from the use of this script.
Marketstructure

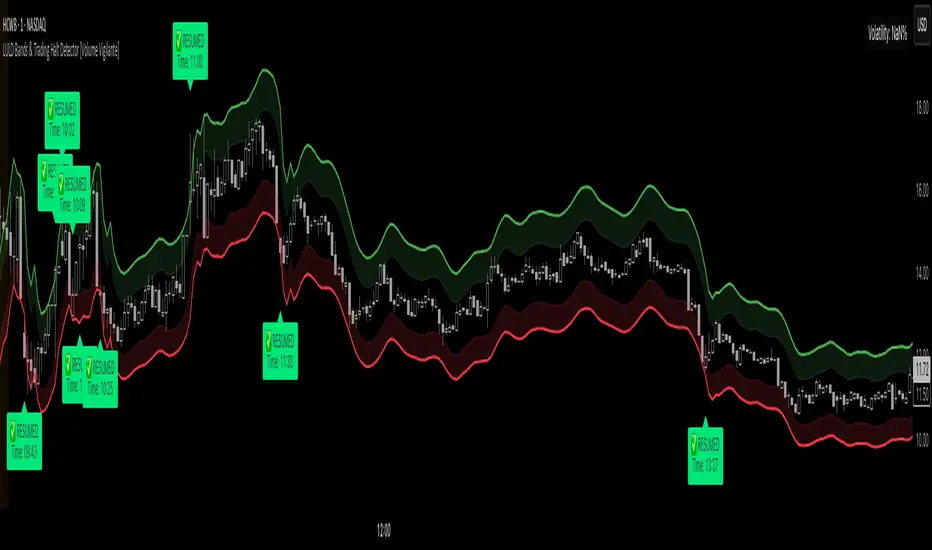
LULD Bands & Trading Halt Detector [Volume Vigilante]📖 LULD Bands & Trading Halt Detector
This advanced tool visualizes official Limit Up / Limit Down (LULD) price bands and detects regulatory trading halts and resumptions based on SEC and NASDAQ rules. It is engineered for high accuracy by anchoring all calculations to the 1-minute timeframe, ensuring reliable signals across any chart resolution.
📌 What Does This Script Do?
- Draws real-time LULD price band estimations and optional buffer (caution) zones directly on the chart.
- Detects trading halt resumptions by monitoring time gaps between candles and other regulatory criteria. (Note: Due to Pine Script limitations, halts cannot be detected in real-time, only resumptions after they occur.)
- Triggers real-time alerts for:
- Trading Resumptions (Limit Up & Limit Down)
- LULD Zone Entries (Caution Zone)
- Band Breaches (Limit Up and Limit Down)
- Plots historical halt resumption markers to analyse past events.
📐 How It Works:
- Implements official SEC/NASDAQ LULD rules for Tier 1 and Tier 2 securities.
- Applies special band adjustments for the final 25 minutes of trading (after 3:35 PM ET).
- Anchors all logic to the 1-minute timeframe for precise calculations, even on higher timeframe charts.
- Includes adjustable volume and volatility filters to eliminate false signals (ghost halts) on low-- liquidity assets, especially Tier 2 securities when TradingView fails to print candles.
⚙️ How to Use It:
1.) Apply the script to any asset or timeframe.
2.) Adjust Volume and Volatility Filters to reduce noise. (Recommended: 500,000+ volume, 10%+ volatility.)
3.) Enable or disable visual components like bands, buffer zones, and halt resumption labels.
4.) Configure alerts directly from the script settings panel.
5.) Apply alerts to individual assets via "Add Alert On..." or to entire watchlists using "Add Alert on the List."
🧩 What Makes This Script Unique?
- True 1-Minute Anchored Calculations: Ensures alerts and visuals match official trading halt criteria regardless of chart timeframe.
- Customisable Buffered Zones: Visualise proximity to regulatory price limits and avoid volatility traps.
- Combines halt resumption detection, limit up/down band visualisation, and real-time alerts into one clean, modular tool.
📚 Disclaimer:
This script is for educational purposes only and does not constitute financial advice. Use at your own discretion and consult a licensed financial advisor before making trading decisions based on it.
Official Resources:
- NASDAQ LULD Regulations (FAQ):
www.nasdaqtrader.com
Current Nasdaq Trading Halts:
www.nasdaqtrader.com
Entropy Chart Analysis [PhenLabs]📊 Entropy Chart analysis -
Version: PineScript™ v6
📌 Description
The Entropy Chart indicator analysis applies Approximate Entropy (ApEn) to identify zones of potential support and resistance on your price chart. It is designed to locate changes in the market’s predictability, with a focus on zones near significant psychological price levels (e.g., multiples of 50). By quantifying entropy, the indicator aims to identify zones where price action might stabilize (potential support) or become randomized (potential resistance).
This tool automates the visualization of these key areas for traders, which may have the effect of revealing reversal levels or consolidation zones that would be hard to discern through traditional means. It also filters the signals by proximity to key levels in an attempt to reduce noise and highlight higher-probability setups. These dynamic zones adapt to changing market conditions by stretching, merging, and expiring based on user-inputted rules.
🚀 Points of Innovation
Combines Approximate Entropy (ApEn) calculation with price action near significant levels.
Filters zone signals based on proximity (in ticks) to predefined significant price levels (multiples of 50).
Dynamically merges overlapping or nearby zones to consolidate signals and reduce chart clutter.
Uses ApEn crossovers relative to its moving average as the core trigger mechanism.
Provides distinct visual coloring for bullish, bearish, and merged (mixed-signal) zones.
Offers comprehensive customization for entropy calculation, zone sensitivity, level filtering, and visual appearance.
🔧 Core Components
Approximate Entropy (ApEn) Calculation : Measures the regularity or randomness of price fluctuations over a specified window. Low ApEn suggests predictability, while high ApEn suggests randomness.
Zone Trigger Logic : Creates potential support zones when ApEn crosses below its average (indicating increasing predictability) and potential resistance zones when it crosses above (indicating increasing randomness).
Significant Level Filter : Validates zone triggers only if they occur within a user-defined tick distance from significant price levels (multiples of 50).
Dynamic Zone Management : Automatically creates, extends, merges nearby zones based on tick distance, and removes the oldest zones to maintain a maximum limit.
Zone Visualization : Draws and updates colored boxes on the chart to represent active support, resistance, or mixed zones.
🔥 Key Features
Entropy-Based S/R Detection : Uses ApEn to identify potential support (low entropy) and resistance (high entropy) areas.
Significant Level Filtering : Enhances signal quality by focusing on entropy changes near key psychological price points.
Automatic Zone Drawing & Merging : Visualizes zones dynamically, merging close signals for clearer interpretation.
Highly Customizable : Allows traders to adjust parameters for ApEn calculation, zone detection thresholds, level filter sensitivity, merging distance, and visual styles.
Integrated Alerts : Provides built-in alert conditions for the formation of new bullish or bearish zones near significant levels.
Clear Visual Output : Uses distinct, customizable colors for buy (support), sell (resistance), and mixed (merged) zones.
🎨 Visualization
Buy Zones : Represented by greenish boxes (default: #26a69a), indicating potential support areas formed during low entropy periods near significant levels.
Sell Zones : Represented by reddish boxes (default: #ef5350), indicating potential resistance areas formed during high entropy periods near significant levels.
Mixed Zones : Represented by bluish/purple boxes (default: #8894ff), formed when a buy zone and a sell zone merge, indicating areas of potential consolidation or conflict.
Dynamic Extension : Active zones are automatically extended to the right with each new bar.
📖 Usage Guidelines
Calculation Parameters
Window Length
Default: 15
Range: 10-100
Description: Lookback period for ApEn calculation. Shorter lengths are more responsive; longer lengths are smoother.
Embedding Dimension (m)
Default: 2
Range: 1-6
Description: Length of patterns compared in ApEn calculation. Higher values detect more complex patterns but require more data.
Tolerance (r)
Default: 0.5
Range: 0.1-1.0 (step 0.1)
Description: Sensitivity factor for pattern matching (as a multiple of standard deviation). Lower values require closer matches (more sensitive).
Zone Settings
Zone Lookback
Default: 5
Range: 5-50
Description: Lookback period for the moving average of ApEn used in threshold calculations.
Zone Threshold
Default: 0.5
Range: 0.5-3.0
Description: Multiplier for the ApEn average to set crossover trigger levels. Higher values require larger ApEn deviations to create zones.
Maximum Zones
Default: 5
Range: 1-10
Description: Maximum number of active zones displayed. The oldest zones are removed first when the limit is reached.
Zone Merge Distance (Ticks)
Default: 5
Range: 1-50
Description: Maximum distance in ticks for two separate zones to be merged into one.
Level Filter Settings
Tick Size
Default: 0.25
Description: The minimum price increment for the asset. Must be set correctly for the specific instrument to ensure accurate level filtering.
Max Ticks Distance from Levels
Default: 40
Description: Maximum allowed distance (in ticks) from a significant level (multiple of 50) for a zone trigger to be valid.
Visual Settings
Buy Zone Color : Default: color.new(#26a69a, 83). Sets the fill color for support zones.
Sell Zone Color : Default: color.new(#ef5350, 83). Sets the fill color for resistance zones.
Mixed Zone Color : Default: color.new(#8894ff, 83). Sets the fill color for merged zones.
Buy Border Color : Default: #26a69a. Sets the border color for support zones.
Sell Border Color : Default: #ef5350. Sets the border color for resistance zones.
Mixed Border Color : Default: color.new(#a288ff, 50). Sets the border color for mixed zones.
Border Width : Default: 1, Range: 1-3. Sets the thickness of zone borders.
✅ Best Use Cases
Identifying potential support/resistance near significant psychological price levels (e.g., $50, $100 increments).
Detecting potential market turning points or consolidation zones based on shifts in price predictability.
Filtering entries or exits by confirming signals occurring near significant levels identified by the indicator.
Adding context to other technical analysis approaches by highlighting entropy-derived zones.
⚠️ Limitations
Parameter Dependency : Indicator performance is sensitive to parameter settings ( Window Length , Tolerance , Zone Threshold , Max Ticks Distance ), which may need optimization for different assets and timeframes.
Volatility Sensitivity : High market volatility or erratic price action can affect ApEn calculations and potentially lead to less reliable zone signals.
Fixed Level Filter : The significant level filter is based on multiples of 50. While common, this may not capture all relevant levels for every asset or market condition. Accurate Tick Size input is essential.
Not Standalone : Should be used in conjunction with other analysis methods (price action, volume, other indicators) for confirmation, not as a sole basis for trading decisions.
💡 What Makes This Unique
Entropy + Level Context : Uniquely combines ApEn analysis with a specific filter for proximity to significant price levels (multiples of 50), adding locational context to entropy signals.
Intelligent Zone Merging : Automatically consolidates nearby buy/sell zones based on tick distance, simplifying visual analysis and highlighting stronger confluence areas.
Targeted Signal Generation : Focuses alerts and zone creation on specific market conditions (entropy shifts near key levels).
🔬 How It Works
Calculate Entropy : The script computes the Approximate Entropy (ApEn) of the closing prices over the defined Window Length to quantify price predictability.
Check Triggers : It monitors ApEn relative to its moving average. A crossunder below a calculated threshold (avg_apen / zone_threshold) indicates potential support; a crossover above (avg_apen * zone_threshold) indicates potential resistance.
Filter by Level : A potential zone trigger is confirmed only if the low (for support) or high (for resistance) of the trigger bar is within the Max Ticks Distance of a significant price level (multiple of 50).
Manage & Draw Zones : If a trigger is confirmed, a new zone box is created. The script checks for overlaps with existing zones within the Zone Merge Distance and merges them if necessary. Zones are extended forward, and the oldest are removed to respect the Maximum Zones limit. Active zones are drawn and updated on the chart.
💡 Note:
Crucially, set the Tick Size parameter correctly for your specific trading instrument in the “Level Filter Settings”. Incorrect Tick Size will make the significant level filter inaccurate.
Experiment with parameters, especially Window Length , Tolerance (r) , Zone Threshold , and Max Ticks Distance , to tailor the indicator’s sensitivity to your preferred asset and timeframe.
Always use this indicator as part of a comprehensive trading plan, incorporating risk management and seeking confirmation from other analysis techniques.

Smarter Money Concepts - MTF IFVGs [PhenLabs]📊 Smarter Money Concepts - MTF IFVG
Version: PineScript™ v6
📌 Description
This multi-timeframe indicator identifies Inverse Fair Value Gaps (IFVGs) and their inversions across simultaneous chart intervals, helping traders spot liquidity voids and potential reversal zones. By analyzing price action through the lens of institutional order flow patterns, it solves the problem of manual gap tracking across timeframes while incorporating volatility-adjusted parameters and psychological level analysis for higher-probability setups.
🚀 Points of Innovation
• Multi-Timeframe Engine - Simultaneous analysis of 3 higher timeframes
• Adaptive Parameters - Auto-adjusts to market volatility conditions
• Quality Scoring System - Ranks gaps using RVI strength and size metrics
• Inversion Tracking - Monitors failed gaps for counter-trend signals
• Render Optimization - Prevents chart clutter with smart gap management
🔧 Core Components
FVG Detection Logic: Identifies gaps using customizable price source (Close/Wick)
Inversion Tracker: Manages failed gaps and generates counter signals
Multi-Timeframe Engine: Processes 3 independent higher timeframe analyses
Dashboard System: Real-time display of active gaps across all timeframes
🔥 Key Features
• Volatility-adjusted gap size filters (ATR-based)
• Customizable timeframe confluence analysis
• Color-coded quality scoring
• Non-repainting inversion signals
• Mobile-optimized visual rendering
🎨 Visualization
• Colored Boxes: Translucent zones show active gaps (green/bullish, red/bearish)
• Midline Plot: Dashed gray line marks gap midpoint for price targets
• Inversion Markers: Intense colors show failed gaps (dark red/bullish failure, bright green/bearish failure)
• HTF Differentiation: Higher timeframe gaps shown in blue/teal hues
📖 Usage Guidelines
Multi-Timeframe Settings
• Higher Timeframe 1
Default: 30 | Range: Any > Chart TF | Controls primary confluence timeframe
• Show All Timeframes
Default: True | Toggles multi-TF gap displays
Gap Settings
• Source
Default: Close | Options: | Determines gap measurement method
• RVI Period
Default: 14 | Range: 1-50 | Sets momentum confirmation sensitivity
• RVI Value
Default 0.1 | 0 to see all IFVGs | Increase min RVI to see the most powerful IFVGs
✅ Best Use Cases
• Identifying confluence across timeframes
• Spotting institutional order blocks
• High-probability reversal trading
• Trend continuation confirmation
• Volatility breakout setups
⚠️ Limitations
• Repaints historical gap zones
• Requires understanding of FVG concepts
• Higher timeframe data latency
• Quality scores rely on RVI/ATR settings
💡 What Makes This Unique
First FVG indicator with true multi-timeframe processing
Adaptive parameters that auto-adjust to volatility
Quantifiable quality scoring system
Professional-grade dashboard with HTF tracking
🔬 How It Works
Gap Detection: Identifies FVGs using price relationships and RVI confirmation
Inversion Tracking: Monitors price breaches to flag failed gaps
Quality Assessment: Scores gaps based on size, momentum, and location
Adaptive Filtering: Adjusts parameters using ATR-based volatility analysis
Multi-TF Synthesis: Correlates gaps across user-selected timeframes
Visual Rendering: Displays only relevant, active gaps to prevent clutter
💡 Note:
Start with default settings and gradually adjust parameters after observing market interactions. Focus on gaps with quality scores above 7 that align with higher timeframe trends. Combine with price action at psychological levels for highest-probability setups. Remember that higher timeframe gaps generally carry more significance than current chart gaps.

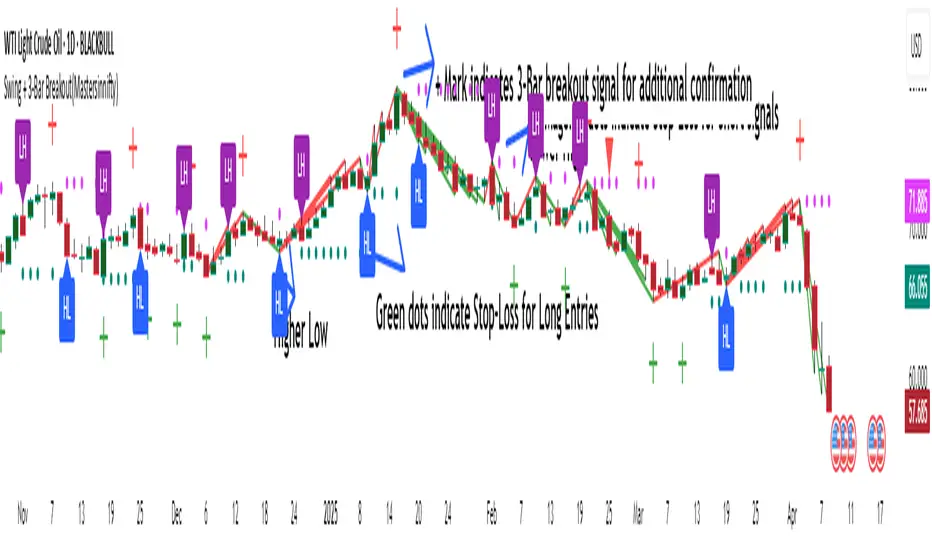
Swing + 3-Bar Breakout(Mastersinnifty)Overview
This script is a hybrid trading tool combining swing-based structural analysis, momentum filtering, and breakout validation — designed to detect early reversals and confirm trend continuations within a single unified system.
It integrates five major components:
- ZigZag Structural Detection — to identify critical swing highs and lows.
- Momentum Validation — using RSI and Rate of Change (ROC) to confirm the strength behind swings.
- Three-Bar Breakout Confirmation — spotting trend continuation beyond swing structures.
- Dynamic Trailing Stop System — managing trades adaptively via ATR-based trailing stops.
- Projected Target Levels — estimating future price destinations based on measured swings.
---
What Makes This Script Unique
Rather than using standard indicators in isolation, this script layers multiple conditions sequentially and contextually:
- Structural Foundation: Identifies pivots through a tight ZigZag algorithm tuned with a low-depth setting for early detection.
- Momentum Checkpoint: Validates pivots only if RSI extremes and ROC momentum surges align, reducing false breakouts during sideways movements.
- Breakout Validation: Confirms trend continuation when price breaches critical multi-bar highs/lows post-swing formation.
- Risk-Managed Progression: Initiates adaptive ATR-based trailing stops immediately after signal generation, tightening risk dynamically as trends unfold.
- Target Projection: Estimates potential move size by projecting the magnitude of the last completed swing, offering realistic price milestones.
This combination provides a dual-purpose tool for both reversals and breakouts, allowing flexible trading styles within a single indicator.
---
How the Script Works
- Swing Detection
- A swing low is identified when a price bottom forms (via ZigZag) and momentum conditions are met (RSI < 20, ROC > +0.5).
- A swing high is identified when a price top forms and momentum conditions are met (RSI > 80, ROC < -0.5).
- Breakout Confirmation
- After a swing is detected, if price crosses above/below a three-bar swing structure, a secondary breakout signal is triggered.
- Trailing Stop Activation:
- Upon a confirmed swing or breakout, an ATR-multiplied trailing stop is initialized below/above the entry point to secure profits dynamically.
- Projection Logic
- Swing height is measured from the latest high-low sequence, and potential future targets are plotted for visual guidance.
---
Who Can Benefit From This Indicator
- Swing Traders — who seek early entries around reversal zones.
- Scalpers & Intraday Traders — needing fast-reacting momentum-based confirmation.
- Breakout Traders — to time entries after multi-bar compressions.
- Risk Managers — through integrated ATR trailing stops for dynamic exit management.
- Price Action Analysts — utilizing projected swing targets for strategic planning.
---
How to Use
- Entry Identification
- Look for buy signals at swing lows with strong positive momentum.
- Look for sell signals at swing highs with strong negative momentum.
- Use breakout confirmations to validate the trend continuation beyond swings.
- Risk Management
- Monitor trailing stop lines to track trade health.
- Watch projected targets to anticipate realistic move completions.
- Chart Visibility
- All plotted points, breakout markers, trailing stops, and projected levels are generated automatically for clarity.
---
Disclaimer
This script is intended for educational and analytical purposes only.
It does not constitute financial advice, and past performance does not guarantee future results.
All trading involves risk. Users are responsible for their own trading decisions.
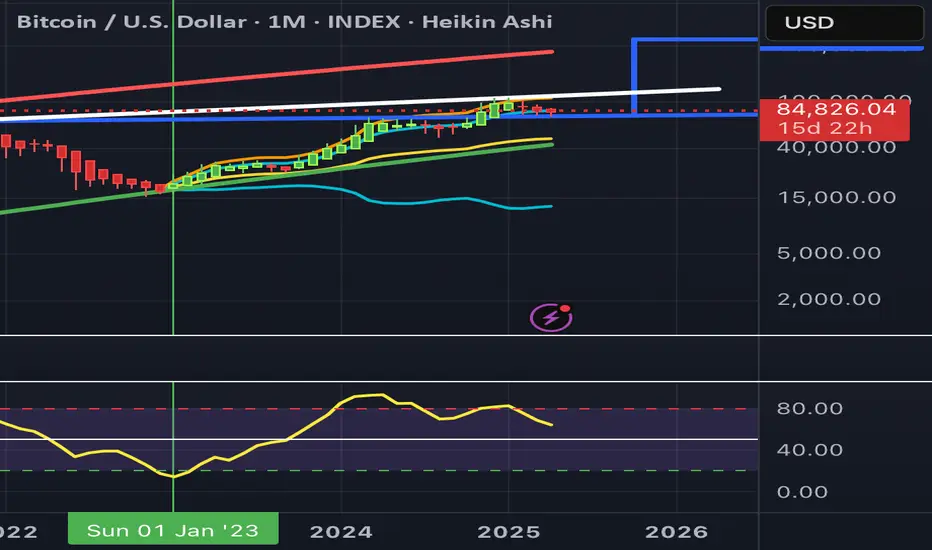
Anchored VWAP Pro (Final Visibility Enhanced)This is a fully customizable Anchored VWAP (Volume Weighted Average Price) indicator designed for traders who prioritize precision, clarity, and macro trend analysis.
Unlike traditional VWAPs tied to daily or session data, this version allows you to manually anchor the VWAP to any candle in history—ideal for macro swing trading, cycle lows, breakouts, and reaccumulation phases.
Features:
• Manual Anchor Date: Set the exact year, month, and day for your VWAP to begin
• Custom Price Source: Choose between HLC3, close, or any OHLC-based input
• VWAP Bands: Two standard deviation bands for identifying overextension or fair value zones
• Full Visual Control:
• Toggle each band on/off individually
• Adjust color, line width, and line style (solid, dotted, dashed)
• Built for Clarity: Designed to stand out on both light and dark charts
This script is ideal for:
• Identifying macro confluence zones
• Defining risk during trend pullbacks
• Confirming breakout legitimacy
• Layering with other tools like Market Cipher, VRVP, and Fib levels
Inspired by the work of LonesomeTheBlue, Algokid, and other pros—this is a cleaner, more flexible and updated alternative for precision trading.
Script created and published by @ImmortalEmerson
For advanced swing traders, crypto analysts, and macro trend specialists.
Swing Structure + Session Sweeps“Scalper-Friendly Trend & Sweep Detector”
Swing Structure + Session Sweeps with TEMA Cloud
This powerful all-in-one tool is designed for intraday traders, swing traders, and scalpers who want to spot high-probability reversals, trend continuations, and liquidity sweeps with confluence.
🔹 Core Features
Multi-layered TEMA Cloud (9, 20, 34, 50) for clear trend structure
Dynamic Bull/Bear labels when the trend flips
Centerline for TEMA 20 to visualize core trend direction
Session-based liquidity sweep detection (Asia, London, NY)
Volume and absorption dots to catch hidden pressure
Swing high/low detection (external and internal)
Visual VWAP, daily highs/lows, and customizable session zones
Optional alerts for volume spikes, absorption, and reversal sweeps
📈 Use it to:
Confirm directional bias
Anticipate pullbacks and breakouts
Identify volume-backed reversals
Align trades with session strength and swing confluence
⚙️ Built for scalpers, intraday opportunists, and precision chartists alike.

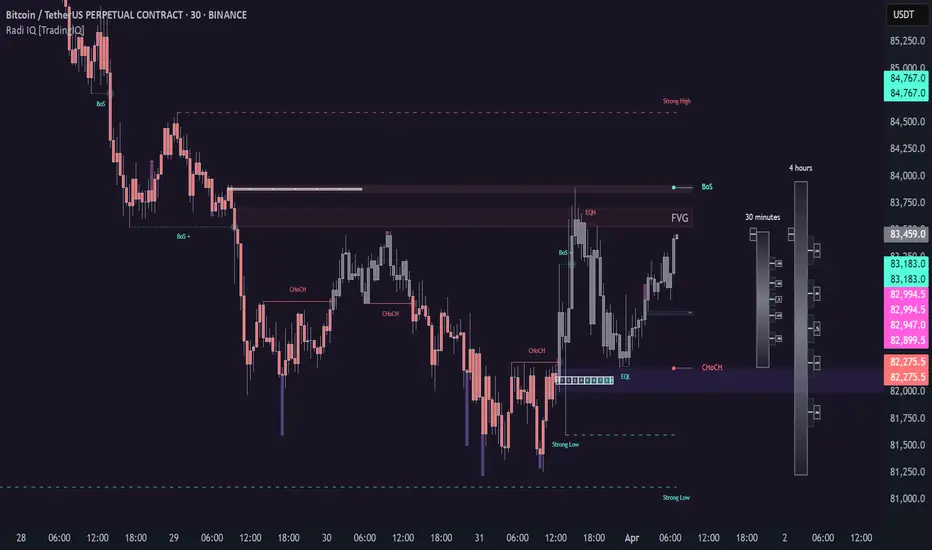
Radi IQ [TradingIQ]Introducing "Radi IQ".
Radi IQ is a comprehensive market structure indicator designed to provide traders with a detailed view of key price levels and market behavior. It combines several analytical methods—including internal and external structure analysis, fair value gaps, order blocks, breaker blocks, rejection blocks, premium discount zones, equal levels, directional liquidity grabs, and trend meters —to help users better understand areas of support and resistance, potential turning points, and liquidity events in the market.
Key Components and Their Functions
Market Structure Analysis
Internal and External Structure : The indicator evaluates market structure on two levels. The internal analysis focuses on immediate price action (e.g., recent support/resistance and swing points), while the external analysis uses a higher timeframe to provide context. This dual approach helps to confirm the strength of key levels by comparing short-term moves with the broader market trend.
Break of Structure (BoS) and Change of Character (CHoCH) : These signals highlight moments when the market shifts its behavior. A BoS indicates that a previous level of support or resistance has been overcome, while a CHoCH signals a change in the market’s character. Both are marked clearly on the chart using distinct color codes.
Break of Structure + (BoS+) and Change of Character + (CHoCH+) : These signals highlight moments when the market shifts its behavior and is confirmed by prior price action. A BoS + indicates that a previous level of support or resistance has been overcome, while price action achieves higher highs and higher lows (resistance break) or lower highs and lower lows (support break). CHoCH + signals a change in the market’s character when supported by prior price action - lower highs for a support break and higher lows for a resistance break.
BoS and CHoCH
The image above shows BoS and CHoCH identified on the price chart, and explains what each signifies.
A Break Of Structure (BoS) occurs when price decisively moves beyond a previously established support or resistance level. It indicates that the current trend or market pattern is being challenged, and the market may be ready to change direction.
A Change of Character (CHoCH) describes a shift in how the market behaves. A CHoCH occurs when, in an uptrend, a previously established support level breaks, or in a downtrend, a previously established resistance level breaks.
This break indicates that the market's typical structure is shifting, suggesting that the current trend may be losing its strength and that a reversal or a new trend could be developing.
CHoCH+
The image above explains CHoCH+ and how it forms, while highlighting an instance where a downside CHoCH+ formed following lower highs.
A Change of Character + (CHoCH+) describes a shift in how the market behaves that is supported by prior price action. For support breaks, price must form lower highs before breaking support.
The image above explains CHoCH+ for resistance breaks, while highlighting an instance where a resistance point broke that was supported by prior price action.
BoS+
The image above explains BoS+ and how it forms, while highlighting an instance where an upside BoS+ formed following higher highs and higher lows.
A BoS+ resistance break requires higher highs and higher lows prior to the resistance point being closed over.
The image above explains BoS+ support break, while highlighting an instance where a downside BoS+ formed following lower highs and lower lows.
A BoS+ support break requires lower highs and lower lows prior to the support point being closed under.
Future BoS and CHoCH
Radi IQ also displays where the next BoS and CHoCH points are located.
The image above shows the feature in action. With this, traders will always know where the next key support/resistance breakpoints are before they actually occur.
Fair Value Gaps (FVG)
The indicator identifies gaps in the price where little or no trading occurred—known as fair value gaps. These gaps can act as temporary support or resistance and may indicate areas where the market is likely to correct. FVGs are displayed with clear color gradients that differentiate between upward and downward gaps.
The image above shows an identified upside FVG. In the image, the identified upside FVG acted as a support point for price.
The image above shows an identified downside FVG. In the image, the identified downside FVG acted as a resistance point for price.
Low Volume FVG
In addition to identifying trading FVGs - Radi IQ can also specifically detect low volume fair value gaps. Ideally, these fair value gaps will form inside a low volume node on a volume profile.
Low volume node FVGs are important because these are areas where very little trading occurred and is confirmable, indicating an imbalance in supply and demand. Since few trades took place there, the market often moves quickly through these zones when revisited, which can lead to rapid price changes. This "gap" in trading activity can serve as a signal for potential reversals or fast moves, offering opportunities to enter or exit positions based on expected market behavior.
The image above shows identified FVGs that formed on low volume.
Large Area FVGs
Radi IQ is also capable of filtering out “inconsequential” FVGs. With this, Radi IQ can be enabled to only mark FVGs that cover a wide price range.
The image above shows the feature enabled, and all identified FVGs formed with a wide price range.
Large Area FVGs and Low Volume FVGs Combined
Traders can also enable Radi IQ to only mark FVGs that form on low volume and have a wide price range - allowing traders to only identify the highest quality FVGs on the chart.
Order Blocks and Premium Discount Zones
Order Blocks: Radi IQ detects areas where large orders have previously been placed by institutional traders. These blocks can act as strong levels of support or resistance, and the indicator marks bullish and bearish order blocks with dedicated colors.
What is an order block?
Order blocks are clusters of orders that institutions have executed to enter or exit a market position. They typically form when there is a period of consolidation before a significant move. For example, the last bullish candle before a strong down move may indicate a supply order block, while the last bearish candle before a sharp rally might be considered a demand order block.
Why They Form:
Institutions don’t trade in small, sporadic amounts; they accumulate or distribute large volumes of an asset. To avoid slippage and minimize market impact, they execute these orders over a zone rather than at a single price point. This creates a recognizable “block” on the chart.
Order Block Identification Types
Strength Score
The “Strength Score” order block detection mode is a TradingIQ proprietary ranking system for identified order blocks.
Purpose
The purpose of the “Strength Score” ranking system is to determine the “strength” or significance of an order block and rate the zone’s likelihood to act as support/resistance when retested in the future.
The scoring system ranks from 0 - 10, with “0” indicating a “weak” score or low likelihood of acting as a key support/resistance level when retested in the future.
A rating of “5” indicates a “moderate” score, indicating that the order block has a moderate likelihood of acting as a key support/resistance level when retested in the future.
A rating of “10” indicates a “strong” score, indicating that the order block has a strong likelihood of acting as a key support/resistance level when retested in the future.
How It Works
The score is calculated by examining the price move following the formation of an order block. The stronger the price move after an order block forms - the higher the Strength Score.
The image above shows a bearish order block with a score of “5” identified on the chart. The order block successfully operates as a resistance point when retested.
The image above shows a bullish order block with a score of “5” identified on the chart. The order block successfully operates as a resistance point when retested.
Volume-Based
The volume-based order block detection method detects traditional order blocks, but goes one step further by identifying the highest concentration point of volume for the bar and drawing the order block around this concentration point.
Key features when using the volume-based order block detection method:
The top of the order block is anchored to the top of the highest volume concentration point of the bar
The bottom of the order block is anchored to the bottom of the highest volume concentration point of the bar
The total volume that went into creation of the order block is displayed on the chart
The total volume of the order block is recorded as a percentage relative to the total volume for all order blocks on the chart
The image above shows the detection method in action.
Breaker Blocks
A breaker block is a specific type of order block that gains significance when price breaks through it and then often retests the level as a new area of support or resistance. Essentially, it’s a zone where, after the initial break, the previous level (which once acted as strong support or resistance) flips roles. For example, in an uptrend, if the price falls below a key support level, that level can become a breaker block and act as resistance if the price tries to move back up. Conversely, in a downtrend, a broken resistance level can serve as new support. Traders monitor breaker blocks because they often mark a shift in market sentiment and can provide potential entry or exit points once the market re-engages with these levels.
The image above shows a breaker block above price acting as resistance.
The image above shows a breaker block below price acting as support.
Rejection Blocks
A rejection block is a price area where the market shows a strong unwillingness to move beyond a certain level. This typically happens when price approaches a specific level but then is quickly rejected, leading to a bounce in the opposite direction. In other words, a rejection block forms when traders' orders create a barrier, causing the price to reverse rather than break through. Traders watch these areas closely, as they often signal a strong concentration of supply or demand that could provide potential entry or exit points for trades.
The image above shows both a verified upside rejection block acting as resistance, and an untested downside rejection block.
Rejection blocks are expected to function as strong support/resistance points when retested in the future.
Premium Discount Zones
Premium Discount Zones : These zones reflect areas where price is trading above (premium) or below (discount) a fair value range. They help traders gauge whether the current market price is relatively high or low compared to historical averages.
Premium Discount Zones account for recent swing highs and lows to calculate a fair value along with discount and premium prices over an intermediate time window.
The image above shows the premium and discount price zones in action.
Equal Levels
The indicator also tracks and highlights equal levels, which occur when the market repeatedly tests the same price levels. Equal levels can reinforce the significance of a support or resistance area and are represented by their own set of color markers.
The image above shows Radi IQ distinguishing equal highs and equal lows.
Equal Highs
When you see two or more highs that are approximately the same, it suggests that the market is repeatedly rejecting attempts to push higher. This signals a strong resistance level where sellers (or stop-hunters) are active.
Equal Lows
Similarly, consecutive lows at the same level indicate strong support, where buyers step in consistently, preventing further decline.
Strong Highs and Lows
Strong High
A strong high is a price level where the market repeatedly fails to push higher. Typically, it’s characterized by:
Rejection: Price approaches the high but then reverses sharply, often leaving long upper wicks on the candlestick chart.
Consolidation: Multiple bars might show highs that are very close in value (often termed "equal highs"), indicating a well-established resistance zone.
Market Sentiment: This pattern suggests that sellers are actively defending that level, preventing further upward movement.
Strong Lows
Conversely, a strong low is a price level where the market repeatedly fails to break lower. It is identified by:
Bounce Back: Price touches the low and then rebounds sharply, often leaving long lower wicks.
Consistency: Multiple lows occur around the same level (sometimes referred to as "equal lows"), marking a solid support area.
Market Sentiment: This indicates that buyers are stepping in at that level, absorbing selling pressure and supporting the price.
The image above shows Radi IQ detecting both a strong high and strong low, while the detected strong low acts as support when retested.
Liquidity Grabs
Liquidity grabs occur when the market temporarily moves to absorb liquidity, often triggering stop-loss orders and leading to rapid price movements. Radi IQ flags these events by identifying conditions where price moves against recent pivots, helping traders spot potential liquidity-related reversals or breakouts.
The image above shows Radi IQ identifying both an upside liquidity grab and a downside liquidity grab.
Upside Liquidity Grab (Bearish)
An upside liquidity grab happens when the price moves above a well-known resistance area or recent high. This move is often short-lived.
Many traders place stop-loss orders or pending buy orders just above resistance levels. Institutional players may intentionally push price upward to trigger these orders, thereby “grabbing” the liquidity available at that level.
Downside Liquidity Grab (Bullish)
A downside liquidity grab is the mirror image: the price briefly dips below a key support level or recent low.
Traders often place stop-loss orders or pending sell orders just below support levels. An intentional drop below this support can trigger these stops, allowing institutional players to capture liquidity.
Multi-Timeframe Analysis and Swings
By using data from different timeframes, Radi IQ offers a broader perspective on market trends. It highlights significant swing highs and swing lows, providing visual cues that indicate the market’s directional bias. This feature assists traders in identifying both short-term opportunities and long-term trends.
The image above shows Radi IQ detecting higher swings and lower swings.
IQ Meters / Fibometer
IQ Meters (Fibometers) are a proprietary TradingIQ tool that allows traders to easily identify the highs and lows of the current trend and where current price is relative to these points.
The image above depicts the IQ Meters—an exclusive TradingIQ tool designed to help traders evaluate trend strength and retracement opportunities.
When the lower timeframe Zig Zag IQ and the higher timeframe Zig Zag IQ are out of sync (i.e., one is uptrending while the other is downtrending, with no active positions), the meters display a neutral color as shown in the image.
The key to using these meters is to identify trend unison and pinpoint key trend retracement entry opportunities. Fibonacci retracement levels for the current trend are interlaced along each meter, and the current price is converted to a retracement ratio of the trend.
These meters can mathematically determine where price stands relative to the larger and smaller trends, aiding in identifying entry opportunities.
The top of each meter indicates the highest price achieved during the current price move.
The bottom of each meter indicates the lowest price achieved during the current price move.
When both the larger and smaller trends are in sync and uptrending, or when a long position is active, the IQ meters turn green, indicating uptrend strength.
When both meters are green, it indicates uptrend strength as both the higher timeframe trend and lower timeframe trend are in unison. Look for price to retrace to key fibonacci retracement levels during this time period.
When both trends are in sync and downtrending, or when a short position is active, the IQ meters turn red, indicating downtrend strength.
When both meters are red, it indicates downtrend strength as both the higher timeframe trend and lower timeframe trend are in unison. Look for price to retrace to key fibonacci retracement levels during this time period.
Summary
Radi IQ serves as a robust, data-driven tool for traders who seek a deeper understanding of market structure. By integrating internal and external analysis, fair value gap detection, order block identification, premium discount zoning, equal level tracking, liquidity grabs and much more into one indicator, it offers a multi-layered view of the market. This helps traders not only recognize potential turning points and areas of market stress but also manage risk more effectively and plan their trades with greater precision. The indicator’s clear visual representation and dynamic updates make it a practical addition to any trader’s toolkit.
Script payant
ICT Breakers (BOS / MSS - Market Structure) [ICTProTools]The Breakers (Market Structure) indicator is designed to help traders identify true breaker structures , a key concept in Inner Circle Trader (ICT) methodology. In market structure, Breakers represent powerful shifts where a key high or low is broken, leading to a reversal in market direction. Most tools misinterpret structure shifts, using internal structure , leading to fake breakouts. This tool solves that problem by filtering out false signals , providing clear & structured insights , all with multi-timeframe compatibility.
💎 Key Features
⚡️ Breakers in action
The indicator shows the structure following ICT instructions. A breaker is defined by two lines:
The first line confirms the previous trend (it could be interpreted as a BOS).
The second line highlights the moment price breaks structure (with candle body or wick based on your chosen settings), signaling a shift in trend direction (like an MSS).
Furthermore, it’s important to note that a breaker not only shows the structure, but also defines a potential Point of Interest (POI), an area where price may retrace before continuing its trend.
Here, we can observe two clear structure shifts.
On the far left, the market was in a bearish trend, illustrated by the first visible (dotted and red) line. Shortly after, the second (solid and green) line appears, showing a break that initiates a new bullish trend.
This upward movement continues, with the last confirmation marked by a top structure line. And finally, the structure is broken once again indicating a transition back into a bearish trend.
💪 Real Structure with True Highs / Lows
Unlike many indicators that detect internal breakouts , this tool follows ICT’s true market structure rules .
In a bearish trend , a bullish breaker is only confirmed when the high that created the low is broken , and conversely for a bullish scenario.
Fake breakouts are ignored, preventing misleading signals.
In the image above, the white breakout is correctly ignored by the indicator, as it doesn't align with ICT’s structural rules. That white high is simply part of the internal structure, not the true swing point. Instead, the green line highlights the key level that truly matters, the one whose rupture would have confirmed a real change in market structure.
🔔 Smart Alerts for Structure Updates
Stay one step ahead with customizable alerts designed to notify you instantly when market structure changes occur.
Get notified for BOS (Continuation) and / or MSS (Breaker) events.
Set alerts for bullish , bearish , or both directions.
Choose between once or repeated alerts , based on your strategy.
This feature allows traders to remain focused and reactive , even when monitoring multiple markets.
In the alert settings, select which structure shifts you want to be notified of. Whether you're a scalper or a swing trader, the alerts keep you connected to key moments without needing to constantly monitor the chart.
⏳ Multi-Timeframe Structure
All features of the indicator are fully compatible with higher timeframes .
Get a broader view of market structure without switching timeframes.
Monitor higher timeframe structures and receive alerts, all without leaving your analysis chart .
In this example, the market structure of the 30m timeframe is displayed while on a 5m chart, providing a clearer perspective.
✨ Customization & User Control
Make it yours! The indicator allows full customization:
Swing bars (to confirm high / low)
Select your mode for Breakers (MSS) , using the candle body only or body / wick
Line style (type, width, color)
Choice of displayed timeframe
Activate any alert , with the frequency you want
🎯 Conclusion
✅ Avoid false signals by focusing on true ICT Breakers
✅ Smart alerts to never miss a structural shift
✅ Multi-timeframe support for enhanced analysis
✅ Clean & professional design for an optimal trading experience

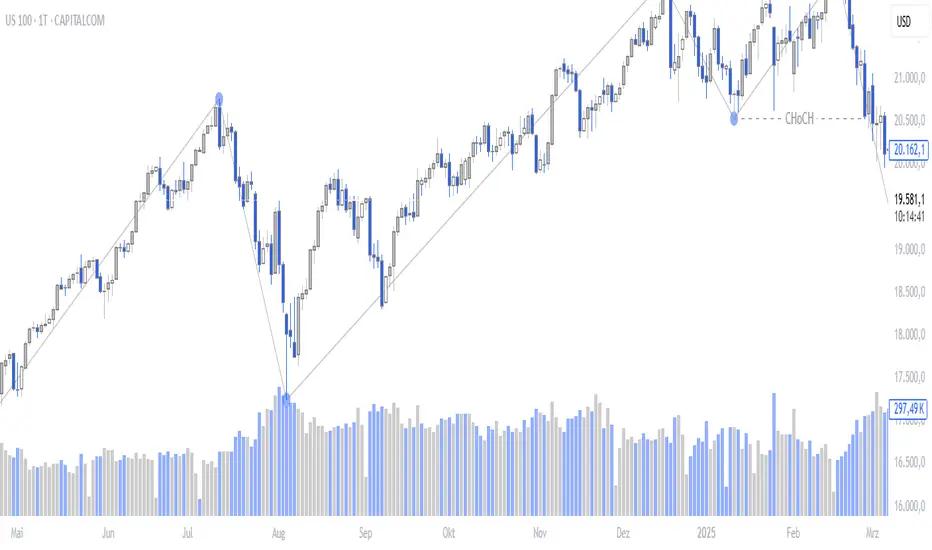
Market Structure MTF Trend [Pt]█ Author's Notes
There are numerous market structure indicators in the TradingView library, each offering a unique approach to identifying price action shifts. Market Structure MTF Trend was created with simplicity and flexibility in mind—providing a highly customizable multi-timeframe setup, visually clear trendlines, and straightforward labeling. This combination helps both new and experienced traders easily spot and interpret market structure changes.
█ Overview
Market Structure MTF Trend is a powerful yet user-friendly indicator designed to identify and visualize key turning points in price action. It focuses on two core concepts:
Change of Character (CHoCH): A momentary shift in the market’s behavior, signaling that the current price movement may be losing momentum and could soon reverse.
Break of Structure (BoS): A more definitive event confirming a new price pattern, where the market establishes a fresh trend direction by surpassing previous swing highs or lows.
By combining these signals across up to four different timeframes, even traders unfamiliar with market structure can quickly learn to spot and validate potential trend reversals or continuations.
█ Key Features
Multi-Timeframe Analysis: Monitors CHoCH and BoS events simultaneously on multiple intervals (e.g., 15m, 30m, 60m, 240m), providing a clear, layered understanding of market dynamics.
Straightforward Visual Cues: Labels are placed directly on the chart at swing highs and lows, while colored bars at the bottom give an instant snapshot of whether each timeframe is bullish or bearish.
Configurable Timeframes & Pivot Strength: Easily set up the desired intervals and adjust pivot strength to tune how sensitive the indicator is to minor price fluctuations.
Color-Coded Signals: Different colors help you distinguish between potential early reversals (CHoCH) and confirmed shifts (BoS), ensuring each signal’s importance is immediately clear.
█ Usage & Benefits
Learn Market Structure Basics: For those new to swing highs/lows, CHoCH, and BoS, the script’s on-chart labels and dynamic bar coloring provide a practical, visual way to grasp these concepts.
Spot Reversals Early: CHoCH alerts you to possible shifts in momentum, allowing you to anticipate trend changes before they fully develop.
Confirm Trend Breaks: BoS events confirm that the market has established a new directional bias, reinforcing higher‐probability entry or exit points.
Reduce Noise & Stay Focused: The multi-timeframe setup ensures you won’t overlook larger trends or get lost in smaller fluctuations.
Streamline Decision-Making: Color-coded bars let you gauge overall market sentiment at a glance—ideal for quickly validating trades without juggling multiple charts.
Market Structure MTF Trend is perfect for traders who want to learn or refine their understanding of price action. By integrating multiple timeframes into a single, cohesive interface, this tool highlights both subtle shifts and confirmed breaks in market structure, empowering you to trade with greater insight and confidence.

NoSweep CandlesNoSweep Candles – Identify Candles Without Liquidity Sweeps
The NoSweep Candles indicator highlights candles that do not break the high or low of the previous candle. This helps traders easily spot areas of consolidation, potential reversals, or moments of market indecision.
Key Features:
✅ White candle coloring when neither the high nor low of the previous candle is breached.
✅ Keeps default colors for other candles, maintaining a clean chart.
✅ Perfect for Smart Money Concept (SMC) traders, helping identify liquidity stability.
✅ No unnecessary signals or distractions, just pure price action analysis.
Use NoSweep Candles to refine your trading strategy and better understand market structure! 🚀
Advanced Market Structure & Order Blocks (fadi)Advanced Market Structure & Order Blocks indicator provides a new approach to understanding price action using ICT (Inner Circle Trader) concepts related to candle blocks to analyze the market behavior and eliminate much of the noise created by the price action.
This indicator is not intended to provide trade signals, it is designed to provide the traders with to support their trading strategies and add clarity where possible.
There are currently three main elements to this indicator:
Market Structure
Order Blocks
Liquidity Voids
Market Structure
In trading, market structure is often identified by observing higher highs and higher lows. An uptrend is characterized by a series of higher highs, where each peak surpasses the previous one, and higher lows, where each trough is higher than the preceding one. Conversely, a downtrend is marked by lower highs and lower lows.
Other indicators usually determine these peaks by calculating the highest or lowest levels within a predefined number of candles. For example, identifying the highest price level within the last 15 candles and marking it as a higher high or a lower high. While this approach offers some structure to price action, it can be arbitrary and random due to price fluctuations and the lack of proper structure analysis beyond finding the highest peaks and valleys within candle ranges.
In his 2022 mentorship, episode 12, ICT introduced an alternative approach focusing on three-candle pivots called Short Term High and Low (STH/STL), which are then used to calculate the Intermediate Term High and Low (ITH/ITL), and in turn, the Long Term High and Low (LTH/LTL). ICT’s approach provides better structure than the traditional method mentioned above. However, it can be confusing and difficult to track. There are great indicators that track and label ICT’s levels, but traders still find it challenging to follow and understand.
The Advanced Market Structure indicator takes a unique approach by analyzing candle formations, using ICT concepts, to identify possible turning points that mimic a real trader’s analysis of price action as closely as possible. However, it should be expected that Market Makers may use market manipulation to induce traders to make failed trades, and no tooling can eliminate these situations.
Advanced Market Structure tracks true Peaks and Valleys as they form, confirms them, and marks the chart with corresponding labels using traditional labeling methods (HH/HL/LH/LL), as such labeling makes it easier for traders to follow and understand. The indicator also draws levels to help identify possible liquidity areas and trade targets.
The indicator uses different calculation methods for the different type of market structure length, however all calculations are based on the same ICT candle blocks concepts.
Market Structure Settings
Other than the display settings, there are four (4) settings, mainly under the Level Settings section.
Allow Nested Candles
This option is only available on the Short Market Structure due to the methods used in calculating highs and lows. When used, the indicator will attempt to detect smaller fluctuations in price by tracking smaller candle moves, if any.
Level Settings
Level Settings allows the trader to decide two main calculations:
1. A new pivot point will form when a candle’s is crossed by the following candle’s
2. For a liquidity sweep and marking a level as mitigated, a candle’s must cross that level
Order Blocks
ICT (Inner Circle Trader) defines an Order Block as the last down-closing candle, or series of candles, before a significant upward price move or the last up-closing candle, or series of candles, before a significant downward price move. These key price levels, marked by substantial buy or sell orders from institutional traders or "smart money," create a block or zone on the price chart. When the price revisits these levels, it often leads to a strong market reaction. Order Blocks can consist of one or multiple consecutive candles of the same color, signaling areas of significant buying or selling interest. ICT's approach to Order Blocks provides traders with a structured method to identify potential areas of support or resistance, where price movements are more likely to change direction. Although ICT has shared some criteria for identifying Order Blocks publicly, the full details are reserved for his upcoming books. This indicator leverages the publicly available information to provide traders with valuable insights into these crucial price levels.
The Advanced Market Structure indicator is designed to be highly flexible, allowing traders to define their own combination of rules for identifying Order Blocks, thus customizing it to fit their unique trading strategies.
Order Block Configuration
Can be nested
An Order Block is defined as the last down candle or candles before a strong move higher, and vice versa for bearish Order Blocks. However, larger-than-usual candles resulting from news events or price action may not qualify as Order Blocks and can mute any Order Block within their range.
The "Can be nested" flag ensures that each Order Block is treated as an independent entity, even if it appears within the body of another Order Block.
Forms at swing point
Order Blocks formed at swing points typically have higher probabilities but are less frequent, assuming the same rules are applied. Additionally, Order Blocks at swing points may become Breaker and Mitigation blocks if they fail, providing more trading opportunities.
Forms a simple pivot point
A simple pivot point corresponds to ICT Short Term High and Low (STH/STL). Order Blocks using simple pivot points can occur in the middle of a move, not just at swing points. These are useful for identifying IOFED setups and supporting blocks that can bolster the price move.
Causes Market Structure Shift
Order Blocks that result in a break above or below a short swing point can help narrow down target order blocks, but they are less frequent. An Order Block causing a break above or below a pivot point does not necessarily indicate a strong Order Block. For example, an Order Block formed at a Lower Low is more likely to fail in a downtrend.
A clean close above order block
When the first candle breaks above an Order Block and closes above its high, this indicates a stronger Order Block. On the other hand, if a candle merely wicks through the Order Block without a solid close above it, it suggests a weaker Order Block. This may indicate hesitation or an impending reversal, as the wick represents a temporary and unsustained price movement.
Has displacement more than X the body
While some traders may capitalize on the initial break above an Order Block's CISD level, others prefer to focus on the return to an Order Block after displacement. Displacement is determined by the body size of the Order Block, and an Order Block cannot be tested until this level has been achieved.
Has a Fair Value Gap
When an Order Block is combined with a Fair Value Gap (FVG), it signifies a strong Order Block. The Fair Value Gap indicates a strong price movement away from the Order Block.
Has a liquidity void
A Liquidity Void occurs when two consecutive candles of the same color do not overlap, creating a gap similar to a Fair Value Gap, but involving one or more middle candles. Liquidity Voids can be utilized in combination with, or as an alternative to, the displacement setting.
Maximum number of OBs
The maximum number of Order Blocks to display.
Mitigated at block’s
An Order Block is considered mitigated when price reaches one of the main Order Block levels.
Liquidity Void
Liquidity Void refers to areas on a price chart where there is one-sided trading activity. This phenomenon occurs when the price of an asset moves sharply in one direction, leaving gaps where two consecutive candles of the same color do not overlap. These gaps can comprise one or more middle candles and indicates a pronounced lack of trading within that price range. Liquidity Voids are important because they highlight areas of minimal resistance, where price is more likely to return to fill the void and balance the market.
Liquidity Void vs Fair Value Gap
While both concepts are related to gaps in price action, they are distinct. A Fair Value Gap is a specific three-candle pattern where the middle candle creates a gap between the first and third candles. In contrast, a Liquidity Void represents a broader area on the chart where there is little to no trading activity, often encompassing multiple candles and indicating a more pronounced imbalance between buy and sell orders.
A FVG can be part of a Liquidity Void, a Liquidity Void can exist without necessarily including an FVG. Both concepts highlight areas of minimal resistance and potential price movement, but they differ in their formation and implications.
Advanced Market Structure and Order Blocks indicator focus on liquidity voids since a liquidity void can substitute for a FVG and it is usually less addressed by other indicators.

Market Participation Index [PhenLabs]📊 Market Participation Index
Version: PineScript™ v6
📌 Description
Market Participation Index is a well-evolved statistical oscillator that constantly learns to develop by adapting to changing market behavior through the intricate mathematical modeling process. MPI combines different statistical approaches and Bayes’ probability theory of analysis to provide extensive insight into market participation and building momentum. MPI combines diverse statistical thinking principles of physics and information and marries them for subtle changes to occur in markets, levels to become influential as important price targets, and pattern divergences to unveil before it is visible by analytical methods in an old-fashioned methodology.
🚀 Points of Innovation:
Automatic market condition detection system with intelligent preset selection
Multi-statistical approach combining classical and advanced metrics
Fractal-based divergence system with quality scoring
Adaptive threshold calculation using statistical properties of current market
🚨 Important🚨
The ‘Auto’ mode intelligently selects the optimal preset based on real-time market conditions, if the visualization does not appear to the best of your liking then select the option in parenthesis next to the auto mode on the label in the oscillator in the settings panel.
🔧 Core Components
Statistical Foundation: Multiple statistical measures combined with weighted approach
Market Condition Analysis: Real-time detection of market states (trending, ranging, volatile)
Change Point Detection: Bayesian analysis for finding significant market structure shifts
Divergence System: Fractal-based pattern detection with quality assessment
Adaptive Visualization: Dynamic color schemes with context-appropriate settings
🔥 Key Features
The indicator provides comprehensive market analysis through:
Multi-statistical Oscillator: Combines Z-score, MAD, and fractal dimensions
Advanced Statistical Components: Includes skewness, kurtosis, and entropy analysis
Auto-preset System: Automatically selects optimal settings for current conditions
Fractal Divergence Analysis: Detects and grades quality of divergence patterns
Adaptive Thresholds: Dynamically adjusts overbought/oversold levels
🎨 Visualization
Color-coded Oscillator: Gradient-filled oscillator line showing intensity
Divergence Markings: Clear visualization of bullish and bearish divergences
Threshold Lines: Dynamic or fixed overbought/oversold levels
Preset Information: On-chart display of current market conditions
Multiple Color Schemes: Modern, Classic, Monochrome, and Neon themes
Classic
Modern
Monochrome
Neon
📖 Usage Guidelines
The indicator offers several customization options:
Market Condition Settings:
Preset Mode: Choose between Auto-detection or specific market condition presets
Color Theme: Select visual theme matching your chart style
Divergence Labels: Choose whether or not you’d like to see the divergence
✅ Best Use Cases:
Identify potential market reversals through statistical divergences
Detect changes in market structure before price confirmation
Filter trades based on current market condition (trending vs. ranging)
Find optimal entry and exit points using adaptive thresholds
Monitor shifts in market participation and momentum
⚠️ Limitations
Requires sufficient historical data for accurate statistical analysis
Auto-detection may lag during rapid market condition changes
Advanced statistical calculations have higher computational requirements
Manual preset selection may be required in certain transitional markets
💡 What Makes This Unique
Statistical Depth: Goes beyond traditional indicators with advanced statistical measures
Adaptive Intelligence: Automatically adjusts to current market conditions
Bayesian Analysis: Identifies statistically significant change points in market structure
Multi-factor Approach: Combines multiple statistical dimensions for confirmation
Fractal Divergence System: More robust than traditional divergence detection methods
🔬 How It Works
The indicator processes market data through four main components:
Market Condition Analysis:
Evaluates trend strength, volatility, and price patterns
Automatically selects optimal preset parameters
Adapts sensitivity based on current conditions
Statistical Oscillator:
Combines multiple statistical measures with weights
Normalizes values to consistent scale
Applies adaptive smoothing
Advanced Statistical Analysis:
Calculates higher-order statistical moments
Applies information-theoretic measures
Detects distribution anomalies
Divergence Detection:
Uses fractal theory to identify pivot points
Detects and scores divergence quality
Filters signals based on current market phase
💡 Note:
The Market Participation Index performs optimally when used across multiple timeframes for confirmation. Its statistical foundation makes it particularly valuable during market transitions and periods of changing volatility, where traditional indicators often fail to provide clear signals.

Heatmap Suite [PhenLabs]📊 Heatmap Suite
Version: PineScript™ v6
📌 Description
The Heatmap Suite is an advanced technical analysis tool that combines multiple density calculation methods with dynamic visualization to identify significant price levels and trading activity zones. It features a sophisticated analysis system that processes price and volume data through various kernel methods, providing traders with insights into market structure, support/resistance zones, and potential price reaction areas.
🚀 Points of Innovation:
Multi-method density calculation incorporating three distinct approaches
Adaptive visualization system with dynamic color gradients
Real-time dashboard with key market metrics
Significant level detection with automatic threshold adjustment
🚨 Important🚨
🔸Comprehensive tooltips included in the PhenLabs dashboard for in depth guidance
🔧 Core Components
Density Analysis: Multiple calculation methods for price distribution assessment
Heat Mapping: Dynamic visualization of price congestion zones
Level Detection: Automatic identification of significant price levels
Dashboard System: Real-time market metrics and analysis
🔥 Key Features
The indicator provides comprehensive analysis through:
Kernel Density: Traditional balanced view of price distribution
Exponential Kernel: Time-weighted analysis emphasizing recent price action
Volume-Weighted: Focus on high-volume price areas
Significant Levels: Automatic detection of important price zones
Heat Distribution: Color-coded visualization of price congestion
🎨 Visualization
Heat Zones: Shows intensity of price activity
Significant Lines: Key level indicators
Color Gradients: Indicates density strength
Dashboard Display: Real-time metrics
Dynamic Opacity: Reflects density intensity
📖 Usage Guidelines
The indicator offers several customization options:
Basic Settings:
Calculation Method: Choose between three density calculation approaches
Lookback Period: Analysis timeframe adjustment
Zone Count: Price range division granularity
Heat Sensitivity: Contrast adjustment for visualization
🎛️ Visual Settings:
Dashboard Size: Text size customization
Position: Dashboard placement options
Color Scheme: Heat map gradient visualization
Level Display: Significant price zone indicators
✅ Best Use Cases:
Identify strong support/resistance zones through high-density areas
Spot potential price reversal zones at significant levels
Analyze price congestion patterns
Monitor real-time changes in market structure
⚠️ Limitations
Requires sufficient historical data
Computational intensity increases with longer lookback periods
Heat sensitivity needs adjustment based on market conditions
Dashboard placement may need adjustment based on price action
💡 What Makes This Unique
Multi-method Analysis: Three distinct calculation approaches
Adaptive Visualization: Dynamic color gradient system
Real-time Metrics: Comprehensive dashboard display
Automatic Level Detection: Significant price zone identification
Memory-efficient Design: Optimized calculation methods
🔬 How It Works
The indicator processes market data through four main components:
1. Density Calculation:
Processes price and volume data
Applies selected kernel method
Generates density distribution
2. Heat Mapping:
Converts density values to color gradients
Updates visualization in real-time
Displays price congestion zones
3. Level Detection:
Identifies significant price levels
Applies threshold filtering
Marks important zones
4. Dashboard Updates:
Calculates real-time metrics
Updates display components
Provides market context
💡Note:
The indicator performs best with adequate historical data and proper sensitivity settings. Its sophisticated density analysis provides valuable insights into market structure beyond traditional support/resistance indicators.

Volume Delta Imbalance Index [PhenLabs]📊 Volume Delta Imbalance Index (VDII)
Version: PineScript™ v6
Description
The Volume Delta Imbalance Index is an advanced technical analysis tool that combines volume profile analysis with price movement dynamics to identify significant market imbalances. It features a sophisticated analysis system that weighs recent versus historical volume delta imbalance patterns, providing traders with insights into potential market reversals and trend continuation scenarios.
Points of Innovation:
Custom volume delta calculation incorporating price and volume relationships
Adaptive smoothing system based on market volatility
Multi-component analysis combining flow, acceleration, and strength metrics
Real-time volume profile integration with historical context
🔧 Core Components
Volume Profile Analysis: Dynamic volume delta imbalance distribution assessment
Flow Imbalance Detection: Buy/sell pressure evaluation
Strength Analysis: Composite market strength measurement
Acceleration Framework: Volume movement dynamics
Statistical Bands: Adaptive threshold system
🚨 Key Features 🚨
The indicator provides comprehensive analysis through:
Volume Delta: Up to date volume imbalance measurement
Market Structure: Support/resistance level identification
Flow Analysis: Buy/sell pressure visualization
Acceleration Signals: Movement momentum detection
Adaptive Bands: Dynamic overbought/oversold levels
📈 Visualization
Color-coded Columns: Shows direction and strength of imbalance
Signal Lines: Strong buy/sell level indicators
Statistical Bands: Shows normal trading ranges
Gradient Fills: Indicates extreme market conditions
Dynamic Opacity: Reflects trend strength
📌 Usage Guidelines
The indicator offers several customization options:
Basic Settings:
Lookback Period: Analysis timeframe adjustment
Sensitivity Level: Signal response calibration
History Depth: Historical context range
Memory Setting: Recent vs. historical data weight
Visual Settings:
Color Scheme: Bullish/bearish signal colors
Signal Levels: Strong buy/sell thresholds
Band Display: Statistical range visualization
✅ Best Use Cases / Things To Look For:
Wait for establishment in the initial trend when the VDII comes back towards zero and the color of the volume becomes more faint
Once this is established and the VDII pushes through to the other side look for small retracements above the zero line on the VDII leading you to believe it is a likely area for price to retrace and continue in its prior direction
Make sure you see the volume bars become more faint in color to give yo further confluence price will continue in its priorly established direction
⚠️ Limitations
Requires sufficient volume data
Most effective in liquid markets
Historical depth affects calculation speed
Possible lag in highly volatile conditions
What Makes This Unique
Composite Volume Analysis: Combines multiple volume metrics
Adaptive Calculation: Adjusts to market volatility
Profile Integration: Incorporates volume profile analysis
Multi-component Scoring: Weighted analysis system
Memory-efficient Design: Optimized for real-time analysis
🔧 How It Works
The indicator processes market data through four main components:
1. Volume Profile Analysis:
Creates dynamic volume delta distribution profiles
Weights recent versus historical data
Identifies significant price levels
2. Flow Imbalance Detection:
Analyzes buying versus selling pressure
Calculates normalized flow ratios
Determines market bias
3. Strength Analysis:
Measures composite market strength
Incorporates volume-weighted movements
Provides trend strength indication
4. Final Score Calculation:
Combines all components with weighted importance
Applies volatility-based smoothing
Generates final signal output
5. VDII Potential Reversal Confluences
Bars between signal confluence is default set to 10 but you can change it to whatever you’d prefer
Signals are a compiled look at the indicator as a whole determining where it think reversals or retracements are likely
💡 Note:
The indicator performs best in markets with consistent volume and clear trending or ranging conditions. Its sophisticated volume analysis provides valuable insights into market dynamics beyond traditional price-based indicators.

IronCondor 10am 30TF by RMThe IronCondor 10am 30TF indicator shows Iron Condor trades win rate over a large number of days.
The default ETFs in this indicators are "QQQ", "SPY", "RUT" , "CBTX" and "SPX", other entries have not been tested.
Iron Condor quick explanation:
- Iron Condors trades have four options, generally, are based around a Midpoint price (Current Market Price Strike) and
- Two equally distances Strikes for the SELL components (called the Body of the Iron Condor)
- Further away from the two SELLs, another Two BUYs for protection (not considered in this indicator)
- Iron Condors are used for Passive Income based on small gains most of the time.
The IronCondor 10am 30TF has its logic created based on the premises that:
- Most days the market prices stay within a range.
- As example the S&P market prices would stay within 1% on about 80% of the time
- The moving markets (bullish or bearish) occur about 20% of the time
- The biggest market price volatility generally occurs before market opens and then around the first hour or so of trade in the day.
- After the first hour or so of the market the prices would be most likely to stay within a range.
The operation is simple:
- At the Trade Star time in the day (say 10:30 Hrs.) draws a vertical yellow line, then
- Creates two blue horizontal lines for the SELL limits in the Iron Condor Body, at +/- 1% price boundary (check Ticker list below for values)
- At the Trade End time (say 16:00 Hrs.) checks that none of the SELL limits have been broken by highs or lows during the trade day
(The check is done calculating at Trade End time the high/lows 10 bars back for 30 min TF - timeframe)
- There is a label at each Trade End time with Win/Loss and Body value.
- There is one final label with overall calculated past performance in Win percentage out of 'n' trades
Defaults and User Entries:
- The User can modify the Midpoint price called 'IronCondor Midpoint STRIKE' (default is the Candle Close at the selected time)
- The User can modify the Body value called 'IronCondor Body' (default is the Ticker's selected value as per list below)
"QQQ" or "SPY" Body = 5
"RUT" or "CBTX" Body = 20
"SPX" Body = 60
* Disclaimer: This is not a Financial tool, it cannot used as any kind of advice to invest or risk moneys in any market,
Markets are volatile in nature - with little or no warning - and will drain your account if you are not careful.
Use only as an academic demonstrator => * Use at your own risk *
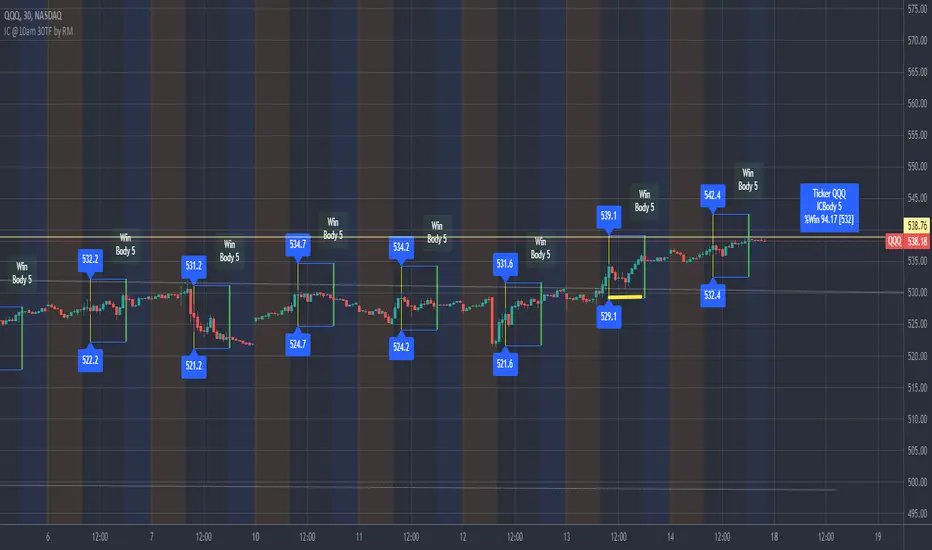
Dollar Cost Averaging (DCA) | FractalystWhat's the purpose of this strategy?
The purpose of dollar cost averaging (DCA) is to grow investments over time using a disciplined, methodical approach used by many top institutions like MicroStrategy and other institutions.
Here's how it functions:
Dollar Cost Averaging (DCA): This technique involves investing a set amount of money regularly, regardless of market conditions. It helps to mitigate the risk of investing a large sum at a peak price by spreading out your investment, thus potentially lowering your average cost per share over time.
Regular Contributions: By adding money to your investments on a pre-determined frequency and dollar amount defined by the user, you take advantage of compounding. The script will remind you to contribute based on your chosen schedule, which can be weekly, bi-weekly, monthly, quarterly, or yearly. This systematic approach ensures that your returns can earn their own returns, much like interest on savings but potentially at a higher rate.
Technical Analysis: The strategy employs a market trend ratio to gauge market sentiment. It calculates the ratio of bullish vs bearish breakouts across various timeframes, assigning this ratio a percentage-based score to determine the directional bias. Once this score exceeds a user-selected percentage, the strategy looks to take buy entries, signaling a favorable time for investment based on current market trends.
Fundamental Analysis: This aspect looks at the health of the economy and companies within it to determine bullish market conditions. Specifically, we consider:
Specifically, it considers:
Interest Rate: High interest rates can affect borrowing costs, potentially slowing down economic growth or making stocks less attractive compared to fixed income.
Inflation Rate: Inflation erodes purchasing power, but moderate inflation can be a sign of a healthy economy. We look for investments that might benefit from or withstand inflation.
GDP Rate: GDP growth indicates the overall health of the economy; we aim to invest in sectors poised to grow with the economy.
Unemployment Rate: Lower unemployment typically signals consumer confidence and spending power, which can boost certain sectors.
By integrating these elements, the strategy aims to:
Reduce Investment Volatility: By spreading out your investments, you're less impacted by short-term market swings.
Enhance Growth Potential: Using both technical and fundamental filters helps in choosing investments that are more likely to appreciate over time.
Manage Risk: The strategy aims to balance the risk of market timing by investing consistently and choosing assets wisely based on both economic data and market conditions.
----
What are Regular Contributions in this strategy?
Regular Contributions involve adding money to your investments on a pre-determined frequency and dollar amount defined by the user. The script will remind you to contribute based on your chosen schedule, which can be weekly, bi-weekly, monthly, quarterly, or yearly. This systematic approach ensures that your returns can earn their own returns, much like interest on savings but potentially at a higher rate.
----
How do regular contributions enhance compounding and reduce timing risk?
Enhances Compounding: Regular contributions leverage the power of compounding, where returns on investments can generate their own returns, potentially leading to exponential growth over time.
Reduces Timing Risk: By investing regularly, the strategy minimizes the risk associated with trying to time the market, spreading out the investment cost over time and potentially reducing the impact of volatility.
Automated Reminders: The script reminds users to make contributions based on their chosen schedule, ensuring consistency and discipline in investment practices, which is crucial for long-term success.
----
How does the strategy integrate technical and fundamental analysis for investors?
A: The strategy combines technical and fundamental analysis in the following manner:
Technical Analysis: It uses a market trend ratio to determine the directional bias by calculating the ratio of bullish vs bearish breakouts. Once this ratio exceeds a user-selected percentage threshold, the strategy signals to take buy entries, optimizing the timing within the given timeframe(s).
Fundamental Analysis: This aspect assesses the broader economic environment to identify sectors or assets that are likely to benefit from current economic conditions. By understanding these fundamentals, the strategy ensures investments are made in assets with strong growth potential.
This integration allows the strategy to select investments that are both technically favorable for entry and fundamentally sound, providing a comprehensive approach to investment decisions in the crypto, stock, and commodities markets.
----
How does the strategy identify market structure? What are the underlying calculations?
Q: How does the strategy identify market structure?
A: The strategy identifies market structure by utilizing an efficient logic with for loops to pinpoint the first swing candle that features a pivot of 2. This marks the beginning of the break of structure, where the market's previous trend or pattern is considered invalidated or changed.
What are the underlying calculations for identifying market structure?
A: The underlying calculations involve:
Identifying Swing Points: The strategy looks for swing highs (marked with blue Xs) and swing lows (marked with red Xs). A swing high is identified when a candle's high is higher than the highs of the candles before and after it. Conversely, a swing low is when a candle's low is lower than the lows of the candles before and after it.
Break of Structure (BOS):
Bullish BOS: This occurs when the price breaks above the swing high level of the previous structure, indicating a potential shift to a bullish trend.
Bearish BOS: This happens when the price breaks below the swing low level of the previous structure, signaling a potential shift to a bearish trend.
Structural Liquidity and Invalidation:
Structural Liquidity: After a break of structure, liquidity levels are updated to the first swing high in a bullish BOS or the first swing low in a bearish BOS.
Structural Invalidation: If the price moves back to the level of the first swing low before the bullish BOS or the first swing high before the bearish BOS, it invalidates the break of structure, suggesting a potential reversal or continuation of the previous trend.
This method provides users with a technical approach to filter market regimes, offering an advantage by minimizing the risk of overfitting to historical data, which is often a concern with traditional indicators like moving averages.
By focusing on identifying pivotal swing points and the subsequent breaks of structure, the strategy maintains a balance between sensitivity to market changes and robustness against historical data anomalies, ensuring a more adaptable and potentially more reliable market analysis tool.
What entry criteria are used in this script?
The script uses two entry models for trading decisions: BreakOut and Fractal.
Underlying Calculations:
Breakout: The script records the most recent swing high by storing it in a variable. When the price closes above this recorded level, and all other predefined conditions are satisfied, the script triggers a breakout entry. This approach is considered conservative because it waits for the price to confirm a breakout above the previous high before entering a trade. As shown in the image, as soon as the price closes above the new candle (first tick), the long entry gets taken. The stop-loss is initially set and then moved to break-even once the price moves in favor of the trade.
Fractal: This method involves identifying a swing low with a period of 2, which means it looks for a low point where the price is lower than the two candles before and after it. Once this pattern is detected, the script executes the trade. This is an aggressive approach since it doesn't wait for further price confirmation. In the image, this is represented by the 'Fractal 2' label where the script identifies and acts on the swing low pattern.
----
How does the script calculate trend score? What are the underlying calculations?
Market Trend Ratio: The script calculates the ratio of bullish to bearish breakouts. This involves:
Counting Bullish Breakouts: A bullish breakout is counted when the price breaks above a recent swing high (as identified in the strategy's market structure analysis).
Counting Bearish Breakouts: A bearish breakout is counted when the price breaks below a recent swing low.
Percentage-Based Score: This ratio is then converted into a percentage-based score:
For example, if there are 10 bullish breakouts and 5 bearish breakouts in a given timeframe, the ratio would be 10:5 or 2:1. This could be translated into a score where 66.67% (10/(10+5) * 100) represents the bullish trend strength.
The score might be calculated as (Number of Bullish Breakouts / Total Breakouts) * 100.
User-Defined Threshold: The strategy uses this score to determine when to take buy entries. If the trend score exceeds a user-defined percentage threshold, it indicates a strong enough bullish trend to justify a buy entry. For instance, if the user sets the threshold at 60%, the script would look for a buy entry when the trend score is above this level.
Timeframe Consideration: The calculations are performed across the timeframes specified by the user, ensuring the trend score reflects the market's behavior over different periods, which could be daily, weekly, or any other relevant timeframe.
This method provides a quantitative measure of market trend strength, helping to make informed decisions based on the balance between bullish and bearish market movements.
What type of stop-loss identification method are used in this strategy?
This strategy employs two types of stop-loss methods: Initial Stop-loss and Trailing Stop-Loss.
Underlying Calculations:
Initial Stop-loss:
ATR Based: The strategy uses the Average True Range (ATR) to set an initial stop-loss, which helps in accounting for market volatility without predicting price direction.
Calculation:
- First, the True Range (TR) is calculated for each period, which is the greatest of:
- Current Period High - Current Period Low
- Absolute Value of Current Period High - Previous Period Close
- Absolute Value of Current Period Low - Previous Period Close
- The ATR is then the moving average of these TR values over a specified period, typically 14 periods by default. This ATR value can be used to set the stop-loss at a distance from the entry price that reflects the current market volatility.
Swing Low Based:
For this method, the stop-loss is set based on the most recent swing low identified in the market structure analysis. This approach uses the lowest point of the recent price action as a reference for setting the stop-loss.
Trailing Stop-Loss:
The strategy uses structural liquidity and structural invalidation levels across multiple timeframes to adjust the stop-loss once the trade is profitable. This method involves:
Detecting Structural Liquidity: After a break of structure, the liquidity levels are updated to the first swing high in a bullish scenario or the first swing low in a bearish scenario. These levels serve as potential areas where the price might find support or resistance, allowing the stop-loss to trail the price movement.
Detecting Structural Invalidation: If the price returns to the level of the first swing low before a bullish break of structure or the first swing high before a bearish break of structure, it suggests the trend might be reversing or invalidating, prompting the adjustment of the stop-loss to lock in profits or minimize losses.
By using these methods, the strategy dynamically adjusts the initial stop-loss based on market volatility, helping to protect against adverse price movements while allowing for enough room for trades to develop. The ATR-based stop-loss adapts to the current market conditions by considering the volatility, ensuring that the stop-loss is not too tight during volatile periods, which could lead to premature exits, nor too loose during calm markets, which might result in larger losses. Similarly, the swing low based stop-loss provides a logical exit point if the market structure changes unfavorably.
Each market behaves differently across various timeframes, and it is essential to test different parameters and optimizations to find out which trailing stop-loss method gives you the desired results and performance. This involves backtesting the strategy with different settings for the ATR period, the distance from the swing low, and how the trailing stop-loss reacts to structural liquidity and invalidation levels.
Through this process, you can tailor the strategy to perform optimally in different market environments, ensuring that the stop-loss mechanism supports the trade's longevity while safeguarding against significant drawdowns.
What type of break-even and take profit identification methods are used in this strategy? What are the underlying calculations?
For Break-Even:
Percentage (%) Based:
Moves the initial stop-loss to the entry price when the price reaches a certain percentage above the entry.
Calculation:
Break-even level = Entry Price * (1 + Percentage / 100)
Example:
If the entry price is $100 and the break-even percentage is 5%, the break-even level is $100 * 1.05 = $105.
Risk-to-Reward (RR) Based:
Moves the initial stop-loss to the entry price when the price reaches a certain RR ratio.
Calculation:
Break-even level = Entry Price + (Initial Risk * RR Ratio)
For TP
- You can choose to set a take profit level at which your position gets fully closed.
- Similar to break-even, you can select either a percentage (%) or risk-to-reward (RR) based take profit level, allowing you to set your TP1 level as a percentage amount above the entry price or based on RR.
What's the day filter Filter, what does it do?
The day filter allows users to customize the session time and choose the specific days they want to include in the strategy session. This helps traders tailor their strategies to particular trading sessions or days of the week when they believe the market conditions are more favorable for their trading style.
Customize Session Time:
Users can define the start and end times for the trading session.
This allows the strategy to only consider trades within the specified time window, focusing on periods of higher market activity or preferred trading hours.
Select Days:
Users can select which days of the week to include in the strategy.
This feature is useful for excluding days with historically lower volatility or unfavorable trading conditions (e.g., Mondays or Fridays).
Benefits:
Focus on Optimal Trading Periods:
By customizing session times and days, traders can focus on periods when the market is more likely to present profitable opportunities.
Avoid Unfavorable Conditions:
Excluding specific days or times can help avoid trading during periods of low liquidity or high unpredictability, such as major news events or holidays.
What tables are available in this script?
- Summary: Provides a general overview, displaying key performance parameters such as Net Profit, Profit Factor, Max Drawdown, Average Trade, Closed Trades and more.
Total Commission: Displays the cumulative commissions incurred from all trades executed within the selected backtesting window. This value is derived by summing the commission fees for each trade on your chart.
Average Commission: Represents the average commission per trade, calculated by dividing the Total Commission by the total number of closed trades. This metric is crucial for assessing the impact of trading costs on overall profitability.
Avg Trade: The sum of money gained or lost by the average trade generated by a strategy. Calculated by dividing the Net Profit by the overall number of closed trades. An important value since it must be large enough to cover the commission and slippage costs of trading the strategy and still bring a profit.
MaxDD: Displays the largest drawdown of losses, i.e., the maximum possible loss that the strategy could have incurred among all of the trades it has made. This value is calculated separately for every bar that the strategy spends with an open position.
Profit Factor: The amount of money a trading strategy made for every unit of money it lost (in the selected currency). This value is calculated by dividing gross profits by gross losses.
Avg RR: This is calculated by dividing the average winning trade by the average losing trade. This field is not a very meaningful value by itself because it does not take into account the ratio of the number of winning vs losing trades, and strategies can have different approaches to profitability. A strategy may trade at every possibility in order to capture many small profits, yet have an average losing trade greater than the average winning trade. The higher this value is, the better, but it should be considered together with the percentage of winning trades and the net profit.
Winrate: The percentage of winning trades generated by a strategy. Calculated by dividing the number of winning trades by the total number of closed trades generated by a strategy. Percent profitable is not a very reliable measure by itself. A strategy could have many small winning trades, making the percent profitable high with a small average winning trade, or a few big winning trades accounting for a low percent profitable and a big average winning trade. Most mean-reversion successful strategies have a percent profitability of 40-80% but are profitable due to risk management control.
BE Trades: Number of break-even trades, excluding commission/slippage.
Losing Trades: The total number of losing trades generated by the strategy.
Winning Trades: The total number of winning trades generated by the strategy.
Total Trades: Total number of taken traders visible your charts.
Net Profit: The overall profit or loss (in the selected currency) achieved by the trading strategy in the test period. The value is the sum of all values from the Profit column (on the List of Trades tab), taking into account the sign.
- Monthly: Displays performance data on a month-by-month basis, allowing users to analyze performance trends over each month and year.
- Weekly: Displays performance data on a week-by-week basis, helping users to understand weekly performance variations.
- UI Table: A user-friendly table that allows users to view and save the selected strategy parameters from user inputs. This table enables easy access to key settings and configurations, providing a straightforward solution for saving strategy parameters by simply taking a screenshot with Alt + S or ⌥ + S.
User-input styles and customizations:
Please note that all background colors in the style are disabled by default to enhance visualization.
How to Use This Strategy to Create a Profitable Edge and Systems?
Choose Your Strategy mode:
- Decide whether you are creating an investing strategy or a trading strategy.
Select a Market:
- Choose a one-sided market such as stocks, indices, or cryptocurrencies.
Historical Data:
- Ensure the historical data covers at least 10 years of price action for robust backtesting.
Timeframe Selection:
- Choose the timeframe you are comfortable trading with. It is strongly recommended to use a timeframe above 15 minutes to minimize the impact of commissions/slippage on your profits.
Set Commission and Slippage:
- Properly set the commission and slippage in the strategy properties according to your broker/prop firm specifications.
Parameter Optimization:
- Use trial and error to test different parameters until you find the performance results you are looking for in the summary table or, preferably, through deep backtesting using the strategy tester.
Trade Count:
- Ensure the number of trades is 200 or more; the higher, the better for statistical significance.
Positive Average Trade:
- Make sure the average trade is above zero.
(An important value since it must be large enough to cover the commission and slippage costs of trading the strategy and still bring a profit.)
Performance Metrics:
- Look for a high profit factor, and net profit with minimum drawdown.
- Ideally, aim for a drawdown under 20-30%, depending on your risk tolerance.
Refinement and Optimization:
- Try out different markets and timeframes.
- Continue working on refining your edge using the available filters and components to further optimize your strategy.
What makes this strategy original?
Incorporation of Fundamental Analysis:
This strategy integrates fundamental analysis by considering key economic indicators such as interest rates, inflation, GDP growth, and unemployment rates. These fundamentals help in assessing the broader economic health, which in turn influences sector performance and market trends. By understanding these economic conditions, the strategy can identify sectors or assets that are likely to thrive, ensuring investments are made in environments conducive to growth. This approach allows for a more informed investment decision, aligning technical entries with fundamentally strong market conditions, thus potentially enhancing the strategy's effectiveness over time.
Technical Analysis Without Classical Methods:
The strategy's technical analysis diverges from traditional methods like moving averages by focusing on market structure through a trend score system.
Instead of using lagging indicators, it employs a real-time analysis of market trends by calculating the ratio of bullish to bearish breakouts. This provides several benefits:
Immediate Market Sentiment: The trend score system reacts more dynamically to current market conditions, offering insights into the market's immediate sentiment rather than historical trends, which can often lag behind real-time changes.
Reduced Overfitting: By not relying on moving averages or similar classical indicators, the strategy avoids the common pitfall of overfitting to historical data, which can lead to poor performance in new market conditions. The trend score provides a fresh perspective on market direction, potentially leading to more robust trading signals.
Clear Entry Signals: With the trend score, entry decisions are based on a clear percentage threshold, making the strategy's decision-making process straightforward and less subjective than interpreting moving average crossovers or similar signals.
Regular Contributions and Reminders:
The strategy encourages regular investments through a system of predefined frequency and amount, which could be weekly, bi-weekly, monthly, quarterly, or yearly. This systematic approach:
Enhances Compounding: Regular contributions leverage the power of compounding, where returns on investments can generate their own returns, potentially leading to exponential growth over time.
Reduces Timing Risk: By investing regularly, the strategy minimizes the risk associated with trying to time the market, spreading out the investment cost over time and potentially reducing the impact of volatility.
Automated Reminders: The script reminds users to make contributions based on their chosen schedule, ensuring consistency and discipline in investment practices, which is crucial for long-term success.
Long-Term Wealth Building:
Focused on long-term wealth accumulation, this strategy:
Promotes Patience and Discipline: By emphasizing regular contributions and a disciplined approach to both entry and risk management, it aligns with the principles of long-term investing, discouraging impulsive decisions based on short-term market fluctuations.
Diversification Across Asset Classes: Operating across crypto, stocks, and commodities, the strategy provides diversification, which is a key component of long-term wealth building, reducing risk through varied exposure.
Growth Over Time: The strategy's design to work with the market's natural growth cycles, supported by fundamental analysis, aims for sustainable growth rather than quick profits, aligning with the goals of investors looking to build wealth over decades.
This comprehensive approach, combining fundamental insights, innovative technical analysis, disciplined investment habits, and a focus on long-term growth, offers a unique and potentially effective pathway for investors seeking to build wealth steadily over time.
Terms and Conditions | Disclaimer
Our charting tools are provided for informational and educational purposes only and should not be construed as financial, investment, or trading advice. They are not intended to forecast market movements or offer specific recommendations. Users should understand that past performance does not guarantee future results and should not base financial decisions solely on historical data.
Built-in components, features, and functionalities of our charting tools are the intellectual property of @Fractalyst Unauthorized use, reproduction, or distribution of these proprietary elements is prohibited.
- By continuing to use our charting tools, the user acknowledges and accepts the Terms and Conditions outlined in this legal disclaimer and agrees to respect our intellectual property rights and comply with all applicable laws and regulations.

Market RhythmMarket Rhythm
Overview
If you’re a price-action enthusiast who loves to stay on top of structural shifts in the market, Market Rhythm is here to supercharge your charting experience! This script automatically identifies swing points (HH, LH, HL, LL), detects breaks of structure (BOS), flags changes of character (CHoCH), and offers an optional Trade Tip to guide your next move. It also provides a sleek table summarizing the latest signals so you can confirm momentum or pivot-based ideas at a glance.
What It Does
Swing Detection
Spots the last few pivot highs and lows on your chart.
Labels them as HH (Higher High), LH (Lower High), HL (Higher Low), or LL (Lower Low).
You can display all identified swings or only the most recent ones.
Adaptive Swing Logic
Optionally invert your swing lengths when the script detects a bearish trend, allowing it to adapt pivot detection automatically.
This means if the market flips to a downtrend, pivot detection reconfigures itself in real time.
Break of Structure (BOS)
If price breaks above the previous swing high or below the previous swing low, the script prints a BOS line on the chart.
You can choose whether to confirm breakouts via candle closes or wicks.
CHoCH (Change of Character)
When a BOS flips from bullish to bearish (or vice versa) against the prior direction, it’s renamed CHoCH for added clarity.
Color-coded lines and labels let you instantly see if the market’s “character” is reversing.
Optional Trade Tip
The script can suggest “Look for Long” or “Look for Short” based on your last pivot type and overall trend direction.
This “Trade Tip” is completely optional: enable or disable it in the settings, and the table reconfigures itself automatically.
Information Table
A compact on-chart table gives you an at-a-glance summary of:
Trend – Are we bullish, bearish, or uncertain?
Last BOS – If there’s a recent break of structure, how many bars ago did it happen?
Last CHoCH – If the market made a sudden reversal, how many bars back?
Trade Tip (Optional) – Summarizes whether conditions favor a long or short setup, or if it’s best to wait.
Alerts
Built-in alert conditions let you know when a BOS or CHoCH happens (bullish or bearish).
Turn them on to receive notifications without staring at the screen all day.
Chart Elements
Swing Labels: “HH,” “LH,” “HL,” “LL” near the pivot bars.
BOS & CHoCH Lines: Solid/dashed/dotted lines drawn across your chart, marking the level of structure that got broken.
Color Codes: Bullish signals are tinted in blue-ish tones, bearish signals in pink/purple-ish tones, making it easy to parse your chart visually.
Trade Tip Row: If enabled, instantly highlights “Look for Long” or “Look for Short” in a color-coded cell (blue for long, purple for short, gray if none).
Key Settings
Swing Points
Swing Points Display: Show all pivots, only the last set, or no pivots at all.
Invert Right Swing in Bearish Trend: Automatically swap your “Right Swing Length (High)” and “Right Swing Length (Low)” once the script detects a bearish trend (signaled by the most recent CHoCH).
Left Swing Length / Right Swing Length High/Low: Control how sensitive pivot detection is for highs vs. lows.
Pivot Source: Decide if your pivots are based on candle closes or wicks.
BOS Settings
Show BOS: Hide or reveal the Break of Structure lines entirely.
BOS Confirmation: Candle closes or wicks needed for a “true” breakout.
Line Style / Width / Color: Customize the BOS lines to your liking.
Show Only Last BOS: Show only the freshest BOS or keep historical ones on the chart.
CHoCH Settings
Show CHoCH: Rename the first opposite BOS to CHoCH if desired.
Bullish/Bearish Colors: Pick your favorite color theme for CHoCH lines.
Line Style / Width / Show Only Last CHoCH: Similar customizing options as BOS lines.
Table Settings
Show Table: Toggle the entire summary table on/off.
Position & Text Size: Choose table location (top-left, bottom-right, etc.) and text size (small to huge).
Show 'Trade Tip' row: Decide whether to add a fourth row that suggests potential trade direction. If disabled, the table has only three rows (Trend, Last BOS, and Last CHoCH).
Alerts
Several alert conditions are built in (e.g., “Bullish BOS Alert,” “Bearish BOS Alert,” “CHoCH Alert,” etc.), so you can set notifications for real-time structural shifts.
Why You’ll Love It
Visual Clarity: No more guesswork on which pivot was broken or whether a CHoCH just took place—color-coded lines and labels handle it.
Flexible Pivot Logic: Candle closes vs. wicks, separate right swing lengths for highs and lows, and an adaptive approach if the market goes bearish.
Quick Glance Table: Summaries of the latest signals keep you in the loop without cluttering your chart.
Trade Tip Option: Let the script gently nudge you toward potential bullish or bearish setups—only if you want it to!
Alerts for Everything: BOS and CHoCH can trigger alerts so you never miss a key structural change.
Give Market Rhythm a go, and watch your chart transform into a dynamic story of structure breaks, pivot swings, and potential trade cues. Whether you’re a short-term scalper or a higher-timeframe swing trader, this tool aims to simplify your analysis and keep you laser-focused on what matters.
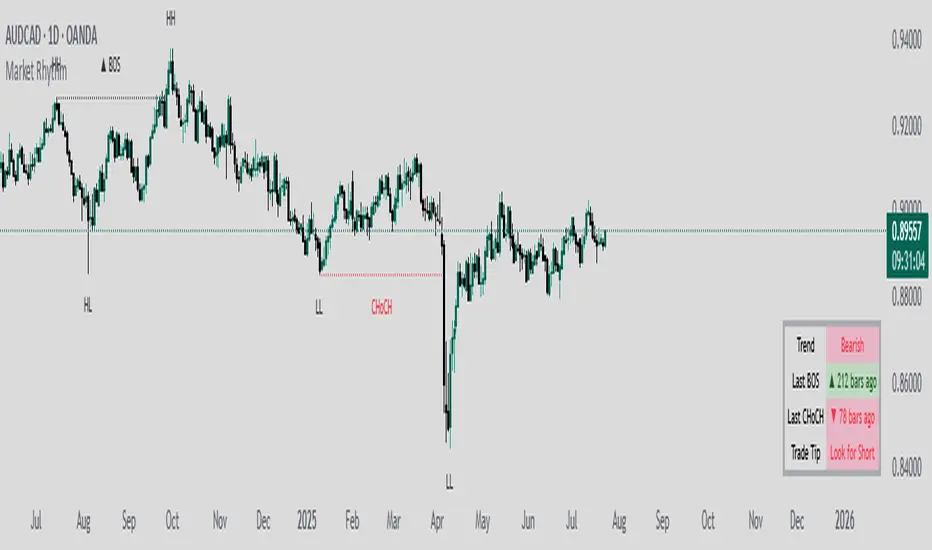
2022 Model ICT Entry Strategy [TradingFinder] One Setup For Life🔵 Introduction
The ICT 2022 model, introduced by Michael Huddleston, is an advanced trading strategy rooted in liquidity and price imbalance, where time and price serve as the core elements. This ICT 2022 trading strategy is an algorithmic approach designed to analyze liquidity and imbalances in the market. It incorporates concepts such as Fair Value Gap (FVG), Liquidity Sweep, and Market Structure Shift (MSS) to help traders identify liquidity movements and structural changes in the market, enabling them to determine optimal entry and exit points for their trades.
This Full ICT Day Trading Model empowers traders to pinpoint the Previous Day High/Low as well as the highs and lows of critical sessions like the London and New York sessions. These levels act as Liquidity Zones, which are frequently swept prior to a market structure shift (MSS) or a retracement to areas such as Optimal Trade Entry (OTE).
Bullish :
Bearish :
🔵 How to Use
The ICT 2022 model is a sophisticated trading strategy that focuses on identifying key liquidity levels and price movements. It operates based on two main principles. In the first phase, the price approaches liquidity zones and sweeps critical levels such as the previous day’s high or low and key session levels.
This movement is known as a Liquidity Sweep. In the second phase, following the sweep, the price retraces to areas like the FVG (Fair Value Gap), creating ideal entry points for trades. Below is a detailed explanation of how to apply this strategy in bullish and bearish setups.
🟣 Bullish ICT 2022 Model Setup
To use the ICT 2022 model in a bullish setup, start by identifying the Previous Day High/Low or key session levels, such as those of the London or New York sessions. In a bullish setup, the price usually moves downward first, sweeping the Liquidity Low. This move, known as a Liquidity Sweep, reflects the collection of buy orders by major market participants.
After the liquidity sweep, the price should shift market structure and start moving upward; this shift, referred to as Market Structure Shift (MSS), signals the beginning of an upward trend. Following MSS, areas like FVG, located within the Discount Zone, are identified. At this stage, the trader waits for the price to retrace to these zones. Once the price returns, a long trade is executed.
Finally, the stop-loss should be set below the liquidity low to manage risk, while the take-profit target is usually placed above the previous day’s high or other identified liquidity levels. This structure enables traders to take advantage of the upward price movement after the liquidity sweep.
🟣 Bearish ICT 2022 Model Setup
To identify a bearish setup in the ICT 2022 model, begin by marking the Previous Day High/Low or key session levels, such as the London or New York sessions. In this scenario, the price typically moves upward first, sweeping the Liquidity High. This move, known as a Liquidity Sweep, signifies the collection of sell orders by key market players.
After the liquidity sweep, the price should shift market structure downward. This movement, called the Market Structure Shift (MSS), indicates the start of a downtrend. Following MSS, areas such as FVG, found within the Premium Zone, are identified. At this stage, the trader waits for the price to retrace to these areas. Once the price revisits these zones, a short trade is executed.
In this setup, the stop-loss should be placed above the liquidity high to control risk, while the take-profit target is typically set below the previous day’s low or another defined liquidity level. This approach allows traders to capitalize on the downward price movement following the liquidity sweep.
🔵 Settings
Swing period : You can set the swing detection period.
Max Swing Back Method : It is in two modes "All" and "Custom". If it is in "All" mode, it will check all swings, and if it is in "Custom" mode, it will check the swings to the extent you determine.
Max Swing Back : You can set the number of swings that will go back for checking.
FVG Length : Default is 120 Bar.
MSS Length : Default is 80 Bar.
FVG Filter : This refines the number of identified FVG areas based on a specified algorithm to focus on higher quality signals and reduce noise.
Types of FVG filters :
Very Aggressive Filter: Adds a condition where, for an upward FVG, the last candle's highest price must exceed the middle candle's highest price, and for a downward FVG, the last candle's lowest price must be lower than the middle candle's lowest price. This minimally filters out FVGs.
Aggressive Filter: Builds on the Very Aggressive mode by ensuring the middle candle is not too small, filtering out more FVGs.
Defensive Filter: Adds criteria regarding the size and structure of the middle candle, requiring it to have a substantial body and specific polarity conditions, filtering out a significant number of FVGs.
Very Defensive Filter: Further refines filtering by ensuring the first and third candles are not small-bodied doji candles, retaining only the highest quality signals.
🔵 Conclusion
The ICT 2022 model is a comprehensive and advanced trading strategy designed around key concepts such as liquidity, price imbalance, and market structure shifts (MSS). By focusing on the sweep of critical levels such as the previous day’s high/low and important trading sessions like London and New York, this strategy enables traders to predict market movements with greater precision.
The use of tools like FVG in this model helps traders fine-tune their entry and exit points and take advantage of bullish and bearish trends after liquidity sweeps. Moreover, combining this strategy with precise timing during key trading sessions allows traders to minimize risk and maximize returns.
In conclusion, the ICT 2022 model emphasizes the importance of time and liquidity, making it a powerful tool for both professional and novice traders. By applying the principles of this model, you can make more informed trading decisions and seize opportunities in financial markets more effectively.

Choppiness IndexThis Pine Script v6 indicator calculates the Choppiness Index over a user-defined length and segments it based on user-defined thresholds for choppy and trending market conditions. The indicator allows users to toggle the visibility of choppy, trending, and neutral segments using checkboxes.
Here's how it works:
Inputs: Users can set the length for the Choppiness Index calculation and thresholds for choppy and trending conditions. They can also choose which segments to display.
Choppiness Index Calculation: The script calculates the Choppiness Index using the ATR and the highest-high and lowest-low over the specified length.
Segment Determination: The script determines which segment the current Choppiness Index value falls into based on the thresholds. The color changes exactly at the threshold values.
Dynamic Plotting: The Choppiness Index is plotted with a color that changes based on the segment. The plot is only visible if the segment is "turned on" by the user.
Threshold Lines: Dashed horizontal lines are plotted at the choppy and trending thresholds for reference.
This indicator helps traders visualize market conditions and identify potential transitions between choppy and trending phases, with precise color changes at the threshold values.

Smart Money Breakout Signals [AlgoAlpha]Introducing the Smart Money Breakout Signals, a cutting-edge trading indicator designed to identify key structural shifts and breakout opportunities in the market. This tool leverages a blend of smart money concepts like Break of Structure (BOS) and Change of Character (CHoCH) to provide traders with actionable insights into market direction and potential entry or exit points.
Key Features :
✨ Market Structure Analysis : Automatically detects and labels BOS and CHoCH for trend confirmation and reversals.
🎨 Customizable Visualization : Tailor bullish and bearish colors for breakout lines and signals to suit your preferences.
📊 Dynamic Take-Profit Targets : Displays three tiered take-profit levels based on breakout volatility.
🔔 Real-Time Alerts : Stay ahead of the game with notifications for bullish and bearish breakouts.
📋 Performance Dashboard : Monitor signal statistics, including win rates and total signals, directly on your chart.
How to Use :
Add the Indicator : Add the script to your favourites ⭐ and customize settings like market structure horizon and confirmation type.
Monitor Breakouts : Observe BOS and CHoCH labels to identify potential trend shifts. Use the breakout lines and tiered take-profit levels to plan trades effectively.
Set Alerts : Enable alerts for bullish or bearish breakouts to act on opportunities without constant monitoring.
How It Works :
The indicator identifies market structure by analyzing pivot highs and lows over a user-defined time horizon. A breakout is confirmed based on either candle closes or wicks surpassing previous pivot points. Upon detection, the script generates signals with breakout lines and calculates take-profit targets based on the distance from the breakout level. A built-in dashboard tracks performance metrics like total signals and win rates, giving traders real-time feedback on strategy effectiveness.

The Curved Market Structure [BigBeluga]Curved Market Structure
The Curved Market Structure indicator offers an innovative twist on traditional market structure tools by using curved lines instead of horizontal ones, enabling faster breakout detection for traders.
🔵Key Features:
Curved Market Structure Levels: The indicator identifies high and low pivots and plots curved lines connecting these points, adapting to market dynamics and providing a more intuitive view of potential breakout zones.
Breakout Detection: Breakouts above or below the curved levels are marked with triangle symbols (▲ or ▼), making it easy to spot critical price movements.
Dynamic Target Levels: After a breakout, the indicator plots three target levels, which serve as potential price objectives. Each target is marked with a number and a star (e.g., 1★) upon being reached.
Customizable Line Length and Angle: Users can adjust the length and angle of the curved lines to fit their trading style and timeframe, making the tool versatile and adaptable.
Market Structure Trend Filtering: To maintain a clean chart, the indicator plots curved levels only from high pivots during uptrends and low pivots during downtrends.
🔵How It Works:
The indicator identifies high and low pivots using user-defined parameters (left and right bars).
Curved lines are drawn from these pivot points, showing the structure of the market and potential breakout zones.
When a breakout occurs, the indicator highlights the direction with triangle symbols and dynamically plots three price targets.
Upon reaching these targets, the level is marked with its respective number and a star, helping traders track price progression effectively.
The lines and targets are adjusted based on market conditions, ensuring real-time relevance and accuracy.
🔵Use Cases:
Spotting key breakout zones to identify entry and exit points more effectively.
Setting dynamic target levels for take-profit or stop-loss planning.
Filtering market noise and maintaining a cleaner chart while analyzing trends.
Enhancing traditional market structure analysis with an intuitive curved visualization.
This indicator is ideal for traders who want a modern, dynamic, and visually appealing way to track market structure and breakouts while maintaining chart clarity.

QuantFrame | FractalystWhat’s the purpose of this indicator?
The purpose of QuantFrame is to provide traders with a systematic approach to analyzing market structure, eliminating subjectivity, and enhancing decision-making. By clearly identifying and labeling structural breaks, QuantFrame helps traders:
1. Refine Market Analysis: Transition from discretionary market observation to a structured framework.
2. Identify Key Levels: Highlight important liquidity and invalidation zones for potential entries, exits, and risk management.
3. Streamline Multi-Timeframe Analysis: Track market trends and structural changes across different timeframes seamlessly.
4. Enhance Consistency: Reduce guesswork by following a rule-based methodology for identifying structural breaks.
How Does This Indicator Identify Market Structure?
1. Swing Detection
• The indicator identifies key swing points on the chart. These are local highs or lows where the price reverses direction, forming the foundation of market structure.
2. Structural Break Validation
• A structural break is flagged when a candle closes above a previous swing high (bullish) or below a previous swing low (bearish).
• Break Confirmation Process:
To confirm the break, the indicator applies the following rules:
• Valid Swing Preceding the Break: There must be at least one valid swing point before the break.
3. Numeric Labeling
• Each confirmed structural break is assigned a unique numeric ID starting from 1.
• This helps traders track breaks sequentially and analyze how the market structure evolves over time.
4. Liquidity and Invalidation Zones
• For every confirmed structural break, the indicator highlights two critical zones:
1. Liquidity Zone (LIQ): Represents the structural liquidity level.
2. Invalidation Zone (INV): Acts as Invalidation point if the structure fails to hold.
What do the extremities show us on the charts?
When using QuantFrame for market structure analysis, the extremities—Liquidity Level (LIQ) and Invalidation Level (INV)—serve as critical reference points for understanding price behavior and making informed trading decisions.
Here's a detailed explanation of what these extremities represent and how they function:
Liquidity Level (LIQ)
Definition: The Liquidity Level is a key price zone where the market is likely to retest, consolidate, or seek liquidity. It represents areas where orders are concentrated, making it a high-probability reaction zone.
Purpose: Traders use this level to anticipate potential pullbacks or continuation patterns. It helps in identifying areas where price may pause or reverse temporarily due to the presence of significant liquidity.
Key Insight: If a candle closes above or below the LIQ, it results in another break of structure (BOS) in the same direction. This indicates that price is continuing its trend and has successfully absorbed liquidity at that level.
Invalidation Level (INV)
Definition: The Invalidation Level marks the threshold that, if breached, signifies a structural shift in the market. It acts as a critical point where the current market bias becomes invalid.
Purpose: This level is often used as a stop-loss or re-evaluation point for trading strategies. It ensures that traders have a clear boundary for risk management.
Key Insight: If a candle closes above or below the INV, it signals a shift in market structure:
A closure above the INV in a bearish trend indicates a shift from bearish to bullish bias.
A closure below the INV in a bullish trend indicates a shift from bullish to bearish bias.
What does the top table display?
The top table in QuantFrame serves as a multi-timeframe trend overview. Here’s what it provides:
1. Numeric Break IDs Across Multiple Timeframes:
• Each numeric break corresponds to a confirmed structural break on a specific timeframe, helping traders track the most recent breaks systematically.
2. Trend Direction via Text Color:
• The color of the text reflects the current trend direction:
• Blue indicates a bullish structure.
• Red signifies a bearish structure.
3. Higher Timeframe Insights Without Manual Switching:
• The table eliminates the need to switch between timeframes by presenting a consolidated view of the market trend across multiple timeframes, saving time and improving decision-making.
What is the Multi-Timeframe Trend Score (MTTS)?
MTTS is a score that quantifies trend strength and direction across multiple timeframes.
How does MTTS work?
1. Break Detection:
• Analyzes bullish and bearish structural breaks on each timeframe.
2. Trend Scoring:
• Scores each timeframe based on the frequency and quality of bullish/bearish breaks.
3. MTTS Calculation:
• Averages the scores across all timeframes to produce a unified trend strength value.
How is MTTS interpreted?
• ⬆ (Above 50): Indicates an overall bullish trend.
• ⬇ (Below 50): Suggests an overall bearish trend.
• ⇅ (Exactly 50): Represents a neutral or balanced market structure.
How to Use QuantFrame?
1. Implement a Systematic Market Structure Framework:
• Use QuantFrame to analyze market structure objectively by identifying key structural breaks and marking liquidity (LIQ) and invalidation (INV) zones.
• This eliminates guesswork and provides a clear framework for understanding market movements.
2. Leverage MTTS for Directional Bias:
• Refer to the MTTS table to identify the multi-timeframe directional bias, giving you the broader market context.
• Align your trading decisions with the overall trend or structure to improve accuracy and consistency.
3. Apply Your Preferred Entry Model:
• Once the market context is clear, use your preferred entry model to capitalize on the identified structure and trend.
• Manage trades dynamically as price delivers, using the provided liquidity and invalidation zones for risk management.
What Makes QuantFrame Original?
1. Objective Market Structure Analysis:
• Unlike subjective methods, QuantFrame uses a rule-based approach to identify structural breaks, ensuring consistency and reducing emotional decision-making.
2. Multi-Timeframe Integration:
• The MTTS table consolidates trend data across multiple timeframes, offering a bird’s-eye view of market trends without the need to switch charts manually.
• This unique feature allows traders to align strategies with higher-timeframe trends for more informed decision-making.
3. Liquidity and Invalidation Zones:
• Automatically marks Liquidity (LIQ) and Invalidation (INV) zones for every structural break, providing actionable levels for entries, exits, and risk management.
• These zones help traders define their risk-reward setups with precision.
4. Dynamic Trend Scoring (MTTS):
• The Multi-Timeframe Trend Score (MTTS) quantifies trend strength and direction across selected timeframes, offering a single, consolidated metric for market sentiment.
• This score is visualized with intuitive symbols (⬆, ⬇, ⇅) for quick decision-making.
5. Numeric Labeling of Breaks:
• Each structural break is assigned a unique numeric ID, making it easy to track, analyze, and backtest specific market scenarios.
6. Systematic Yet Flexible:
• While it provides a structured framework for market analysis, QuantFrame seamlessly integrates with any trading style. Traders can use it alongside their preferred entry models, adapting it to their unique strategies.
7. Enhanced Market Context:
• By combining structural insights with directional bias (via MTTS), the indicator equips traders with a complete market context, enabling them to make better-informed decisions.
Terms and Conditions | Disclaimer
Our charting tools are provided for informational and educational purposes only and should not be construed as financial, investment, or trading advice. They are not intended to forecast market movements or offer specific recommendations. Users should understand that past performance does not guarantee future results and should not base financial decisions solely on historical data.
Built-in components, features, and functionalities of our charting tools are the intellectual property of @Fractalyst use, reproduction, or distribution of these proprietary elements is prohibited.
By continuing to use our charting tools, the user acknowledges and accepts the Terms and Conditions outlined in this legal disclaimer and agrees to respect our intellectual property rights and comply with all applicable laws and regulations.