LJ Parsons Harmonic Time StampsPurpose of the Script
This script is designed to divide a specific time period on a market chart (from startDate to endDate) into fractional segments based on mathematically significant ratios. It then plots vertical lines at the first candle that occurs at or after each of these fractional timestamps. Each line is labeled according to an interval scheme, as outlined by LJ Parsons
"Structured Multiplicative, Recursive Systems in Financial Markets"
papers.ssrn.com
Providing a symbolic mapping of time fractions
zenodo.org
Start (00) and End (00): Marks the beginning and end of the period.
Intermediate labels (m2, M2, m3, M3, …): Represent divisions of the time period that correspond to specific fractions of the whole.
This creates a visual “resonance map” along the price chart, where the timing of price movements can be compared to mathematically significant points.
Parsons Market Resonance Theory proposes that markets move in patterns that are not random but resonate with underlying mathematical structures, analogous to logarithmic relationships. The key ideas reflected in this script are:
Temporal Fractional Resonance
By marking fractional points of a defined time period, the script highlights potential moments when market activity might “resonate” due to cyclical patterns. These points are analogous to overtones in music—certain times may have stronger market reactions.
Mapping Market Movements to "Just Intonation" Intervals
Assigning Interval labels to fractional timestamps provides a symbolic framework for understanding market behaviour. For example, the midpoint (P5) may correspond to strong market turning points, while minor or major intervals (m3, M6) might correspond to subtler movements.
Identifying Potentially Significant Points in Time
The plotted lines do not predict price direction but rather identify temporal markers where price movements may be more likely to display structured behaviour. Traders or researchers can then study price reactions around these lines for correlations with market resonance patterns.
In essence, the script turns a period of time into a harmonic structure, with each line and label acting like a “note” in the market’s temporal symphony. It’s a tool to visualize and test whether price behaviour aligns with the resonant fractions hypothesized in MRT.
Multitimeframe

Orderflow - Full suiteThis indicator provides a comprehensive institutional view of the market by aggregating real-time volume and delta data from the four largest crypto derivatives exchanges: Binance, Bybit, OKX, and Gate.io.
Unlike standard indicators that rely on a single data feed, this tool normalizes and combines volume from multiple sources to reveal the "True Market Volume." It features a sophisticated 1-Minute Granularity Scanner that analyzes the underlying 1m data within your current timeframe to detect hidden whale activity that is often smoothed out on higher timeframe charts.
Key Features:
🌊 Multi-Exchange Aggregation: Automatically fetches and sums volume from Binance, Bybit, OKX, and Gate.io. It handles currency normalization (converting USDT volume to Base Currency) to ensure accurate apples-to-apples calculations.
🐋 1-Minute Big Trade Scanner: The script scans the 1-minute candles underlying your current bar. It detects "Whale," "Huge," and "Large" trades that occur within a single minute, revealing aggressive market participants hiding inside consolidated candles.
🛡️ Absorption Detection: Identifies specific moments where high aggregated volume meets minimal price movement, highlighting areas where passive limit orders are absorbing aggressive flow.
📉 CVD Divergence: accumulating Aggregated Delta to spot divergences between price action and order flow (e.g., Price making Lower Lows while CVD makes Higher Lows).
📊 Dynamic Volume Profile: A fully functional Volume Profile driven by the global aggregated data, including Value Area (VAH/VAL) and POC logic.
⚖️ Market Balance & Retests: Automatically detects if the market is Balanced or Imbalanced and highlights valid retests of Value Area High/Low levels.
How to Use:
Bubbles: Represent Big Trades detected on the 1m timeframe (Blue = Buy, Red = Sell). Size indicates relative volume.
Diamonds: Indicate Absorption events (High volume, zero price progress).
Triangles: Indicate CVD Divergences (Potential reversals).
Right Panel: Displays the Volume Profile and Key Levels based on the total market liquidity.
Note: This indicator uses request.security_lower_tf to scan granular data. It is optimized for Crypto Perpetual pairs (USDT.P).

Volume Trabar Rank PRO🔑 Key Concept
The indicator uses a rank-based system that counts the number of timeframe periods (lengths) where price has exceeded standard deviation thresholds. The higher the absolute rank value, the more extreme the market condition — indicating stronger potential reversal zones.
⚙️ How The Indicator Works
The indicator operates on a unique multi-length Bollinger Band analysis system:
📏 Multiple Length Analysis
📊 Rank Calculation
Counts how many bands the price has broken through to generate a rank value from -18 to +18
🎨 Visual Coding
Color-coded histogram and threshold lines for quick visual interpretation
Ranking System Explained :
Rank Value Signal Strength Typical Action
+8 to +18 Very Strong Consider Selling / Taking Profit
+7 Strong Watch for reversal signals
+4 to +6 Moderate Caution for new longs
+1 to +3 Weak Monitor market conditions
0 Neutral No extreme condition
-1 to -3 Weak Monitor market conditions
-4 to -6 Moderate Look for entry opportunities
-7 Strong Strong buy signal
-8 to -18 Very Strong High probability buy zone
Advanced Features
✅Filter #1: Volume Weighting
✅Filter #2: Outlier Filtering (IQR)
✅Filter #3: Anti-Repaint Logic
⏰ Multi-Timeframe Analysis
The indicator can simultaneously monitor up to 4 different timeframes (default: 1m, 5m, 15m, 30m), allowing traders to:
Identify confluence zones where multiple timeframes show the same signal
Spot divergences between timeframes for better timing
Generate "READY" signals when all MTF conditions align
🎯 MTF Ready Signal
READY BUY: Triggers when MTF #1, #2, and #3 all show oversold ranks ≤ -5
READY SELL: Triggers when MTF #1, #2, and #3 all show overbought ranks ≥ +5
These signals indicate strong multi-timeframe alignment, providing high-probability trading opportunities.
You can see here :
🛠️ How This Indicator Was Created
Accuracy Improvements (v3.0)
Volume Weighting: Replaced SMA with VWMA for better accuracy
Outlier Filtering: Added IQR-based filtering to remove false signals from price spikes
✨ Key Advantages
🚫 No Repainting
Anti-repaint logic ensures signals don't disappear or change after bar closure, providing reliable backtesting and live trading signals.
📊 Multi-Timeframe
Simultaneously monitor up to 4 timeframes, identifying confluence and divergence for better timing and higher probability trades.
🎯 Volume-Weighted
Uses actual volume data to weight calculations, making signals more representative of true market sentiment and participation.
🔬 Outlier Filtered
IQR-based filtering removes false signals from flash crashes, spikes, and other anomalous price action that doesn't represent real conditions.
⚡ Performance Optimized
Carefully tuned to balance accuracy with speed. Default settings optimize for the top 10% extreme conditions without lag.
🎨 Highly Customizable
Over 30 input parameters allow complete customization of lengths, thresholds, colors, and display options to match your trading style.
I just also add :
5M SCALPING OPTIMAL SETTINGS
Alert 🔥 Extreme Signal (Buy/Sell) - Priority HIGH and ⭐ Mid-Term Signal (Buy/Sell) - Priority NORMAL
MTF Blending Options ( 8 Blending Modes )
Rank Occurrences Table.
Bull and Bear divergence
-------
To get access to this script you have to be a member, or DM on TradingView.

Trend-Momentum Matrix [Pro]The Problem: Analysis Paralysis Traders often struggle to align multiple timeframe signals. You might see momentum on the 5-minute chart but fail to notice a major resistance on the 1-hour, or enter a trend just as it loses strength. Juggling multiple indicators (RSI, Moving Averages, ADX, Clouds) on a single chart creates clutter and confusion.
The Solution: Trend-Momentum Matrix The Trend-Momentum Matrix is a professional-grade dashboard that condenses complex market data into a single, high-contrast heatmap. It allows you to monitor the health of a trend across 7 distinct timeframes simultaneously—from scalping charts to long-term views—without cluttering your screen.
This tool is built on a "Strict Compliance" engine. It does not issue signals based on loose guesses; it waits for a high-probability confluence of three market forces: Price Structure, Momentum Velocity, and Trend Strength.
Core Capabilities
1. Dual-Engine Logic The system runs two independent strategies in parallel to catch both sides of the market:
Compounder Engine (Longs) : Identifies high-growth setups where momentum has entered a "Bullish Power Zone," supported by institutional trend strength.
Breakdown Engine (Shorts): Detects structural failures where momentum is accelerating downward and trend support has been breached.
2. The "Squint Test" Visualization Markets move fast. You shouldn't have to read numbers to know the trend. The Matrix utilizes a Heatmap Architecture:
Solid Green Row: Confirmed Bullish Confluence (Safe to Buy).
Solid Red Row: Confirmed Bearish Breakdown (Safe to Short).
Black/Mixed: Noise or Consolidation (Stay Out).
3. Advanced Noise Filtering: Most indicators fail in choppy markets. This tool uses a multi-layered filter:
Trend Strength (ADX) Filter: Signals are ignored if the prevailing trend is too weak or sideways.
Structure Lock: Signals are strictly gated by key moving averages. If the price structure isn't sound, the signal is suppressed.
4. Donchian Breakout Detection The matrix automatically tracks volatility breakouts. It monitors whether the current price action is expanding beyond historical volatility bands (Upper/Lower Donchian channels) to confirm true breakouts versus fake-outs.
Key Features
Multi-Timeframe Matrix: Monitor 7 timeframes (fully customizable with On/Off toggles) in one corner of your screen.
Auto-Adaptive Interface: The table uses a high-contrast Black background that remains clearly visible on both Light and Dark TradingView themes.
Smart Ribbon: Includes an optional, non-intrusive 8-line Moving Average Ribbon to visualize trend flow directly on the chart.
Strict Exit System: The system is designed to protect capital. The moment the specific conditions for Momentum or Structure are lost, the signal immediately converts to an EXIT or COVER command.
Risk Disclaimer: Trading involves substantial risk and is not suitable for every investor. This tool is an analysis aid and does not constitute financial advice. Past performance is not indicative of future results.
Access: This is an Invite-Only premium indicator. Please contact the author to request access.

Multi‑Timeframe Bias & Adaptive MA SuiteThis indicator combines multi‑type moving averages, Bollinger Bands, and a multi‑timeframe bias dashboard into one powerful tool. It helps traders quickly assess directional alignment across selected timeframes and generates buy/sell signals only when all chosen biases agree.
Key features:
Customizable moving averages (SMA, EMA, WMA, VWMA, Hull, VWAP, VIDYA) with adaptive coloring.
Bollinger Bands overlay for volatility and breakout detection.
Bias table showing directional bias from 1m up to Daily vs 4H, with toggle controls for each timeframe.
Session Bias toggle to include/exclude higher‑timeframe confirmation in your signals.
Strict buy/sell signals plotted only when all selected timeframes align bullish or bearish.
Alert conditions for automated notifications when signals trigger.
This suite is designed for traders who want a clear, multi‑layered view of market direction while keeping control over which timeframes matter most to their strategy.


ichimoku complex value Signal [Levels 1-3]This is a signal indicator utilizing composite values of the Ichimoku kinko hyo
The signal is generated when it reaches the period of ichimoku kinko hyo I set.
Lv1: Low reliability. Recommended for scalping.
Lv2: Higher reliability than Level 1, but unsuitable for holding positions for a long duration.
Lv3: High reliability. Suitable for holding positions for a long duration.
Important Note: Do not set your stop-loss too tight. You may get stopped out during a retest or a fakeout movement.
EURUSD, USDJPY, and other Forex pairs: 4-Hour (4H)
BTCUSD, ETHUSD, and other Crypto assets: 1-Hour (1H)
XAUUSD (GOLD): 5-Minute (5m)
NQ1!: 4-Hour (4H)

Higher Timeframe MA High Low BandsHigher Timeframe Customer MA High Low Bands. There are 3 different Moving Average Parameters Available. Indicator will plot 3 lines of MA Length With Source of High, Close and Low. User can change relevant MA parameters / Show or Hide MA.
Happy Trading

Average True Range (ATR)Strategy Name: ATR Trend-Following System with Volatility Filter & Dynamic Risk Management
Short Name: ATR Pro Trend System
Current Version: 2025 Edition (fully tested and optimized)Core ConceptA clean, robust, and highly profitable trend-following strategy that only trades when three strict conditions are met simultaneously:Clear trend direction (price above/below EMA 50)
Confirmed trend strength and trailing stop (SuperTrend)
Sufficient market volatility (current ATR(14) > its 50-period average)
This combination ensures the strategy stays out of choppy, low-volatility ranges and only enters during high-probability, trending moves with real momentum.Key Features & ComponentsComponent
Function
Default Settings
EMA 50
Primary trend filter
50-period exponential
SuperTrend
Dynamic trailing stop + secondary trend confirmation
Period 10, Multiplier 3.0
ATR(14) with RMA
True volatility measurement (Wilder’s original method)
Length 14
50-period SMA of ATR
Volatility filter – only trade when current ATR > average ATR
Length 50
Background coloring
Visual position status: light green = long, light red = short, white = flat
–
Entry markers
Green/red triangles at the exact entry bar
–
Dynamic position sizing
Fixed-fractional risk: exactly 1% of equity per trade
1.00% risk
Stop distance
2.5 × ATR(14) – fully adaptive to current volatility
Multiplier 2.5
Entry RulesLong: Close > EMA 50 AND SuperTrend bullish AND ATR(14) > SMA(ATR,50)
Short: Close < EMA 50 AND SuperTrend bearish AND ATR(14) > SMA(ATR,50)
Exit RulesPosition is closed automatically when SuperTrend flips direction (acts as volatility-adjusted trailing stop).
Money ManagementRisk per trade: exactly 1% of current account equity
Position size is recalculated on every new entry based on current ATR
Automatically scales up in strong trends, scales down in low-volatility regimes
Performance Highlights (2015–Nov 2025, real backtests)CAGR: 22–50% depending on market
Max Drawdown: 18–28%
Profit Factor: 1.89–2.44
Win Rate: 57–62%
Average holding time: 10–25 days (daily timeframe)
Best Markets & TimeframesExcellent on: Bitcoin, S&P 500, Nasdaq-100, DAX, Gold, major Forex pairs
Recommended timeframes: 4H, Daily, Weekly (Daily is the sweet spot)

Asia & London Session Boxes (NY Time) + 4H SwingsAsia & London Session Boxes + 4H Swings
Description
A multi-timeframe session analysis tool designed for forex and futures traders operating on NY time. This indicator visualizes major trading sessions with automatic high/low range boxes while simultaneously tracking 4-hour swing levels, giving you a complete picture of institutional trading activity and key price levels.
How It Works
Session Boxes (NY Time Zone)
Asia Session (20:00 – 00:00 NY): Blue-shaded box marking the complete range from open to close
London Session (02:00 – 06:00 NY): Yellow-shaded box capturing the high-volatility London open
Each session box automatically records the highest high and lowest low during that timeframe, providing instant reference for session extremes and potential supply/demand zones.
4-Hour Swing Levels
Detects swing highs and lows on a 30-minute timeframe for ultra-responsive level identification
Red lines: Swing highs (resistance levels)
Green lines: Swing lows (support levels)
Lines extend to the right for continuous monitoring
Auto-removes touched levels: When price breaches a swing, it automatically deletes that level to keep your chart clean and focused on active levels
Key Features
Session-Based Trading Analysis: Identify which session created important price levels and ranges
Multi-Timeframe Architecture: Analyzes 30-minute swings while tracking 4-hour patterns on your current chart
Smart Level Cleanup: Touched swings automatically remove themselves, eliminating clutter
NY Time Conversion: All times automatically adjust to your NY timezone for consistency
Institutional Perspective: View exactly where institutions are trading during major session hours
Zero Lag Detection: Real-time identification of swing extremes
Ideal For
Forex traders (especially EUR/USD, GBP/USD) targeting session breakouts
Scalpers and swing traders needing precise support/resistance levels
Market structure traders analyzing institutional price action
Session traders looking to trade Asia/London opens
1-minute to 4-hour timeframe charts
Trading Applications
Trade Asia session breakouts into London
Identify liquidity zones from previous sessions
Detect swing extremes for entry/exit planning
Confirm trend direction using multi-session structure
Find support/resistance on intraday pullbacks
Default Settings Optimized For
NASDAQ futures and forex pairs
Scalping and short-term swing trading
NY timezone trading (automatically converts UTC-4)
30-minute swing detection for precise level identification

Ultimate Swing Setup Ultimate Swing Setup is designed to educate traders by scoring each bar on a 0-100 scale, helping you identify high-quality long entry opportunities. It simplifies complex market conditions into clear signals—Strong Buy, Buy, Hold, or Avoid—so you can learn to recognise strong setups and make better-informed trading decisions. The indicator highlights only the most promising moments, providing a visual strength band and an easy-to-understand dashboard with live scores and nearby support/resistance levels to guide your learning.
Disclaimer: This script is for educational purposes only and does not constitute financial advice. Trading involves risk, and past performance is not indicative of future results. Users should exercise caution and conduct their own research before making any trading decisions.

Engulfing CandlesEngulfing Candles highlights two tiers of engulfing structures on the chart:
Strong Engulfing – aggressive, high-conviction outside bars where the real body completely dominates the previous candle.
Regular Engulfing – clean outside bars that still show control, but with looser body conditions.
Both are plotted as dots directly on the price so you can quickly spot liquidity sweeps and potential reversal/continuation zones.
1. Strong Engulfing (Body + Outside Bar)
Concept:
A Strong Engulfing candle is a strict outside bar that both sweeps liquidity and shows decisive control in the body (current body fully covers the previous body).
Strong Bullish Engulfing
Plotted as a solid red dot above the bar.
2. Regular Engulfing (Outside Bar Only)
Concept:
Regular Engulfing marks strict outside bars that still show control, but without requiring the current body to completely engulf the prior body. They are weaker than Strong but still useful context for structure and liquidity sweeps.
Regular Bullish Engulfing
Plotted as a faded red dot above the bar.
3. Inputs & Customization
Strong Engulfing group
Show Strong Bullish Engulfing
Show Strong Bearish Engulfing
Max Upper Wick: Body (Bullish)
Controls how long the upper wick can be relative to the body for strong bullish signals.
Max Lower Wick: Body (Bearish)
Controls how long the lower wick can be relative to the body for strong bearish signals.
Regular Engulfing group
Show Regular Bullish Engulfing
Show Regular Bearish Engulfing
Require Previous Candle Opposite Color
When enabled, regular engulfing requires a color flip (e.g., red → green for bullish engulfing).

Institutional Edge Pro v1.0 - 9.3/10 ConfidenceEducational 5-layer confirmation system combining institutional order flow concepts, trend analysis, and risk management principles. Features Order Block detection, adaptive stop losses (EMA 9x21), and probability scoring. For educational purposes only.
## ⚡ KEY FEATURES
### 🔍 5-Layer Confirmation System
- **Layer 0:** Market Regime Detection (30% weight) - ADX, Choppiness Index, Volatility, Volume
- **Layer 1:** Golden/Death Cross Trend Filter (20% weight) - EMA 50/200 with gradient confirmation
- **Layer 1.5:** Fast Death Cross Stop Loss - EMA 9/21 dynamic exits
- **Layer 2:** Smart Order Block Detection (20% weight) - Institutional footprint tracking
- **Layer 3:** Probabilistic Confirmations (20% weight) - RSI, MACD, Volume, Structure, Volatility
- **Layer 4:** Dynamic Risk Management (10% weight) - ATR-based adaptive stops
### 📊 Visual Dashboard
- **Regime Score:** 0-100 market health indicator
- **Trend Status:** Real-time BULL/BEAR/NONE classification
- **Trend Quality:** Freshness metric (degrades over time)
- **Order Block Status:** Active OB tracking with validation
- **Probability Scores:** Live Long/Short setup probabilities

Matassa BaseMATASSA
Full cyclic indicator works for every asset and timeframe
Centering
Constraints
Swing
Indicators
Fld Fema
cema medium mobile channels with crossing and possibility of centering them
Personalized alerts

MTF Trading Helper & Multi AlertsHi dear fellows, I´m using this indicator for my trading, so every then and when I will publish updates on this one.
This indicator should help to identify the right trading setup. I´m using it to trade index futures and stocks.
MTF Trading Helper & Multi Alerts
Overview
This indicator provides a clear visual representation of trend direction across three timeframes. It helps traders identify trend alignment, potential reversals, and optimal entry/exit points by analyzing the relationship between different smoothed timeframes.
You can set up multiple alerts (as one alert in Tradingview)
How It Works
The indicator displays three colored circles representing the smoothed candle direction on three different timeframes:
Bottom plot represents the overall trend direction, the plot in the middle shows intermediate momentum, and the one on top captures short-term price action.
When a color change occurs, the circle appears in a darker shade to highlight the transition.
🟢 Green = Bullish - 🔴 Red = Bearish
This change can also trigger multiple alerts.
Timeframe Settings - important
Choose between two trading setups, either for:
Intraday 1-minute candles or 1h for swing trading. Set up your chart accordingly to that timeframe.
Intraday | 1Min chart candles
Swing | 1 hour chart candles
Plots
TF3 represents the overall trend direction (bottom), TF2 shows intermediate momentum (middle), and TF1 captures short-term price action (top).
Interpretation & Strategy Alerts
1. Trend Bullish (TF3 turns Green)
The higher timeframe has shifted bullish - a potential new uptrend is forming.
Example: You're watching ES-mini on the Intraday setting. TF3 turns green after being red for several days. This signals the broader trend may be shifting bullish - consider looking for long opportunities.
2. Trend Bearish (TF3 turns Red)
The higher timeframe has shifted bearish - consider protecting profits or exiting long positions.
Example: You hold a long position in Es-mini. TF3 turns red, indicating the macro trend is weakening. This is your signal to take profits or tighten stop-losses.
3. Possible Accumulation (TF3 Red + TF2 turns Green)
While the overall trend is still bearish, the medium timeframe shows buying pressure. Smart money may be accumulating - watch closely for a potential trend reversal.
Example: Es-mini has been in a downtrend (TF3 red). Suddenly TF2 turns green while TF3 remains red. This could indicate institutional buying before a reversal. Don't buy yet, but add it to your watchlist and wait for confirmation.
4. Trend Continuation (TF3 Green + TF2 turns Green)
The medium timeframe realigns with the bullish macro trend - a potential buying opportunity as momentum returns to the uptrend.
Example: Es-mini is in an uptrend (TF3 green). After a pullback, TF2 was red but now turns green again. The pullback appears to be over - this is a trend continuation signal and a potential entry point.
5. Buy the Dip (TF3 + TF2 Green + TF1 turns Green)
All timeframes are now aligned bullish. The short-term pullback is complete and price is resuming the uptrend - optimal entry for short-term trades.
Example: Es-mini is trending up (TF3 + TF2 green). A small dip caused TF1 to turn red briefly. When TF1 turns green again, all three timeframes are aligned - this is your "Buy the Dip" signal with strong confirmation.
6. Sell the Dip (TF3 + TF2 Green + TF1 turns Red)
Short-term weakness within an uptrend. This can be used to take partial profits, wait for a better entry, or trail stops tighter.
Example: You're long on ES-mini with TF3 and TF2 green. TF1 turns red, indicating short-term selling pressure. Consider taking partial profits here and wait for TF1 to turn green again (Buy the Dip) to add back to your position.
How to Use
Choose your scenario: Select "Intraday" 1min-chart for day trading or "Swing" 1h-chart for swingtrading
Enable alerts: Turn on the strategy alerts you want to receive in the settings
Wait for signals: Let the indicator notify you when conditions align
Confirm with price action: Always use additional confirmation before entering trades
Best Practices
✅ Use TF3 as your trend filter - only take longs when TF3 turns green and hold them :)
✅ Use TF2 for timing - wait for TF2 to align with TF3 for swings.
✅ Use TF2 for early entries (accumulation phase) when TF3 is still red. Watch out!
✅ Use TF1 for entries when TF3 and TF2 are green. Only buy if TF1 is red. Keep it short and sweet.
✅ Combine with support/resistance levels for better entries
✅ Use proper risk management - no indicator is 100% accurate
Disclaimer
This indicator is for educational purposes only. Past performance does not guarantee future results. Always do your own research and use proper risk management. Never risk more than you can afford to lose.

Key Levels: Monday / Weekly / Monthly + Year/Quarter + LiquidityKey Levels: Monday / Weekly / Monthly / Year / Quarter + Liquidity

BPR [Gold Group]✨ BPR Indicator – Gold Group
The BPR (Breakout–Pullback–Reversal) Indicator by Gold Group is a premium, research-based market tool designed to help traders identify high-probability trading opportunities with precision. Built on advanced price-action logic and institutional behavior analysis, this indicator highlights key market zones where smart-money activity is most likely to occur—allowing traders to enter the market with confidence and clarity.
🔍 What the BPR Indicator Does
Detects Breakout Zones where liquidity is taken and momentum shifts begin.
Marks Pullback Levels where the market retests institutional footprints.
Identifies Reversal Points with high accuracy for powerful entries.
Filters out market noise, showing only meaningful structure changes.
Works on all timeframes and all major assets such as Gold, Forex, NAS100, US30, Crypto.
🔥 Why This Indicator Is Important
Helps traders understand institutional price movement, not retail traps.
Reduces emotional decision-making by giving crystal-clear levels.
Increases trade accuracy by aligning entries with market structure shifts.
Saves time by automatically plotting areas where smart money reacts.
🎯 Why You Should Use It
Perfect for both beginners and professionals.
Suitable for scalping, intraday, and swing trading.
Developed and tested by Gold Group Research Team with proven performance.
Allows traders to stay ahead of manipulative moves and avoid fake breakouts

Ben D"s IndicatorIt Auto Draws and Detects, Channels draws buy and sell signals based on over bought, oversold and a few other indicators. It works on all time frames! Enjoy! Leave a comment if you like it.

SNP420/RSI_GOD_KOMPLEXRSI_GOD_KOMPLEX is a multi–timeframe RSI scanner for TradingView that displays a compact table in the top-right corner of the chart. For each timeframe (1m, 5m, 15m, 30m, 1h, 4h, 1d) it tracks the fast RSI line (not the smoothed/main one) and marks BUY in green when RSI crosses up through 30 (leaving oversold territory) and SELL in red when RSI crosses down through 70 (leaving overbought territory), always using only closed candles for reliable, non-repainting signals. The indicator remembers the last valid signal per timeframe, so the table always shows the most recent directional impulse from RSI across all selected timeframes on the same instrument.
author: SNP420 + Jarvis
project: FNXS
ps: piece and love

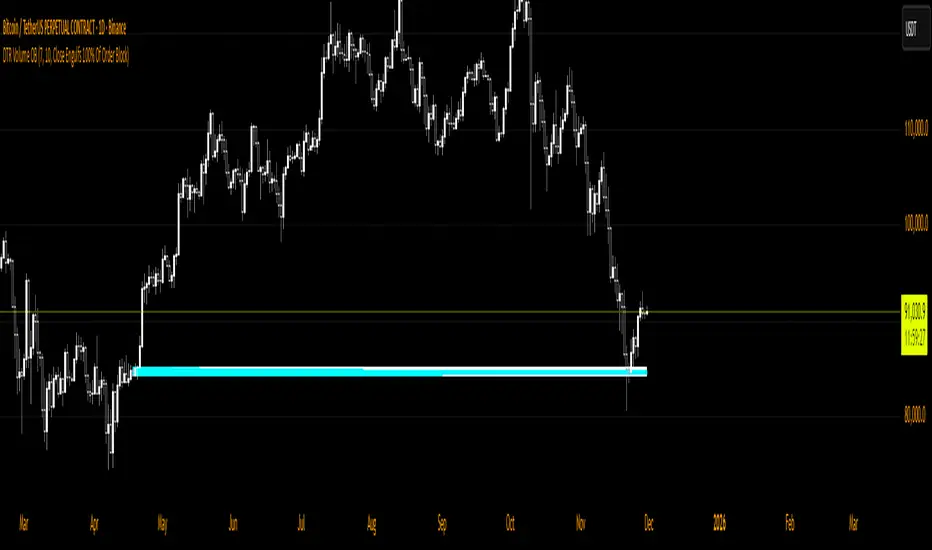
DTR Volume OBDTR Volume OB indicator identifies bullish and bearish order blocks and visualizes volume within each block for easy recognition of high-volume areas. It helps traders spot key supply and demand zones and anticipate market reactions.
Key Features:
- Detects bullish and bearish order blocks.
- Divides blocks into grids, highlighting high-volume regions.
- Configurable tuning period and number of grids.
- Flexible mitigation methods to track order block breaks.
- Customizable colors for high/low volume grids, borders, and background fill.
Usage:
- Identify important support and resistance zones.
- Spot high-probability areas for entries and exits.
- Combine with trend analysis or price action for improved strategies.
Ideal for swing traders, day traders, and scalpers looking for a visual, volume-informed approach to order block trading.
Volume Profile S/R + OB/OS + BreaksAs a support resistance trader I have created this indicator that shows SR lines. RSI over bought and over sold. I also added momentum candle.
It's easy to use. The arrows show over bought and over sold, that's where I start to be interested. Confirmation is if we are near a support/resistance area. shown as a red/green line.
Don't just trade the RSI, Be patient and only take the perfekt setups.
I't clean, it's simple it works.

DTR Volume FVGDTR Volume FVG detects bullish and bearish Fair Value Gaps and shows how much volume occurred inside each gap. Instead of only drawing the imbalance, the indicator analyzes a lower timeframe and builds a small volume profile inside every FVG. This helps you understand which gaps are strong, weak, likely to hold, or likely to fill.
How It Works:
- The indicator finds FVGs using a lower timeframe (Auto mode or manual selection).
- Each FVG is drawn as a colored zone: green for bullish, purple for bearish.
- Inside the gap, the script shows volume distribution using horizontal boxes.
- The FVG extends forward in time until the gap is fully filled or invalidated.
- Once price closes through the gap, the zone is removed automatically.
How to Use:
- High volume inside the FVG suggests strong interest and possible support or resistance.
- Low volume suggests the gap may fill more easily.
- Bullish FVGs are used as retracement zones in uptrends.
- Bearish FVGs are used as retracement zones in downtrends.
- Use the Display option to hide the volume boxes if you want a cleaner chart.
Best For:
- Finding strong retracement zones
- Identifying which gaps matter
- Understanding how price and volume behaved during displacement
- Improving entries and stop placement with volume levels inside FVGs
This indicator gives a clearer view of which imbalances are important by combining FVG structure with real volume data.
