Warpath Structure + Liquidity Tool (Updated - V3)Warpath visually organizes the key elements required to trade Gold professionally:
1. Market Structure Clarity
Automatically labels HH / HL / LH / LL on major pivot points (current chart timeframe). Makes directional bias immediately obvious. Helps prevent counter-trend trading in strong expansions.
2. Liquidity Sweep Detection (Wick-Only)
Highlights true liquidity sweeps using wick behavior (no breakout guessing). Marks the sweep wick with user-defined colors. Draws a swept-zone box that extends forward to show where liquidity was taken. Designed to identify fuel vs reversal behavior in trends.
3. Key Session Levels
Automatically plots:
Asian High / Low
Previous Day High / Low
Equal Highs / Equal Lows from current timeframe and higher timeframes (1H / 4H / Daily)
These levels represent where price is likely to react, not where trades should be forced.
4. Multi-Confluence HTF Bias Dashboard
Small dashboard showing bias for 15M, 1H, 4H, and Daily timeframes. Each timeframe bias is calculated using four confluence factors:
EMA Stack: 8/21/50 alignment and price position relative to EMAs
Structure: Recent HH/HL vs LH/LL pivot behavior
Price Patterns: Engulfing candles, hammers, double bottoms/tops, break of structure
Momentum: Recent candle direction and close trend
Displays a confluence score (e.g., "BULLS (4)") so you can see signal strength, not just direction. Overall bias weights higher timeframes more heavily for smarter alignment.
5. Trade Positioning Dashboard
Replaces basic overbought/oversold readings with actionable positioning context:
Range Position: Shows exactly where price sits within the selected range (Previous Session, Previous Day, or Weekly) as a percentage. Zones include Deep Discount (0-25%), Discount (25-40%), Equilibrium (40-60%), Premium (60-75%), and Deep Premium (75-100%).
VWAP Deviation: Displays distance from VWAP in standard deviations (σ). Readings beyond ±1.5σ indicate meaningful extension. Readings beyond ±2σ suggest caution on continuation and potential mean reversion.
Trade Favor: Combines HTF bias alignment, range position, and VWAP deviation into a single directional score. Displays as "LONGS ●●●○" or "SHORTS ●●○○" so you know at a glance whether conditions favor continuation or reversal.
6. Continuation Reload Awareness (Strong Trend Environments)
Built to handle markets that:
Remain overbought
Stay in premium
Sweep buy-side liquidity repeatedly
The multi-confluence scoring system catches trend continuation setups (like higher lows forming with bullish momentum) even before swing structure fully confirms. Supports compression → expansion continuation behavior. Prevents missed participation during multi-day trends without abandoning discipline.
Multitimeframe

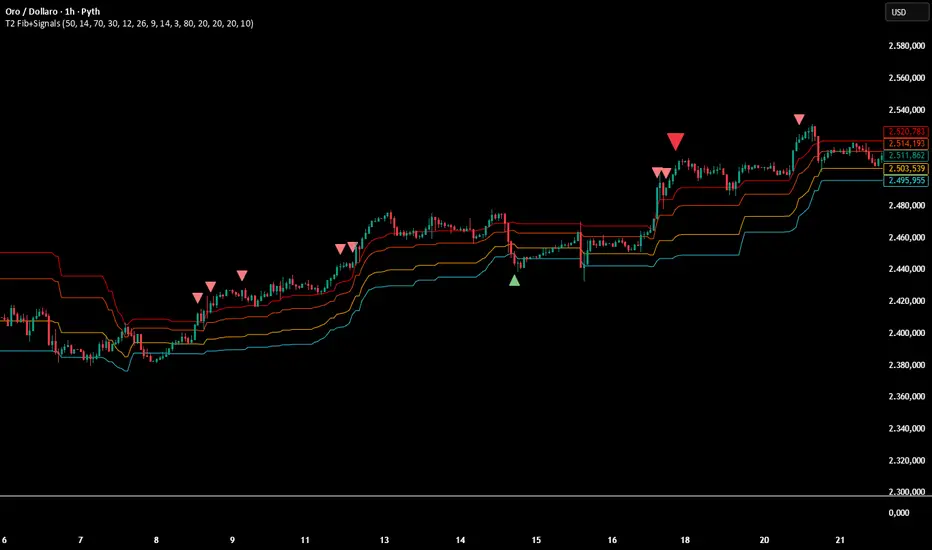
Multi-Confirmation Fib Zones This indicator combines **dynamic Fibonacci-style price zones** with a **multi-signal confirmation layer** to highlight areas where reactions are more likely to matter.
Core purpose
* Map out **contextual price areas** derived from recent market ranges.
* Provide a structured way to read potential **reaction / continuation zones** without relying on a single input.
Zone framework
* The tool continuously tracks the market’s recent extremes and builds **adaptive reference zones** around them.
* It can display both **bullish-context** and **bearish-context** zones, depending on the current market behavior.
Confirmation layer (confluence concept)
Instead of treating any zone touch as a signal, it evaluates **multiple market perspectives**, such as:
* momentum pressure,
* momentum shifts,
* short-term oscillation balance,
* participation / activity confirmation.
Signals are intended to be interpreted only when **several views align**, helping reduce false positives.
Practical use
* Useful for traders who want **structured levels + confirmation** in one visual workflow.
* Can support both **trend continuation** and **reaction-based setups**, depending on broader context.
* Best treated as a **decision support system** (a “dashboard”), not a standalone trade trigger.
Best conditions
* Works best when markets are **respecting ranges and reacting at obvious areas**.
* In extremely noisy, thin, or news-driven spikes, confirmations may desync and require more discretion.
*For educational and analytical purposes only. Always validate across different instruments and timeframes.*
MP SESSIONS, DST, OTTHere’s a clear description you can use for this script (for yourself or as a TradingView “Indicator Description”):
---
### MP SESSIONS, DST, OTT – What this indicator does
This script is a **multi-session market timing tool** that:
1. **Draws full trading sessions on the chart** (Asia, Sydney, Tokyo, Shanghai, Europe, London, New York, NYSE)
2. **Automatically adjusts for Daylight Saving Time (DST)** for Sydney, London, and New York
3. **Shows a live info table** with session times, DST status, and whether each session is currently open or closed
4. **Adds optional custom “OTT” vertical lines** at user-defined intraday times (for your own models, killzones, or time blocks)
---
### Main Features (high level)
#### 1. Market mode & time zone handling
* **Market Mode**:
* `Forex`
* `Stock`
* `User Custom` (you type your own session ranges)
* `TFlab suggestion` (predefined “optimized” session times)
* **Time Zone Mode**:
* `UTC`
* `Session Local Time` (local exchange time: Sydney, Tokyo, London, New York etc.)
* `Your Time Zone` (converts to the user-selected TZ, e.g. `UTC-4:00`)
* Handles separate time zones for:
* Asia, Sydney, Tokyo, Shanghai, Europe, London, New York, NYSE
* Has logic to **recalculate session start/end depending on DST** and the chosen mode.
---
#### 2. Daylight Saving Time (DST) engine
The function `DST_Detector`:
* Calculates when DST **starts and ends** for:
* `Australia/Sydney`
* `Europe/London`
* `America/New_York`
* Detects the correct Sunday (2nd, 4th, etc.) for start/end using day-of-week and week counts.
* Returns `'Active'` or `'Inactive'` for each region.
* These values are then used to **shift the sessions** (e.g. New York 13:00–21:00 vs 12:00–20:00 in UTC).
The script can also **draw vertical lines** on the chart when DST starts/ends and label them:
* “Sydney DST Started / Ended”
* “London DST Started / Ended”
* “New York DST Started / Ended”
---
#### 3. Session timing & sessions on the chart
The function `Market_TimeZone_Calculator`:
* Based on **Market Mode** + **Time Zone Mode** + **DST state**, it returns:
* Time ranges for: Sydney, Tokyo, Shanghai, Asia (combined), Europe, London, New York, NYSE
* These ranges are in `"HHMM-HHMM"` format.
Then the script:
* Converts these to `time()` conditions using the proper time zone
* Creates boolean series like `On_sesAsia`, `On_sesEurope`, `On_sesNewYork`, etc., which are **1 when the session is open and 0 when closed**.
---
#### 4. Session high/low boxes & labels
The function `LowHighSessionDetector`:
* Tracks **high and low of each session** while it’s active.
* When a new session starts:
* Resets and starts recording the session high/low.
* While session is active:
* Updates `High` with the max of current bar high and previous session high.
* Updates `Low` with the min of current bar low and previous session low.
* When the session is "on":
* Draws a **box** from session low to high (`box.new`) and extends it to the right as long as the session continues.
* Places a **label with session name** (Asia, London, New York, etc.) near the high:
* Style depends on the session (down/right/left).
You have visibility toggles per session:
* `Asia Session`, `Sydney Session`, `Tokyo Session`, `Shanghai Session`, `Europe Session`, `London Session`, `New York Session`, `NYSE` (for TFlab mode).
So you visually see:
* A shaded box for each session
* The full H/L range for that session
* A text label with the session name.
---
#### 5. Info table
The indicator builds a **table in a corner of the chart** showing:
* Header:
* “FOREX Session”, “Stock Market Trading Hours”, “User Custom Session”, or “TFlab suggestion” depending on mode.
* Columns:
1. Session name (Asia, Sydney, Tokyo, Shanghai, Europe, London, New York, NYSE)
2. DST status for that region (“Active 🌞 / Inactive 🍂 / Not Observed”)
3. Session **start time**
4. Session **end time**
5. Current **status** (“Open / Closed”, with green/red background)
The function `SplitFunction`:
* Parses the `"HHMM-HHMM"` strings for each session.
* Converts them into:
* Either raw times (if viewing in UTC/session local)
* Or converted times in **Your Time Zone** using `timestamp` and `hour/ minute` with `YourTZ`.
* Returns formatted `Start` and `End` strings like `9:30`, `13:00`, etc.
So the table is effectively a **live session schedule** that:
* Auto-adjusts to DST
* Can show times in your own time zone
* Shows which session is open right now.
---
#### 6. OTT vertical lines (custom intraday markers)
At the bottom, there is an **OTT section** which lets you draw up to **three sets of vertical lines** at specific times:
* Each OTT block has:
* Enable toggle (`Enable OTT 1/2/3`)
* Start hour & minute
* End hour & minute
* Color
* Global OTT settings:
* Line style: `Solid / Dashed / Dotted`
* Line width
* Toggle: “Show OTT Labels?”
Logic:
* `is_ott_time()` checks if current bar’s `hour` and `minute` match the OTT input time.
* `draw_ott()`:
* When the bar time matches, draws a **vertical line** through the candle from low to high (`extend.both`).
* Optionally adds a label above the bar, like `"OTT1 Start"`, `"OTT1 End"`, etc.
Use cases:
* Marking **open/close of your trading session**
* Defining **killzones**, news times, or custom model windows
* Visual anchors for your intraday routine (NY open, 10 AM candle, etc.)
---
### TL;DR
This indicator is a **session toolkit + DST engine + time markers**:
* **Visually paints the main global sessions** with boxes and labels.
* **Handles DST automatically** for Sydney, London, New York.
* **Shows a live table** with session times, DST status, and open/closed status in your time zone.
* **Adds up to three configurable vertical time markers (OTT)** for custom session windows or key times.
If you want, I can also write a **short version** (2–3 sentences) for the TradingView “Description” field.

Multi-TF EMA Alignment - Safe 3/4 Above EMA50 + ATR Pullbackthis script only triggers when your context, Validation, and entry time frames EMA's align for long positions

MASTER ENGINE v6
MASTER ENGINE v6 is a multi-timeframe decision engine that shows direction, alignment quality, risk conditions, and a realistic target zone — without forcing trades.
What it actually does (short version)
Finds the dominant direction using multiple timeframes
Weights higher timeframes more heavily so noise can’t override structure
Grades trade quality (A–D) so you know when conditions are strong or marginal
Checks timing alignment so you’re not trading against momentum
Flags stretched or reversal-risk conditions early and clearly
Shows a conservative ATR-based target zone, scaled by trade quality
Everything is filtered through risk first, not opportunity first.
How to read it (at a glance)
DIR / ALIGNMENT → market bias and confidence
GRADE → trade quality, not probability
PLUS1 / NOW → timing agreement
TRADE → ON, CAREFUL, or stand aside
WHY → the single most important reason
TARGET ZONE → potential distance, not a promise
What it is not
❌ Not an entry signal
❌ Not a take-profit system
❌ Not predictive
❌ Not automated
In short
MASTER ENGINE v6 acts like a calm, experienced trader sitting next to you, saying:
“Direction is clear.”
“Timing is okay… but be careful.”
“Market’s stretched — don’t force it.”
“This is a reasonable zone, not a guaranteed target.”
You still make the final decision.

X-trend Liquidation Heatmap 🔥 X-TREND Liquidation Heatmap: Market Fuel Visualization
Stop trading blindly. X-Trend Liquidation Heatmap is an institutional-grade analytical tool designed to reveal what remains hidden from most retail traders: where the crowd's money is located.
The market always moves from liquidity to liquidity. This script transforms your chart into a professional heatmap, highlighting the specific price zones where stop-losses and liquidation levels of leveraged traders (10x, 25x, 50x, 100x) are concentrated. These are not just support and resistance lines—they are magnets for price action.
💎 WHAT YOU SEE ON THE CHART:
🟣 Liquidity Gradient Heatmap: Our unique algorithm visualizes the "density" of resting orders.
Faint Zones: Liquidation levels of low leverage positions (10x-25x).
Bright Neon Zones: Dense clusters of high leverage liquidations (50x-100x). Price often spikes through these zones to "sweep" the liquidity.
🟡 Gold Zones (Tested Liquidity): Areas of maximum interest that price has touched but not broken. These represent critical defense levels protected by market makers.
📊 Market Pressure Dashboard: A built-in panel analyzes Buyer/Seller pressure across all timeframes (LTF, MTF, HTF) + BTC Correlation. You get a clear numerical view of market sentiment (e.g., "Total 92% Long Pressure").
HOW TO USE IT? Stop placing your stop-losses where everyone else does. Use these zones as targets for Take Profit (exit into the crowd's liquidity) or look for reversal patterns when price "sweeps" a bright zone.
🚀 Perfect Synergy: Use the Heatmap to define your TARGETS, and use X-Trend Reversal (PRO) to pinpoint the exact ENTRY.
🔒 HOW TO GET ACCESS (INVITE-ONLY)
This script is a closed-source proprietary tool. Access is granted exclusively through our official channels.
⛔ NOTE: We do NOT respond to access requests in the comment section below. Please use the links above for instant support and license activation.

MTF FVG 3-candleMTF FVG 3-candle is an indicator that detects Fair Value Gaps using a 3-candle pattern on the timeframe selected in the settings. It projects FVG zones onto lower timeframes, tracks the first touch and full fill of each zone, and provides alerts.

Reversal Strength with Momentum Ratings on 4hr charts Here's a quick breakdown of what you'll see on your chart and how to actually use the indicator!
Reversal Labels:
↑ = Bullish reversal (price reversing upward)
↓ = Bearish reversal (price reversing downward)
STRONG (bright green/red) = High-confidence reversal (score > 65)
weak (faded green/red) = Low-confidence reversal (score ≤ 65)
Number on label = Reversal strength score (0-100)
Momentum Table (Top Right):
Overall Score (0-100) = Total momentum strength
Green (80+) = Very strong momentum
Yellow (40-60) = Moderate momentum
Orange/Red (<40) = Weak/stalling momentum
Individual Momentum Scores (each worth 0-20 points):
Volume = How much trading activity vs average
Price ROC = How fast price is moving (rate of change)
MA Spacing = How spread out the moving averages are (trend strength)
ADX = Directional movement indicator (trend conviction)
RSI Mom. = How far RSI is from neutral 50 (momentum extreme)
Status Indicators:
🔥 STRONG = Momentum > 70 (strong move happening)
📈 BUILDING = Momentum 50-70 (gaining strength)
⚠️ WEAK = Momentum 30-50 (losing steam)
💤 STALLING = Momentum < 30 (very weak/choppy)
Background Tint:
Light green background = Strong momentum (>70)
Light red background = Very weak momentum (<30)
The key is: look for STRONG reversal labels when momentum is building/strong for the best trade setups! Also this is mainly for the 4hr time frame.

MTF Fractal LevelsMTF Fractal Levels is a fractal-based indicator designed to highlight key price levels and provide timely alerts when price reaches those levels.
The indicator can display fractals from the current timeframe as well as from a higher timeframe selected in the settings.
When a higher timeframe is selected, its fractal levels are correctly projected onto all lower timeframes, allowing higher-timeframe levels to be used as context for entries on lower timeframes.
The Fractal Strength parameter allows filtering of fractal formation by controlling how significant a price extremum must be to be considered a valid fractal.
Levels are displayed as horizontal zones/lines with flexible visual style settings.
The indicator supports intra bar alerts that trigger at the exact moment price touches a fractal level, without waiting for the candle to close.

Vertical Time LinesVertical Time Lines is an indicator that draws vertical lines at specific times of each day on the price chart.
⚙️ Main Features
Up to 5 independent time lines
Precise hour and minute editing (HH:MM)
Individual enable/disable option per line
Customizable line color and style
Works on any asset and any timeframe
📝 Note
Due to Pine Script limitations, the lines are drawn using UTC time, not the time zone configured on the chart.
Lines are generated only when a candle exists exactly at the configured minute. If candles for the specified hours and minutes are not visible on the chart, the lines will not be displayed.

Multi-Timeframe Moving Averages (10 lines)Allows you to put up to 10 moving average lines on a chart and view on any timeframe.
Completely customisable:
SMA or EMA
Daily, Weekly or Current
Line Colour
Line Thickness
Line Visibility
MA Label Visibility
Defaults to line smoothing so daily and weekly appear smooth on lower timeframes. You can switch this to actual, where the MA will be 'stepped'.
Labels appear to the right of the MA end-point describing the MA, so it's easy to understand which line is which when multiple are added to the chart.
Common SMAs and EMAs are pre-populated for convenience.

Swing Elite Supply & Demand MTFSwing Elite Supply & Demand MTF
This indicator automates Supply & Demand zone detection using the classic base-candle pattern methodology, enhanced with multi-timeframe confluence and zone strength classification.
How Zones Are Detected
The algorithm identifies zones by scanning for the Leg-Base-Leg structure that defines institutional order flow areas. A valid zone requires three components: an initial directional candle (the "leg in"), one or more consolidation candles forming the base, and an explosive breakout candle (the "leg out") that confirms institutional participation.
Base candles are identified using a body-to-range ratio threshold — candles where the body occupies less than 55% of the total range qualify as indecision/accumulation. The explosive candle must have a body ratio exceeding 50% and must close beyond the base boundaries, confirming genuine breakout rather than false signals.
Zone boundaries are drawn from the base candles, with two width options: "Preferred" uses the candle bodies for tighter zones, while "Wider" extends to the full wick range for more conservative entries.
Pattern Classification
Zones are labeled by their formation pattern. RBR (Rally-Base-Rally) and DBR (Drop-Base-Rally) indicate demand zones, while DBD (Drop-Base-Drop) and RBD (Rally-Base-Drop) mark supply zones. This classification helps traders understand the preceding price action context.
Level on Level (LOL) Strength
When a new zone forms that overlaps an existing zone of the same type by a configurable percentage, the zones merge into a "Level on Level" formation. These stacked zones represent areas where institutional orders have accumulated multiple times, suggesting stronger support or resistance. LOL zones use stricter mitigation rules — they're only removed when price closes through them entirely, rather than the standard percentage penetration.
FLIP Level Detection
The indicator tracks swing highs and lows using pivot detection. When price breaks a significant swing level and subsequently forms a zone that encompasses that broken level, it's marked as a "FLIP" zone. These represent potential support-turned-resistance or resistance-turned-support areas — a key concept in price action trading.
Big Brother Multi-Timeframe Confluence
The "Big Brother" feature detects zones on a higher timeframe and checks whether current-timeframe zones fall within them. Zones with higher-timeframe coverage are labeled with "BB" and the confirming timeframe. This helps traders prioritize zones that align with larger structural levels. The higher timeframe auto-selects based on the zone timeframe (e.g., 15m zones check against 4H, daily zones check against weekly).
Zone Management
Zones are automatically removed when mitigated. Standard zones use percentage-based mitigation (default 25% penetration), while LOL zones require a full close beyond the zone. Additionally, zones that have been touched but see price move beyond a configurable R-multiple distance are removed, preventing stale zones from cluttering the chart.
Gap Finder
The indicator also identifies unfilled price gaps — areas where consecutive candles don't overlap. These gaps often act as magnets for price and can provide additional confluence when aligned with supply or demand zones.
Practical Application
This tool is designed for traders who use Supply & Demand methodology but want objective, consistent zone identification. The strength classification (standard, LOL, FLIP, BB confluence) helps prioritize which zones deserve attention. The built-in stop loss calculation provides a starting point for risk management based on zone dimensions.

Swing elite Trend DirectionSwing Elite Trend Direction
This indicator provides a structured approach to market analysis by combining swing point detection with trend confirmation logic derived from Smart Money Concepts (SMC).
How It Works
The core algorithm identifies swing highs and lows using a configurable lookback depth, then classifies each pivot based on its relationship to prior swings. A swing high that exceeds the previous swing high is labeled HH (Higher High), while one that fails to do so becomes LH (Lower High). The same logic applies to lows, producing HL (Higher Low) and LL (Lower Low) classifications.
Trend confirmation follows ICT/SMC principles: a bullish trend is confirmed only when a Higher Low is followed by a Higher High, establishing the classic bullish market structure sequence. Conversely, bearish confirmation requires a Lower High followed by a Lower Low. When price creates a counter-structure pivot (such as a Lower High appearing during a bullish sequence), the trend status shifts to "Unconfirmed," alerting traders to potential reversals before they fully develop.
What Makes This Indicator Useful
Rather than displaying isolated swing points, this indicator synthesizes the relationship between consecutive pivots to provide actionable trend status. The multi-timeframe dashboard extends this analysis across three user-defined timeframes, allowing traders to assess trend alignment — a key filter for higher-probability setups.
Structure trendlines automatically connect relevant pivot sequences (HH→LH for resistance, LL→HL for support), visualizing the trajectory of market structure rather than arbitrary price connections. Break levels mark the specific prices where structure would shift, giving clear invalidation points for trade management.
The Fibonacci retracement draws automatically between the two most recent pivots, providing potential entry zones within the established structure context.
Intended Use
This tool is designed for traders who use market structure analysis as their primary framework. It automates the manual process of labeling swing points and tracking structure sequences, reducing subjectivity while maintaining the discretionary trader's analytical approach. Works across all markets and timeframes.
Swing elite Trend direction
A comprehensive market structure indicator that identifies swing highs/lows, labels them with HH/HL/LH/LL structure, draws dynamic trendlines, and provides multi-timeframe trend analysis.
🔹 FEATURES
Market Structure Analysis
Automatically detects swing highs and swing lows
Labels each pivot with its structure type: HH (Higher High), HL (Higher Low), LH (Lower High), LL (Lower Low)
Color-coded zigzag lines based on confirmed trend direction
Structure Trendlines
Downtrend Line: Connects HH to LH (resistance in bearish structure)
Uptrend Line: Connects LL to HL (support in bullish structure)
Extended projection for potential future price interaction
Swing Trendlines
Connects the last 2 swing highs (resistance trendline)
Connects the last 2 swing lows (support trendline)
Optional extension to project future levels
Break Levels
Horizontal lines at key structure points (HH, HL, LL, LH)
Visual reference for potential breakout/breakdown levels
Customizable colors for bullish and bearish breaks
Fibonacci Retracement
Auto-drawn between the last two pivots
Customizable levels: 0, 0.236, 0.382, 0.5, 0.618, 0.786, 1.0
Individual toggle and color settings for each level
Multi-Timeframe Dashboard
Displays trend status across 3 customizable timeframes
Shows trend direction: Bullish / Bearish / Neutral
Shows confirmation status: Confirmed / Unconfirmed
Color-coded for quick visual analysis
Trend Confirmation Logic (ICT/SMC Concepts)
Bullish Confirmed: HL followed by HH (Higher Low → Higher High pattern)
Bearish Confirmed: LH followed by LL (Lower High → Lower Low pattern)
Unconfirmed: Counter-structure appears (potential reversal signal)
🔹 SETTINGS
Swing Settings
Depth: Lookback period for pivot detection
Display
Toggle zigzag lines, labels, price on labels
Adjust label size and number of visible swings
Zigzag Settings
Line style: Solid, Dashed, Dotted
Thickness and colors for bullish/bearish trends
Swing Trendlines
Toggle high/low trendlines independently
Customizable colors, style, thickness
Option to extend trendlines
Structure Trendlines
Toggle HH→LH and LL→HL lines independently
Customizable colors, style, thickness
Option to extend trendlines
Break Levels
Toggle HH, HL, LL, LH break levels independently
Customizable colors for each level
Fibonacci
Toggle individual fib levels
Customizable colors and line style
Dashboard
Position: Top Left, Top Right, Bottom Left, Bottom Right
Size: Tiny, Small, Normal, Large
3 customizable timeframes
🔹 ALERTS
HH Broken: Price breaks above recent Higher High
HL Broken: Price breaks below recent Higher Low
LL Broken: Price breaks below recent Lower Low
LH Broken: Price breaks above recent Lower High
🔹 USE CASES
✅ Identify market structure and trend direction
✅ Spot potential trend reversals (unconfirmed status)
✅ Find key support/resistance levels
✅ Multi-timeframe trend alignment for trade confirmation
✅ Breakout/breakdown trading with break levels
✅ Fibonacci retracement entries
3 hours ago
Release Notes
Swing elite Trend direction
A comprehensive market structure indicator that identifies swing highs/lows, labels them with HH/HL/LH/LL structure, draws dynamic trendlines, and provides multi-timeframe trend analysis.
🔹 FEATURES
Market Structure Analysis
Automatically detects swing highs and swing lows
Labels each pivot with its structure type: HH (Higher High), HL (Higher Low), LH (Lower High), LL (Lower Low)
Color-coded zigzag lines based on confirmed trend direction
Structure Trendlines
Downtrend Line: Connects HH to LH (resistance in bearish structure)
Uptrend Line: Connects LL to HL (support in bullish structure)
Extended projection for potential future price interaction
Swing Trendlines
Connects the last 2 swing highs (resistance trendline)
Connects the last 2 swing lows (support trendline)
Optional extension to project future levels
Break Levels
Horizontal lines at key structure points (HH, HL, LL, LH)
Visual reference for potential breakout/breakdown levels
Customizable colors for bullish and bearish breaks
Fibonacci Retracement
Auto-drawn between the last two pivots
Customizable levels: 0, 0.236, 0.382, 0.5, 0.618, 0.786, 1.0
Individual toggle and color settings for each level
Multi-Timeframe Dashboard
Displays trend status across 3 customizable timeframes
Shows trend direction: Bullish / Bearish / Neutral
Shows confirmation status: Confirmed / Unconfirmed
Color-coded for quick visual analysis
Trend Confirmation Logic (ICT/SMC Concepts)
Bullish Confirmed: HL followed by HH (Higher Low → Higher High pattern)
Bearish Confirmed: LH followed by LL (Lower High → Lower Low pattern)
Unconfirmed: Counter-structure appears (potential reversal signal)
🔹 SETTINGS
Swing Settings
Depth: Lookback period for pivot detection
Display
Toggle zigzag lines, labels, price on labels
Adjust label size and number of visible swings
Zigzag Settings
Line style: Solid, Dashed, Dotted
Thickness and colors for bullish/bearish trends
Swing Trendlines
Toggle high/low trendlines independently
Customizable colors, style, thickness
Option to extend trendlines
Structure Trendlines
Toggle HH→LH and LL→HL lines independently
Customizable colors, style, thickness
Option to extend trendlines
Break Levels
Toggle HH, HL, LL, LH break levels independently
Customizable colors for each level
Fibonacci
Toggle individual fib levels
Customizable colors and line style
Dashboard
Position: Top Left, Top Right, Bottom Left, Bottom Right
Size: Tiny, Small, Normal, Large
3 customizable timeframes
🔹 ALERTS
HH Broken: Price breaks above recent Higher High
HL Broken: Price breaks below recent Higher Low
LL Broken: Price breaks below recent Lower Low
LH Broken: Price breaks above recent Lower High
🔹 USE CASES
✅ Identify market structure and trend direction
✅ Spot potential trend reversals (unconfirmed status)
✅ Find key support/resistance levels
✅ Multi-timeframe trend alignment for trade confirmation
✅ Breakout/breakdown trading with break levels
✅ Fibonacci retracement entries

Swing elite MTF Momentum Confluence📊 MTF Momentum Confluence Strategy
Overview
The MTF Momentum Confluence Strategy identifies high-probability trade setups by analyzing momentum alignment across multiple timeframes. When momentum agrees across 4 different timeframes, the probability of a successful trade increases significantly.
The core principle is simple: trade in the direction where all timeframes agree.

APS - Sweeps & BOSThis indicator identifies pivot highs and lows, detects liquidity sweeps, and marks Break of Structure (BOS).
Key Features:
1) Pivot Detection :
The script uses configurable left and right bar parameters to identify significant pivot highs and lows, marking them with "X" labels on the chart. These pivots represent potential areas where price may react.
2) Sweep Detection :
A sweep occurs when price temporarily moves beyond a previous pivot level but closes back inside, suggesting a liquidity grab or stop hunt. The indicator draws horizontal lines connecting the original pivot to the sweep location and labels these events. Sweeps often precede reversals as they collect liquidity before moving in the opposite direction.
3) Break of Structure (BOS) :
BOS events are marked when price closes beyond a previous pivot level, indicating a potential shift in market structure. Bullish BOS occurs when price closes above a pivot high, while Bearish BOS occurs when price closes below a pivot low. These can signal continuation moves or trend changes.
4) Previous Day High/Low (PDH/PDL):
The indicator tracks the previous session's high and low (based on 6 PM ET session breaks, which auto-adjusts for DST) and displays whether these levels have been breached. It also calculates and displays a 50% equilibrium line between PDH and PDL.
5) Higher Timeframe Context :
A table in the top-right corner shows whether the higher timeframe close is in premium (above equilibrium) or discount (below equilibrium) territory. The HTF automatically adjusts based on your current timeframe.
6) Customization Options:
Adjustable pivot sensitivity (left/right bars)
Configurable sweep lookback period
Customizable colors, line styles, and label sizes for all elements
Toggle visibility for any component
Optional alerts for sweeps and BOS events
How to Use:
Sweeps near support/resistance often indicate liquidity grabs before reversals
BOS events can confirm directional bias changes
Use PDH/PDL levels as reference points for intraday trading
Consider HTF context when taking trades (discount zones for longs, premium zones for shorts)
Important Notes:
This indicator is designed for educational purposes and market analysis. Past patterns do not guarantee future results. Please follow proper risk management.

FxNeel SessionAll types of ICT session you can draw here. Like Asia, London, NY, New Close, CBDR, Asia Kill zone and also Silverbullet Time zone.


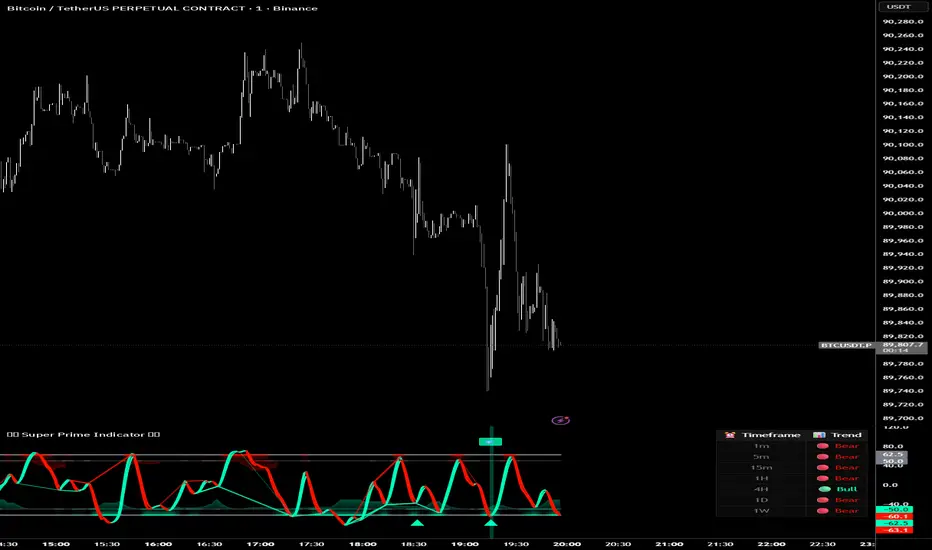
Super Prime Indicator [TraderCloud]⭐🧠 Super Prime Indicator 🧠⭐
ML-Enhanced SMI + Whale Hunter Pro
Super Prime Indicator is an advanced, all-in-one market intelligence tool that combines machine-learning-enhanced SMI, Whale Hunter Pro logic, multi-timeframe trend analysis, and probabilistic market modeling into a single, highly visual oscillator.
Designed for professional crypto traders, this indicator focuses on identifying institutional activity, high-probability reversals, and trend continuation zones with precision.
🔹 Core Components
🧠 Machine Learning SMI (KNN-Enhanced)
Traditional SMI upgraded with K-Nearest Neighbors (KNN) learning
Adaptive overbought / oversold levels based on historical behavior
Feature-based distance analysis (momentum, volatility, slope, etc.)
Optional Kalman, Double EMA, or ALMA filtering
🐋 Whale Hunter Pro System
RSI divergence detection across multiple pivot scales
KDE (Kernel Density Estimation) probability modeling
Institutional bias detection using Open Interest (OI) and CVD filters
Strict / Moderate / Aggressive signal modes
Whale buy/sell zones with visual background highlights
📊 Multi-Timeframe Trend Dashboard
Real-time trend alignment across
1m / 5m / 15m / 1H / 4H / 1D / 1W
Clear bullish / bearish status table for top-down analysis
📈 Advanced Divergence Engine
Regular & hidden divergence detection
Short, medium, and long-term pivot sets
Dynamic divergence line plotting with strength-based visuals
📐 Bayesian Probability Model
Probabilistic market direction estimation
Uses Bollinger Bands & SMA state sequences
Normalized directional probability output for risk assessment
🎯 Trading Use Cases
Identify smart money accumulation & distribution
Spot high-probability reversals before price confirmation
Confirm trend continuation with multi-TF alignment
Filter false signals using OI & CVD confirmation
Combine momentum, structure, and probability in one view
🎨 Visual & UX Features
Neon / color-blind friendly palettes
Gradient-based momentum zones
Clean oscillator design with minimal chart clutter
Whale emoji signals for instant recognition
Forexsebi - DAX Future Psychological Levels - TrendflowTrendflow is an advanced TradingView indicator combining psychological price levels with trend and multi-timeframe analysis.
The indicator automatically plots psychological levels in around the current price. Each level is visualized using horizontal lines and price zones (boxes) to clearly highlight potential support and resistance areas.
Psychological Levels – Trendflow ist ein fortschrittlicher TradingView-Indikator , der wichtige psychologische Preislevel mit einer klaren Trend- und Multi-Timeframe-Analyse kombiniert.
Trend Analysis with SMAs
SMA 50 & SMA 200 plotted directly on the chart
Individually toggleable
Clear color separation for fast trend recognition
Multi-Timeframe SMA Trend Table
Trend status (BULLISH / BEARISH / NEUTRAL) across:
5M, 15M, 1H, 4H, 1D
Logic: Price relative to SMA 50 & SMA 200
Color-coded, easy-to-read table
Info Box
Current Gold price
Nearest psychological level above and below price
Alert System
Alerts when price approaches a psychological level
User-defined alert distance

Forexsebi - GBPJPY Psychological Levels - TrendflowTrendflow is an advanced TradingView indicator combining psychological price levels with trend and multi-timeframe analysis.
The indicator automatically plots psychological levels in around the current price. Each level is visualized using horizontal lines and price zones (boxes) to clearly highlight potential support and resistance areas.
Psychological Levels – Trendflow ist ein fortschrittlicher TradingView-Indikator , der wichtige psychologische Preislevel mit einer klaren Trend- und Multi-Timeframe-Analyse kombiniert.
Trend Analysis with SMAs
SMA 50 & SMA 200 plotted directly on the chart
Individually toggleable
Clear color separation for fast trend recognition
Multi-Timeframe SMA Trend Table
Trend status (BULLISH / BEARISH / NEUTRAL) across:
5M, 15M, 1H, 4H, 1D
Logic: Price relative to SMA 50 & SMA 200
Color-coded, easy-to-read table
Info Box
Current Gold price
Nearest psychological level above and below price
Alert System
Alerts when price approaches a psychological level
User-defined alert distance

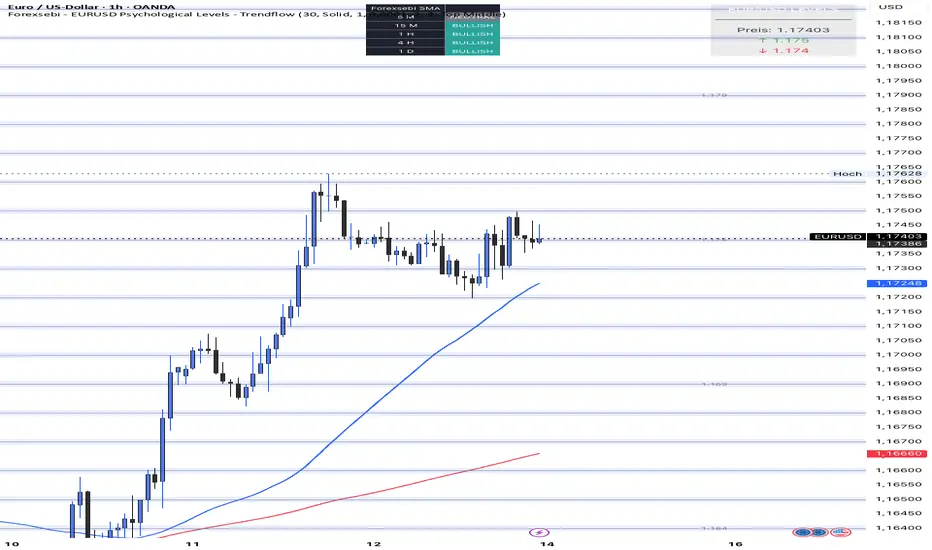
Forexsebi - EURUSD Psychological Levels - TrendflowTrendflow is an advanced TradingView indicator combining psychological price levels with trend and multi-timeframe analysis.
The indicator automatically plots psychological levels in around the current price. Each level is visualized using horizontal lines and price zones (boxes) to clearly highlight potential support and resistance areas.
Psychological Levels – Trendflow ist ein fortschrittlicher TradingView-Indikator , der wichtige psychologische Preislevel mit einer klaren Trend- und Multi-Timeframe-Analyse kombiniert.
Trend Analysis with SMAs
SMA 50 & SMA 200 plotted directly on the chart
Individually toggleable
Clear color separation for fast trend recognition
Multi-Timeframe SMA Trend Table
Trend status (BULLISH / BEARISH / NEUTRAL) across:
5M, 15M, 1H, 4H, 1D
Logic: Price relative to SMA 50 & SMA 200
Color-coded, easy-to-read table
Info Box
Current Gold price
Nearest psychological level above and below price
Alert System
Alerts when price approaches a psychological level
User-defined alert distance
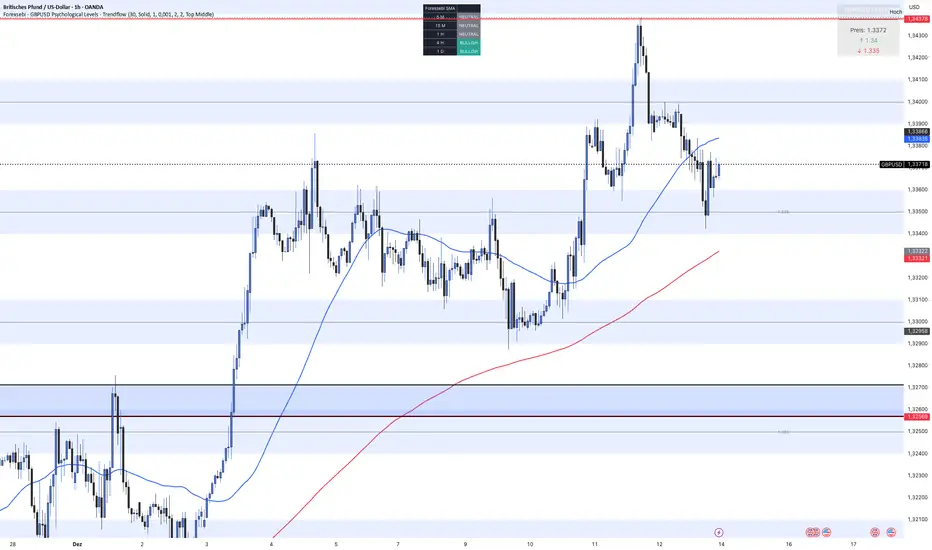
Forexsebi - GBPUSD Psychological Levels - TrendflowTrendflow is an advanced TradingView indicator combining psychological price levels with trend and multi-timeframe analysis.
The indicator automatically plots psychological levels in around the current price. Each level is visualized using horizontal lines and price zones (boxes) to clearly highlight potential support and resistance areas.
Psychological Levels – Trendflow ist ein fortschrittlicher TradingView-Indikator , der wichtige psychologische Preislevel mit einer klaren Trend- und Multi-Timeframe-Analyse kombiniert.
Trend Analysis with SMAs
SMA 50 & SMA 200 plotted directly on the chart
Individually toggleable
Clear color separation for fast trend recognition
Multi-Timeframe SMA Trend Table
Trend status (BULLISH / BEARISH / NEUTRAL) across:
5M, 15M, 1H, 4H, 1D
Logic: Price relative to SMA 50 & SMA 200
Color-coded, easy-to-read table
Info Box
Current Gold price
Nearest psychological level above and below price
Alert System
Alerts when price approaches a psychological level
User-defined alert distance
Forexsebi - GOLD Psychological Levels - TrendflowPsychological GOLD levels every $50 with clear zones, highlighted $100 & $500 levels, SMA 50 & 200, and a multi-timeframe trend table. Perfect for structure, trend, and rejection trading on XAUUSD.
Psychologische GOLD-Levels in 50-Dollar-Abständen mit klaren Zonen, 100- & 500-Dollar-Highlights, SMA 50 & 200 sowie einer Multi-Timeframe Trend-Tabelle. Ideal für Struktur-, Trend- und Rejection-Trading auf XAUUSD.
Key Features
Psychological Gold Levels
Automatic levels every $50
Adjustable number of levels above and below current price
Highlighted zones around each level for clearer reaction areas
Special Level Highlighting
$100 levels (xx00) highlighted for medium importance
$500 levels (x000 / x500) marked as major psychological levels
Different colors and stronger line thickness for key zones
Price Labels
Clean price labels displayed on the chart
Special symbols for 100 and 500 dollar levels
Trend Analysis with SMAs
SMA 50 & SMA 200 plotted directly on the chart
Individually toggleable
Clear color separation for fast trend recognition
Multi-Timeframe SMA Trend Table
Trend status (BULLISH / BEARISH / NEUTRAL) across:
5M, 15M, 1H, 4H, 1D
Logic: Price relative to SMA 50 & SMA 200
Color-coded, easy-to-read table
Displays the current trading session (Asia, Frankfurt, London, NY)
Info Box
Current Gold price
Nearest psychological level above and below price
Alert System
Alerts when price approaches a psychological level
User-defined alert distance
Distinction between normal, $100 and $500 levels
