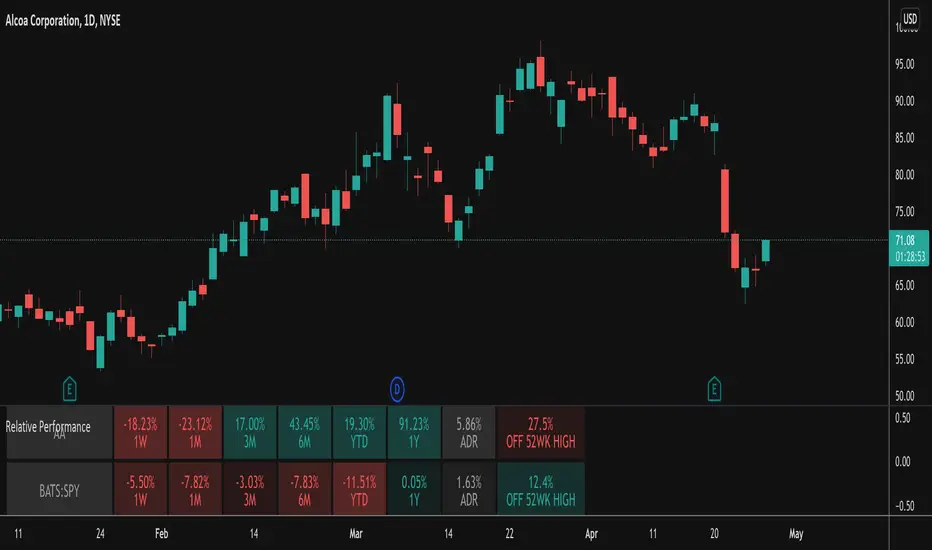
Relative PerformanceThis indicator takes the Performance Table from @BeeHolder and converts it to a Relative Performance table so you can compare the current chart vs. an Index (or whatever other ticker you want) to see the relative performance of one vs. the other. I also added a cell for ADR, which is also the same value as "Monthly Volatility" in the stock screener. This can be useful when screening stocks based on performance and volatility.
Comparaison de force relative
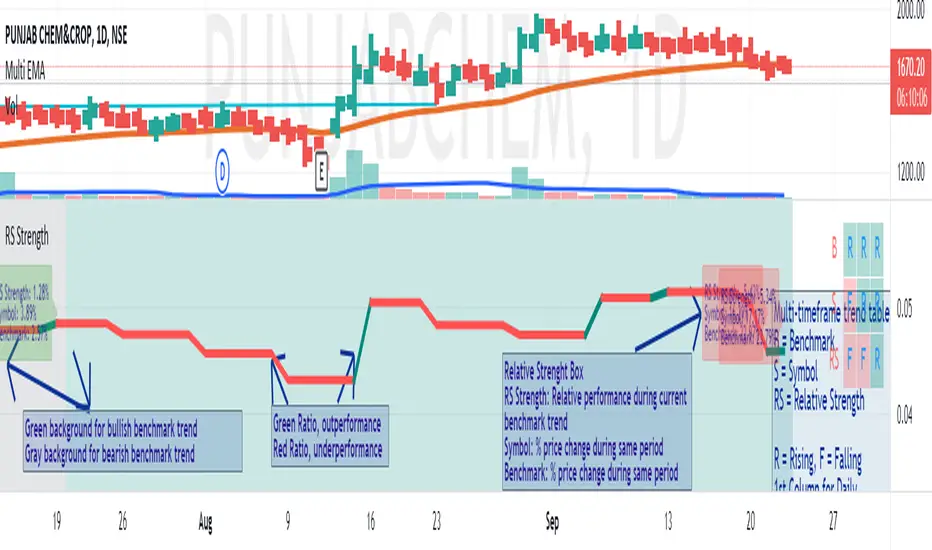
Measure of Relative Strength on Trend ReversalDescription
The Measure of Relative Strength on Trend Reversal displays the relative strength of the symbol vis-a-vis a benchmark based on the trend reversal of the benchmark. At the end of the trend (i.e. when the trend of the benchmark moves from Uptrend to Downtrend, or vice-versa) the strength (measure) of the symbol's performance with respect to the benchmark is calculated. Additionally, the change% of the symbol and the benchmark are calculated and displayed. This 3 information is helpful in determining the relative performance of the symbol with respect to the broader benchmark trend.
Example
For example, consider that the benchmark turned from a downtrend to an uptrend, then at the last bar of the downtrend, the "RS Strength%", the "Symbol%" and the "Benchmark%" shall be displayed. The RS Strength% shows the outperformance/underperformance of the symbol with respect to benchmark for the duration of the downtrend. A negative% means underperformance and a positive% means outperformance. The Symbol% is the % change in the price of the symbol during the downtrend and likewise, Benchmark% is the selected benchmark for the downtrend.
Working
These counters are reset at the beginning of each trend reversal of the benchmark. When the performance of a symbol is stronger on benchmark downtrend for successive times, it is an indication of a strong stock in the making once the larger market recovers.
The trend of the benchmark is established on the basis of a lookback period that is configurable at the input. The trend is established on the reversal of the key moving average by the lookback that is configured. A downtrend in the benchmark is denoted by a gray background and a uptrend in the benchmark is denoted in green.
The input is explained below:
Comparative Symbol - The benchmark. Nifty50 is the default value
Chart Type - Line or Candle plot of the Relative Strength with respect to Benchmark
Lookback for benchmark trend - Lookback to determine the trend of the benchmark
Display RS Strength% - Option to disable the RS strength value and focus only on the RS trend
Ways to use
Backtests show that this indicator is best used on a Weekly Timeframe, with 10 lookback for the benchmark. Any symbol that is constantly beating the benchmark on a downtrend is a strong candidate for outperforming once the market recovers.
On selecting a group index as the benchmark it is possible to identify the strong stocks in the group, those with the highest RS Strengths are the outperformers of the group.
QuantAnna: Relative Strength Plus (RS+)NSE:TATAMOTORS
Relative strength indicator which shows ratio between two stocks/assets .. usually between stock & its indices
features of indicator is as following.
1. Values oscillates around zero, it is bullish when above zero & bearish when below zero.
1. Weighted smoothing which removes unwanted whipsaws but keeps trend curve intact.
3. In-Built list of Nifty sector indices to show stocks comparison with its sector
please do send your feedback and suggestions.

Simple RSI tableThis is a simple RSI table for traders that don't want the graph, only the current value.
Location, thresholds, and colors are all adjustable.
Relative StrengthPowerful tool to calculate and display the strength of a security compared to another security.
Some Main purposes are:
- finding new leadership in a market correction
- comparing a market leader with a top competitor
- tracking rotation in the market
.. and so much more!
This tool is highly configurable, you can especially change:
- The reference symbol (SPY, QQQ, BTCUSD, ...)
- The time span to indicate a new High or Low in a certain time-frame
- Factorize your RS-Chart to make it fit to the original chart. (Moves the chart up or down)
- Option to repaint your candles / bars when a new RS High occurs in the given timeframe.
Enjoy and have a great day!
Powerful_Trading
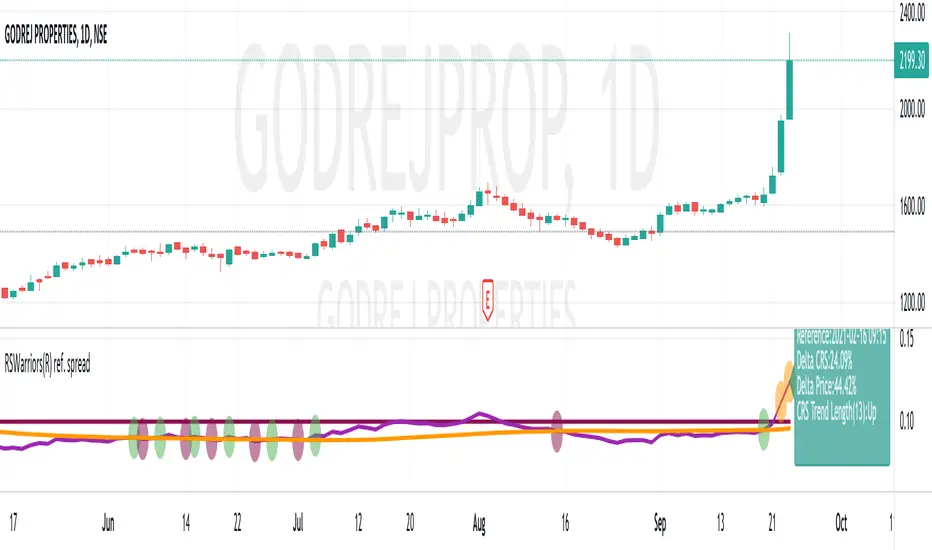
Fixed Reference Ratio Charts (RSWarriors(R))A Ratio Chart, for analysis with any benchmark. This is the open source version of the earlier, Fixed Ref. Ratio indicator. This is the version that will be maintained in the future.
Plots a ratio of the symbol to benchmark. Plots, all time high ratios (orange bubbles), Increasing ratios (blue bubbles).
Detailed write up will be added in subsequent updates.
Ultimate RSIsThis RSI script includes everything you could want on an RSI. There are multiple timeframes which will give context to market movement, as well as a highlight feature to make it easier to visualize overbought and oversold stocks.
Tip: Uncheck the 4 plots with no color in them to remove the extra headers on the indicator.

Relative Strength ComparisonThis indicator compares the difference in percentage change between two symbols
over a user-specified number of bars.
Default settings will show the difference between the current symbol and the
S&P 500 ETF (SPY) over 10 bars. It can be used to determine if the stock is
showing relative strength or weakness compared to the overall market.

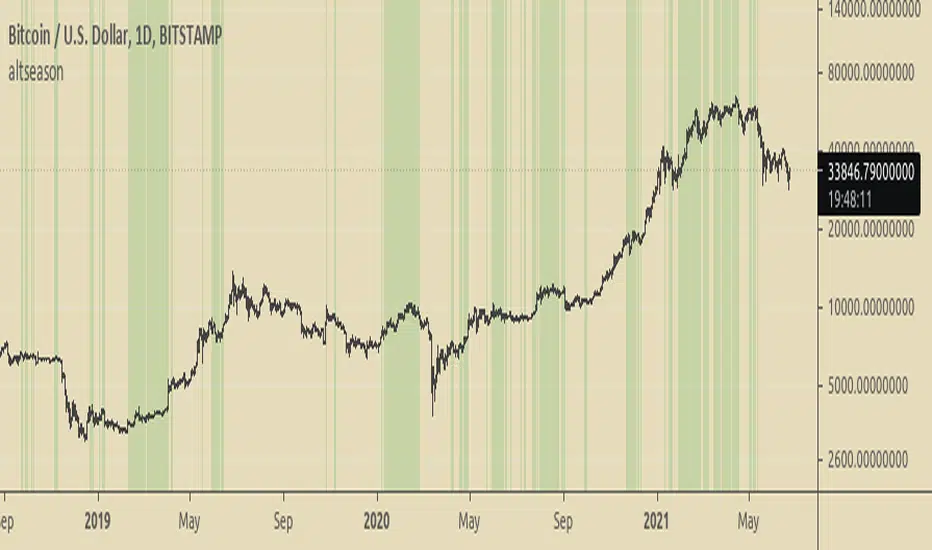
Altseason FinderTo know when to buy altcoins instead of bitcoin.
It is based on BTCUSD and BTC Dominance RSIs.
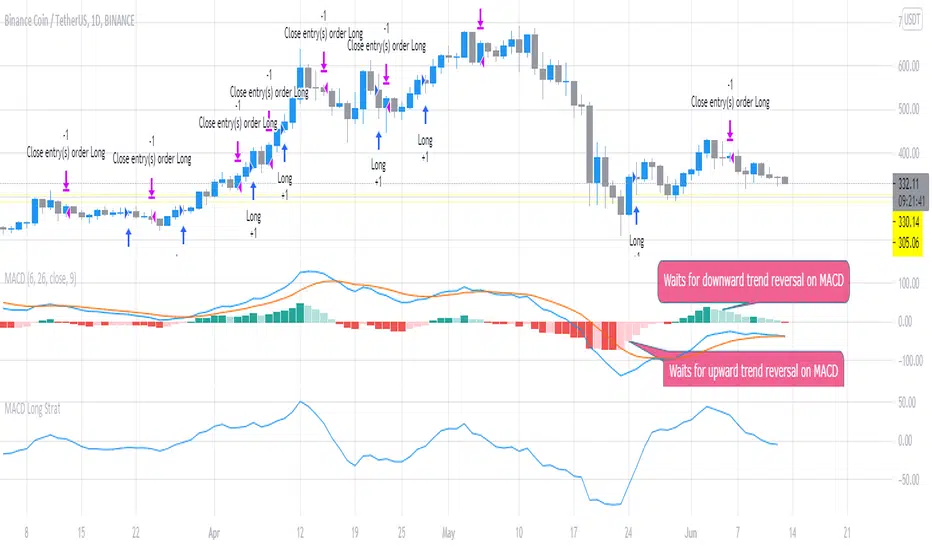
MACD Long StratFirst script I've written, but the concept is pretty simple. This uses the MACD with settings fast_SMA = 6 and slow SMA=16 and uses the distance between the 2 (histogram) to look for potential trend reversals to flag potential entries for Long trades. It waits for the confirmation looking backward 2 x timeframes (to reduce false calls slightly). You can adjust it to open / close quicker (1 timeframe instread of 2) but backtesting shows 2 timeframe delay is best to avoid false signals.
The script suggests Long entry points based on this criteria and uses the converse (reducing histogram / SMA difference delayed by 2 timeframes) to suggest exit or trade close points for downward reversal. It was originally written looking at 1m scalps but backtesting shows this is even more effective on higher timeframes (1D).
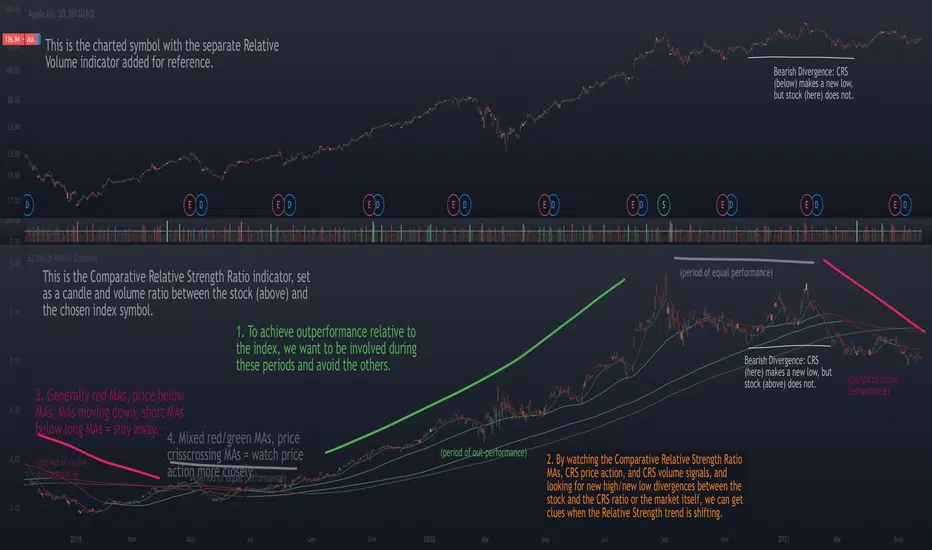
Relative Strength Ratio Chart + Relative Volume Gradient CandlesThe purpose of the Comparative Relative Strength Ratio indicator is to provide a way of looking at a relative strength ratio as a candle graph instead of only a closing price line, as well as to provide relative volume gradient coloration on the ratio-generated candles, and additionally to plot moving averages of the CRS ratio that can help display shifting trends in relative strength.
This is different from my Relative Volume Gradient Paintbars indicator, as well as my Comparison Chart with Relative Volume Gradient Paintbars indicator, in that the first looks at the charted symbol itself, the second looks at an alternate symbol, and this third indicator looks at a ratio between the charted symbol and the alternate symbol.
The idea behind this indicator is to provide additional means of evaluating relative strength, such as comparing the moving averages of the comparative relative strength ratio graph to the charted stock symbol's own MAs in order to gauge strength, comparing the price action of the ratio to that of the individual stock and its index, and comparing the volume gradient signal between the ratio, the stock, and the index.
The unique volume features allow comparing volume as a percent of the index volume, as well as stock's candle range as a percent of the range of the index. So when the volume as a percentage of the index's overall volume becomes high, this can be made to highlight the candles.
Comparison Chart with Relative Volume Gradient CandlesThis indicator provides a way to use Relative Volume Gradient Paintbars on an alternate/comparison symbol while still looking at your main charted symbol. For instance, this allows you to plot the ES1! or SPY or QQQ above/below your charted symbol, and see its current Relative Volume signal, and compare that to the your currently-charted individual stock symbol, etc., and while keeping the candles from both symbols all lined up perfectly. It also provides 4 different custom MAs which can be applied to the comparison symbol.
The idea here is that you can potentially use my other indicator, Relative Volume Gradient Paintbars, on the primary symbol to evaluate that chart, while using this particular indicator to quickly analyze the same Relative Volume data on a comparison market symbol such as the SPY or QQQ without having to switch charted symbols. You can also quickly compare price action and location relative to familiar moving averages to quickly gauge relative strength of the stock vs. the market symbol.

Multiple RSI LengthsThis script will allow users to view Multiple RSI timeframes in one indicator (up to 4). This can be useful for viewing RSI Convergences/Divergences and extremely long timeframes like 250 days can provide context to market strength over long positions.

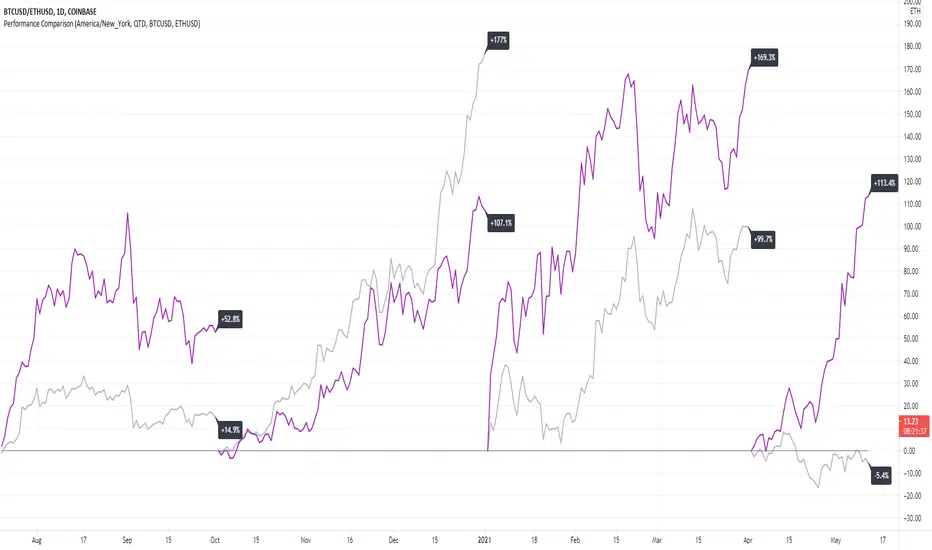
Performance ComparisonThis script takes two symbols as input and shows the year-to-date (YTD), quarter-to-date (QTD), or month-to-date (MTD) performance in percent.
MS CRB/SPYThis indicator tracks the GSCI Commodity Index over the course of the S&P 500. This is used for the fundamental evaluation of ratios of asset classes to each other. The thesis is based on Ray Dalio's quadrant theory: in periods without inflation and with good growth, stock prices rise and commodity prices fall. Conversely, in periods of good growth in an inflationary environment, commodities rise and the rise in equities slows. In particular, there is a change of favorites towards companies that produce cash (i.e. away from growth fantasies). This indicator shows the change in valuations between asset classes and thus allows conclusions to be drawn. This still goes far beyond what has been written, I recommend reading Ray Dalio's works on this.

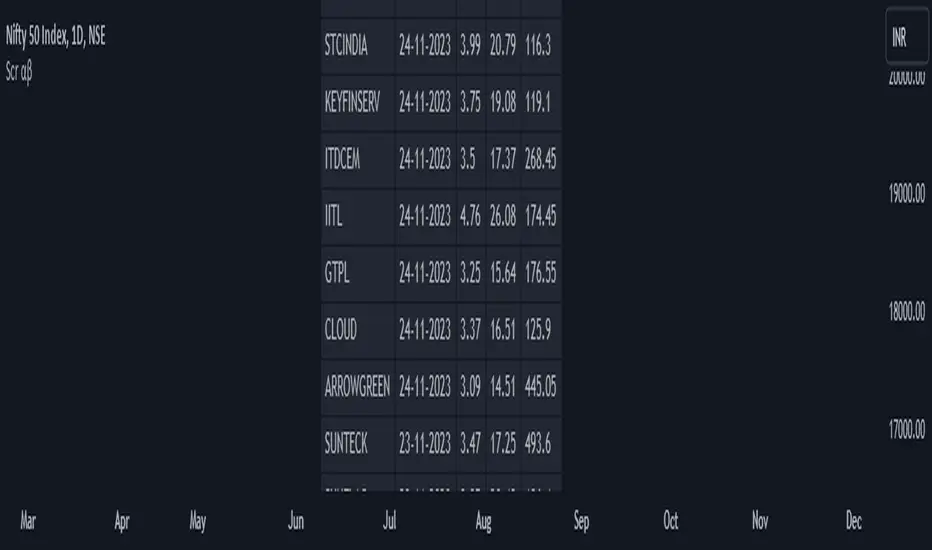
Screener: Alpha & BetaThis is a Live Screener for my previous Alpha & Beta indicator, which filters stocks lively based on the given values.
Use 5min timeframe for Live Intraday.
The default stocks in the screener is selected based on high beta value from F&O listed stocks. It may include other stocks also.
User can input stocks of your choice either through the menu or through the Pine editor.
The maximum number of stocks inputs is only 40. The indicator includes only 20 stocks by default.
More number of stocks can be added but it makes the screener slower to load.
Open the indicator in a sperate tab or window to avoided the loading lag.
It is recommended to choose only 10 to 20 stocks based on the weightage from each sectors.
Beta values are dynamic. It changes from day to day based on the trend and sector.
Update the sock list weekly or twice a week or monthly.
Use investing.com screener(preferably) or TradingView screener for shortlisting beta stocks.
Remember that majority of indicators fails in a sideways market, also every indicator is not 100% accurate.
Relative Strength Comparison_FBMSCAPShows the strength of current symbol relative to strength of another symbol, defaulted to Bursa Malaysia broad market index: FBMSCAP. Best viewed in weekly chart.

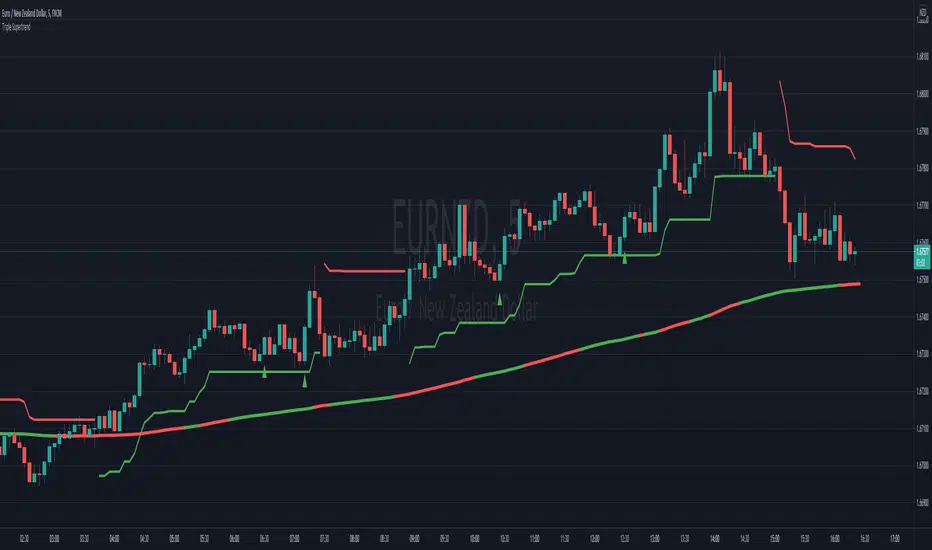
Triple Supertrend Entry SignalsThis indicator combines 3 supertrend indicators (a fast, medium and slow) with stochastic RSI and 200 EMA. It only gives short signals if price is under the 200 EMA and long signals if price is over the 200 EMA. Secondly it will only show you a short entry if the stochastic RSI is in the overbought territory and a long signal if the stochastic RSI is in the oversold territory. Finally, 2 of the supertrend lines must be over the candles for a sell and two of the supertrend lines under the candles for a buy. By default the script only displays the slow supertrend line which can be used as a guide for stop loss but the medium and fast lines can be revealed via the settings. Typically you can target 1.5 x risk for TP if using the slow supertrend line as a stop loss. Use the alerts to ensure you don't miss a potential entry.
Bollinger DCA v1Simple "benchmark" strategy for ETFs, Stocks and Crypto! Super-easy to implement for beginners, a BTD (buy-the-dip) strategy means that you buy a fixed amount of an ETF / Stock / Crypto every time it falls. For instance, to BTD the S&P 500 ( SPY ), you could purchase $500 USD each time the price falls. Assuming the macro-economic conditions of the underlying country remain favourable, BTD strategies will result in capital gains over a period of many years, e.g. 10 years.
Recommended Chart Settings:
Asset Class: ETF / Stocks / Crypto
Time Frame: H1 (Hourly) / D1 (Daily) / W1 (Weekly) / M1 (Monthly)
Necessary ETF Macro Conditions:
1. Country must have healthy demographics, good ratio of young > old
2. Country population must be increasing
3. Country must be experiencing price-inflation
Necessary Stock Conditions:
1. Growing revenue
2. Growing net income
3. Consistent net margins
4. Higher gross/net profit margin compared to its peers in the industry
5. Growing share holders equity
6. Current ratios > 1
7. Debt to equity ratio (compare to peers )
8. Debt servicing ratio < 30%
9. Wide economic moat
10. Products and services used daily, and will stay relevant for at least 1 decade
Necessary Crypto Conditions:
1. Honest founders
2. Competent technical co-founders
3. Fair or non-existent pre-mine
4. Solid marketing and PR
5. Legitimate use-cases / adoption
Default Robot Settings:
Contribution (USD): $500
When: Dips below lower Bollinger Band
*Robot buys $500 worth of ETF , Stock, Crypto, every time price falls below the lower Bollinger Band
*Equity curve can be seen from the bottom panel*
Risk Warning:
This strategy is low-risk, however it assumes you have a long time horizon of at least 5 to 10 years. The longer your holding-period, the better your returns. The only thing the user has to keep-in-mind are the macro-economic conditions as stated above. If unsure, please stick to ETFs rather than buying individual stocks or cryptocurrencies.

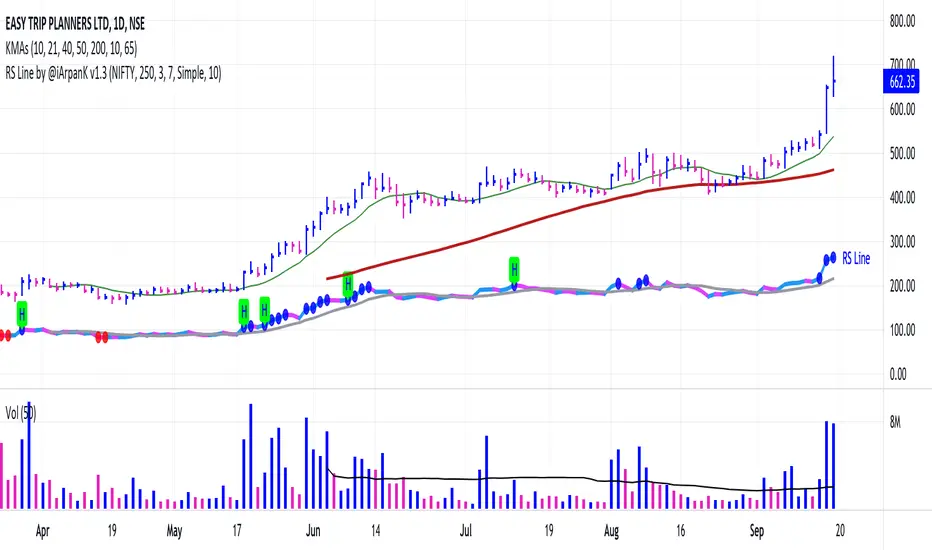
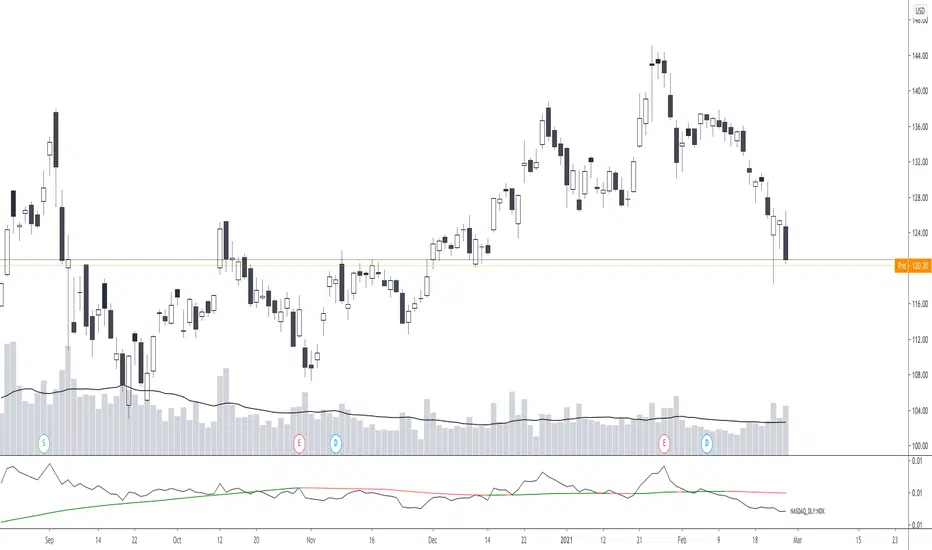
Relative Strength Line by @iArpanKHello Traders!
I'm a Momentum Trader, following the Indian & US markets. Most of us are familiar with the Relative Strength (RS) indicator, popularized by Investor's Business Daily (IBD) and available on their MarketSmith platform. So, here I'm sharing a script that does the same and additionally pops an alert label when the RS line hits a new high (similar to Blue Dot appearance on MarketSmith charts).
User Settings
Inputs tab
Base Symbol : Symbol of the security/index with which you want to compare your current active symbol.
Period : Number of days since which you want to scan for a new high (default is 250 days, which approximately pops alerts for new 52 week high in RS). For example, if you want to look for new 10 days high in RS, set the Period to 10.
Style tab
RS Line : Change color using the palette provided (default is blue).
Alert Label : Show/hide alert labels by checking/unchecking the box. Change color using the palette provided. Change alert label symbol.
Precision : Default is two decimal places. Can be changed as per requirement.
Usage
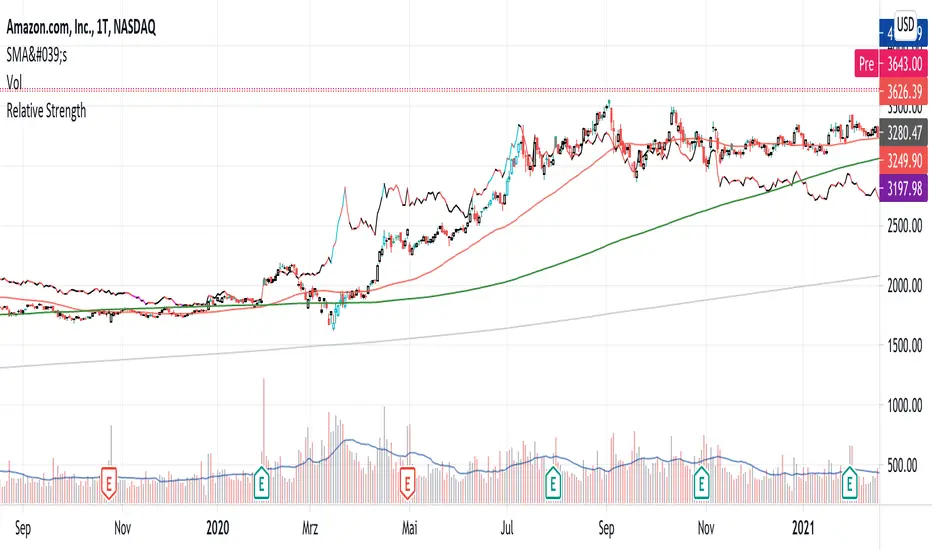
The indicator consists of two components- the Relative Strength (RS) line & alert labels on new RS highs. Relative strength gives a measure of how the underlying security is performing with respect to a base index or security. For example, how is NSE:DIXON performing w.r.t NSE:NIFTY or how is NASDAQ:AAPL performing w.r.t. the TVC:SPX .
A rising RS line tells us that the underlying entity is outperforming the base entity. Similarly, a declining RS line shows under-performance of the underlying entity. A new high in RS (especially before a new high in price) often gives valuable information about the underlying security's strength w.r.t. the general market, and can tip us off to a possible breakout in the price in near future.
Making RS lists (list of stocks making new high in RS on heavy down days in index) can be very helpful to sort out leaders that are best resisting the decline and are likely to move up aggressively when the market turns favorable.
The concept of RS is extensively used by momentum traders and growth stock traders. When used in conjunction with price & volume action, this can be a very powerful tool in your trading arsenal. You can now easily spot RS trends and new highs visually by simply adding this indicator to your chart!
Conclusion
If you like this script, click on Add to favorite indicators , so that you can easily add this indicator from your favorites tab right away.
Thanks!
Relative Strength RatioAbout this indicator:
This indicator goes under many different names such as Relative Strength Ratio, Comparative Strength, Relative Strength Comparison (RSC) etc.
It compares the strength of the current asset to another asset of your choice and displays the relative strength of the current asset. (Not RSI)
There are several comparative indicators published already here on TV but I have added some unique features that I think is really useful.
When to use it:
This is useful when you want to compare for example a stock with its sector to find out if the stock is a leadership stock in that sector or main index.
You could also use it to compare the sector to its index etc.
If you want to compare for example a stock to both its index and its sector at the same time I suggest you add 2 instances of this indicator.
In many trading systems you are supposed find the strongest tickers by identifying "layers of strength" like 1. The strongest asset class that money is flowing into (like stocks, commodities, bonds, etc.) 2. Find the strongest sectors. 3. Find the stocks outperforming those sectors. 4. Find some kind of entry signal there.
How it works:
The indicator calculates an "RS line" (Relative Strength) by dividing the current ticker with a ticker of your choice. This creates a ratio or pair similar to how currencies are related to each others like USDGBP (dollar against pound). The RS line is black by default so you might want to change its color if you use a dark theme.
If the RS line is moving up it means your current asset is stronger than the asset you are comparing it with and vice versa.
Use the simple moving average to quickly see long term strength trends.
Features
RS line
Shows the relative strength of the current asset.
SMA
This Simple Moving Average has directional coloring; green when it is angled up and red when it is angled down. You can customise the period in the settings. If you don't want the color change just make both up/down color the same.
Relative market label
This displays the market you are currently comparing with as a label next to the last data point.
Because I tried stocks in 2 different countries I want to know which index I am comparing with and this label saves me from going into the settings to check. I find it to be a life saver!
Please let me know if you find any problems or if you have any ideas for improvement
SectorsThis script attempts to show the relative strength of the 11 sectors in the SPX, which can be accomplished in three ways:
1. Sectors - displays all sector indices as they appear normally
2. Sector Relativity - displays each sector divided by the sum of the other 10 sectors
3. Sector Alpha - displays the alpha of each sector as compared to the sum of the other 10 sectors
I have seen some other iterations of this script that compare each sector to the SPX as a whole, a couple problems with that:
1. SPX sector weightings are unequal and change quarterly, meaning you will get an inaccurate depiction of relative sector strength across time.
2. Even if using an equal-weight SPX, you would be comparing a sector to itself as all 11 sectors are included in the SPX, not just the complementary 10 you are looking to compare one sector to.
For more information on the sectors in the SPX or the calculation of Alpha, visit the links at the top of the script.
*Includes an option for repainting -- default value is true, meaning the script will repaint the current bar.
False = Not Repainting = Value for the current bar is not repainted, but all past values are offset by 1 bar.
True = Repainting = Value for the current bar is repainted, but all past values are correct and not offset by 1 bar.
In both cases, all of the historical values are correct, it is just a matter of whether you prefer the current bar to be realistically painted and the historical bars offset by 1, or the current bar to be repainted and the historical data to match their respective price bars.
As explained by TradingView,`f_security()` is for coders who want to offer their users a repainting/no-repainting version of the HTF data.

Cryptos Relative Strength Oscillator
This is an oscillator made of biggest 40 cryptocurrency/USDT pairs.
* It shows relative strength and change of crypto market during certain time on given interval.
* The tool has a bunch of data put together into one oscillator:
* top and bottom lines are made of 3 strongest and 3 weakest crypto pairs (out of 40)
* has visible names of that pairs for several candles back (it cannot show more due to TV's Pine limitations)
* in settings you can set up 2 methods of calculations:
1) % change from SMA of price, default is SMA 5
2) % changes from x-candles back, to see that change from the last candle please turn of 'Moving Average' and set up 'Bars Back' to 1
* you can change source to close/hl2/ohlc2/etc
Notice 1:
- to have nicer visibility of whole oscillator make it bigger part of whole screen then you normally use for other oscillators
Notice 2:
- scroll your mouse to widen the horizontal axis, so names of certain crypto pairs will be more readable
Notice 3:
- script has 40 Pine security functions (to gather all the data from all pairs) so it can load up to several seconds
- also every change in settings will possibly result in longer loading time
ps. This script is invite-only for the members of our trading group (info in signature, group is free of charge).
