Breakout Detector (Previous MTF High Low Levels) [LuxAlgo]The Breakout Detector (Previous MTF High Low Levels) indicator highlights breakouts of previous high/low levels from a higher timeframe.
The indicator is able to: display take-profit/stop-loss levels based on a user selected Win/Loss ratio, detect false breakouts, and display a dashboard with various useful statistics.
Do note that previous high/low levels are subject to backpainting, that is they are drawn retrospectively in their corresponding location. Other elements in the script are not subject to backpainting.
🔶 USAGE
Breakouts occur when the price closes above a previous Higher Timeframe (HTF) High or below a previous HTF Low.
On the advent of a breakout, the closing price acts as an entry level at which a Take Profit (TP) and Stop Loss (SL) are placed. When a TP or SL level is reached, the SL/TP box border is highlighted.
When there is a breakout in the opposite direction of an active breakout, previous breakout levels stop being updated. Not reaching an SL/TP level will result in a partial loss/win,
which will result in the box being highlighted with a dotted border (default). This can also be set as a dashed or solid border.
Detection of False Breakouts (default on) can be helpful to avoid false positives, these can also be indicative of potential trend reversals.
This indicator contains visualization when a new HTF interval begins (thick vertical grey line) and a dashboard for reviewing the breakout results (both defaults enabled; and can be disabled).
As seen in the example above, the active, open breakout is colored green/red.
You can enable the setting ' Cancel TP/SL at the end of HTF ', which will stop updating previous TP/SL levels on the occurrence of a new HTF interval.
🔶 DETAILS
🔹 Principles
Every time a new timeframe period starts, the previous high and low are detected of the higher timeframe. On that bar only there won't be a breakout detection.
A breakout is confirmed when the close price breaks the previous HTF high/low
A breakout in the same direction as the active breakout is ignored.
A breakout in the opposite direction stops previous breakout levels from being updated.
Take Profit/Stop Loss, partially or not, will be highlighted in an easily interpretable manner.
🔹 Set Higher Timeframe
There are 2 options for choosing a higher timeframe:
• Choose a specific higher timeframe (in this example, Weekly higher TF on a 4h chart)
• Choose a multiple of the current timeframe (in this example, 75 minutes TF on a 15 min chart - 15 x 5)
Do mind, that when using this option, non-standard TFs can give less desired timeframe changes.
🔹 Setting Win/Loss Levels
The Stop Loss (SL) / Take Profit (TP) setting has 2 options:
W%:L% : A fixed percentage is chosen, for TP and SL.
W:L : In this case L (Loss-part) is set through Loss Settings , W (Win-part) is calculated by multiplying L , for example W : L = 2 : 1, W will be twice as large as the L .
🔹 Loss Settings
The last drawing at the right is still active (colored green/red)
The Loss part can be:
A multiple of the Average True Range (ATR) of the last 200 bars.
A multiple of the Range Cumulative Mean (RCM).
The Latest Swing (with Length setting)
Range Cumulative Mean is the sum of the Candle Range (high - low) divided by its bar index.
🔹 False Breakouts
A False Breakout is confirmed when the price of the bar immediately after the breakout bar returns above/below the breakout level.
🔹 Dashboard
🔶 ALERTS
This publication provides several alerts
Bullish/Bearish Breakout: A new Breakout.
Bullish/Bearish False Breakout: False Breakout detected, 1 bar after the Breakout.
Bullish/Bearish TP: When the TP/profit level has been reached.
Bullish/Bearish Fail: When the SL/stop-loss level has been reached.
Note that when a new Breakout causes the previous Breakout to stop being updated, only an alert is provided of the new Breakout.
🔶 SETTINGS
🔹 Set Higher Timeframe
Option : HTF/Mult
HTF : When HTF is chosen as Option , set the Higher Timeframe (higher than current TF)
Mult : When Mult is chosen as Option , set the multiple of current TF (for example 3, curr. TF 15min -> 45min)
🔹 Set Win/Loss Level
SL/TP : W:L or W%:L%: Set the Win/Loss Ratio (Take Profit/Stop Loss)
• W : L : Set the Ratio of Win (TP) against Loss (SL) . The L level is set at Loss Settings
• W% : L% : Set a fixed percentage of breakout price as SL/TP
🔹 Loss Settings
When W : L is chosen as SL/TP Option, this sets the Loss part (L)
Base :
• RCM : Range Cumulative Mean
• ATR : Average True Range of last 200 bars
• Last Swing : Last Swing Low when bullish breakout, last Swing High when bearish breakout
Multiple : x times RCM/ATR
Swing Length : Sets the 'left' period ('right' period is always 1)
Colours : colour of TP/SL box and border
Borders : Style border when breakout levels stop being updated, but TP/SL is not reached. (Default dotted dot , other option is dashed dsh or solid sol )
🔹 Extra
Show Timeframe Change : Show a grey vertical line when a new Higher Timeframe interval begins
Detect False Outbreak
Cancel TP/SL at end of HTF
🔹 Show Dashboard
Location: Location of the dashboard (Top Right or Bottom Right/Left)
Size: Text size (Tiny, Small, Normal)
See USAGE/DETAILS for more information
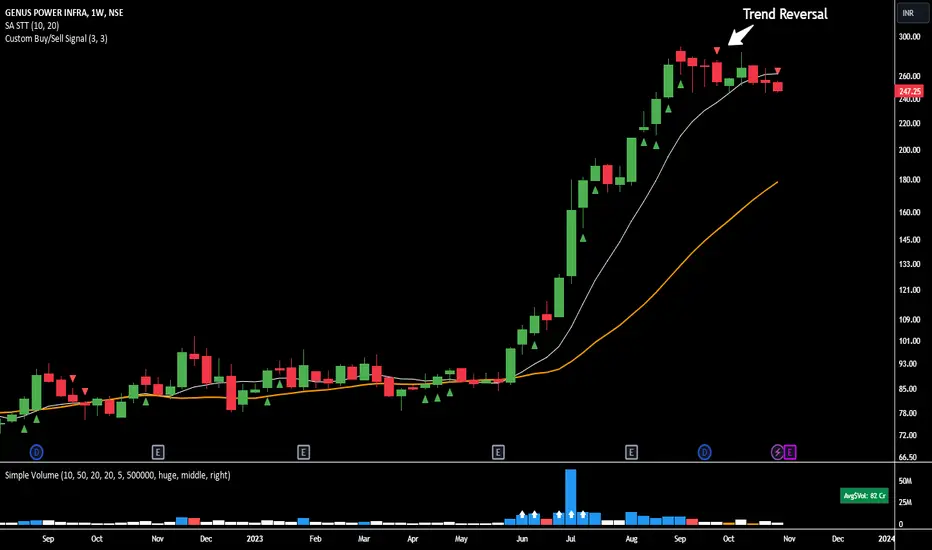
Reversal

Consecutive Higher/Lower ClosingsThe Consecutive Higher/Lower Closings indicator is a powerful tool designed to assist traders in identifying potential buy and sell signals based on consecutive higher or lower closing prices. This indicator provides users with the flexibility to specify the number of consecutive higher or lower closings required to trigger a signal, allowing for a customizable trading strategy.
Key Features:
Customizable Parameters: Users can define the number of consecutive higher and lower closings needed to generate buy and sell signals, providing a tailored approach to trading.
Clear Buy and Sell Signals: The indicator plots clear buy and sell signals directly on the chart, making it easy for traders to identify potential entry and exit points.
Usage:
Consecutive Higher Closings (Buy Signal): When the current closing price is higher than the previous closing price for the specified number of consecutive periods (as defined by the user), a buy signal will be generated.
Consecutive Lower Closings (Sell Signal): When the current closing price is lower than the previous closing price for the specified number of consecutive periods (as defined by the user), a sell signal will be generated.
How to Use:
Apply the Consecutive Higher/Lower Closings indicator to your chart.
Adjust the input parameters, consecutiveHigherClosings and consecutiveLowerClosings, to match your preferred trading strategy. These parameters determine the number of consecutive higher and lower closings needed to trigger signals.
Interpret the buy and sell signals generated by the indicator. When a buy signal is displayed (green triangle up), it suggests a potential entry point. Conversely, a sell signal (red triangle down) indicates a potential exit point.
Important Note:
This indicator is designed to assist traders in making informed decisions, but it should be used in conjunction with other technical analysis tools and risk management strategies for a comprehensive trading approach.
Kindly be aware that this strategy is most effective with Monster stocks with smooth price action, particularly when analyzing in weekly and/or daily timeframe.
Disclaimer:
Trading involves risk, and past performance does not guarantee future results. Always conduct thorough research and consider your risk tolerance before making trading decisions.
K`s Extreme DurationExtreme duration uses a special combination of the RSI and its relative position to deliver a reversal signal.
The following are the conditions to generate signals:
* Bullish signal: The current 8-period RSI is below 50 and above 35 while the previous 5 RSI's are below 35.
* Bearish signal: The current 8-period RSI is above 50 and below 65 while the previous 5 RSI's are above 65.

Confluence Buy-Sell Indicator with Fibonacci The script is a "Confluence Indicator with Fibonacci" designed to work on the TradingView platform. This indicator combines multiple technical analysis strategies to generate buy and sell signals based on user-defined confluence criteria. Here's a breakdown of its features:
Confluence Criteria: Users can enable or disable various strategies like MACD, RSI, Bollinger Bands, Divergence, Fibonacci, and Moving Average. The number of strategies that need to align for a signal to be generated can be set by the user.
Strategies Included:
MACD Strategy: Uses the Moving Average Convergence Divergence method to identify buy/sell opportunities.
RSI Strategy: Utilizes the Relative Strength Index to detect overbought or oversold conditions.
Bollinger Bands Strategy: Incorporates Bollinger Bands to identify volatility and potential buy/sell signals.
Divergence Strategy: A basic implementation that detects bullish and bearish divergences using the RSI.
Fibonacci Strategy: Uses Fibonacci retracement levels to determine potential support and resistance levels.
Moving Average Strategy: Employs a crossover system between the 50-period and 200-period simple moving averages.
Additional Features:
Support & Resistance: Identifies major support and resistance levels from the last 50 bars.
Pivot Points: Calculates pivot points to determine potential turning points.
Stop Loss Levels: Automatically calculates and plots stop-loss levels for buy and sell signals.
NYC Midnight Level: Option to display the New York City midnight price level.
Visualization: Plots buy and sell signals on the chart with green and red markers respectively.
Adequate Category:
"Technical Analysis Indicators & Overlays" or "Strategy & Scripting Tools".

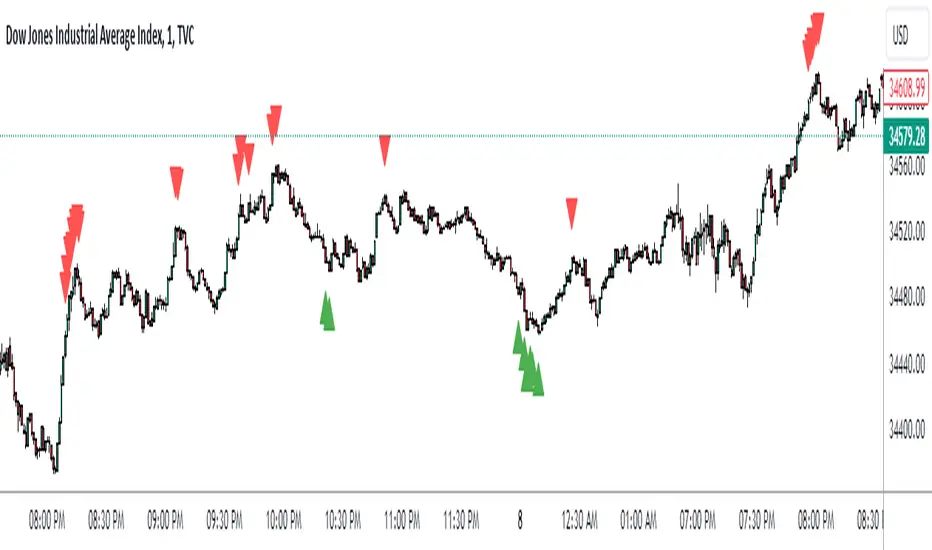
SpiceIn the chart photo is a description for each shape and letter, saying what each one is.
BB, Reversals are off by default.
BB + Reversals + Next bar confirmation - The way this should be used is by waiting for a 1 or 2 bar confirmation closed above/below the high/low of the Reversal candle. So if its a Top R, a yellow box will print as a confirmed 1 bar if it closed below the top R's low, then you can wait for the second bar to close also below the Top R's low. Vice versa with the Bot R.
RSI arrows - Essentially showing you when the multi time frame RSIs are coming back up above 30, or below 70. Respective to what time frames you have selected.
Three Line Strike - A trend continuation candlestick pattern consisting of four candles
Leledc Exhaustion suggest the trend may be reversing. Combined with the moving average as a trend filter, the indicator can signal the end of a pull back and the continuation of the trend.
EMAs - Help measuring the trend direction over a period of time.
Credit to all these amazing creators -
Multi Timeframe RSI (LTF) by @millerrh
3 Line Strike by @Lij_MC 'MarketVision A'
Leledc Exhaustion by @glaz, used updated version by @Joy_Bangla
If anyone uses the BB reversals source code to put into their own indicator/strategy, you are free to do so. Just send me a message I'd love to see your work with it! :)
Thanks to Lij_MC's MarketVision A indicator for inspiring me to add more features. At first it was just the RSI Arrows and the BB reversals candles + Condition but then I found MarketVision A and loved the extra Leledc and 3 Line Strike features.
Hope you enjoy this Spice!
No Signal is 100% correct at what it's trying to do. Use caution when trading!
Practice Risk Management.

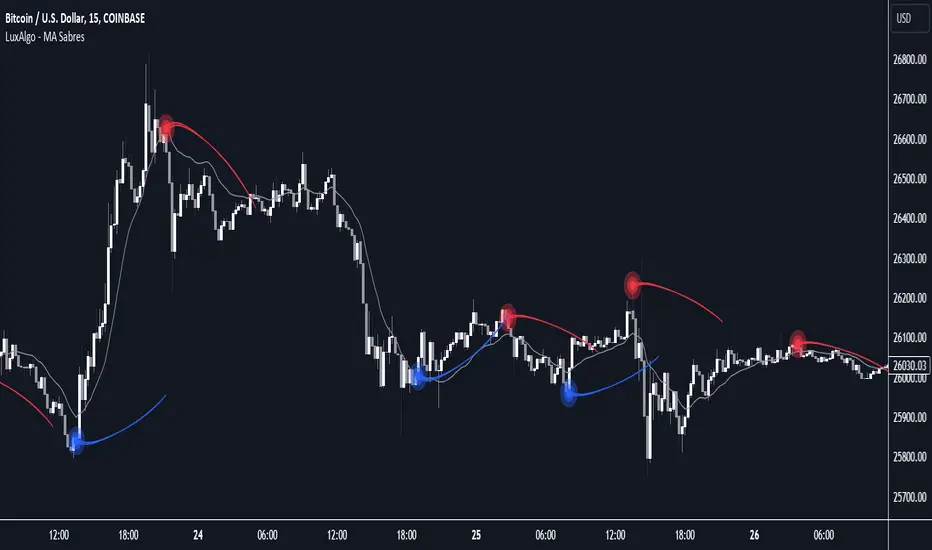
MA Sabres [LuxAlgo]The "MA Sabres" indicator highlights potential trend reversals based on a moving average direction. Detected reversals are accompanied by an extrapolated "Sabre" looking shape that can be used as support/resistance and as a source of breakouts.
🔶 USAGE
If a selected moving average (MA) continues in the same direction for a certain time, a change in that direction could signify a potential reversal.
In this publication, when a trend change occurs, a sabre-shaped figure is drawn which can be used as support/resistance:
A sabre can be indicative of a direction, however, it can also act as a stop-loss when the price should go in the opposite direction:
Or show potential areas of interest:
🔶 DETAILS
This publication will look for a change in direction after the MA went in the same direction during x consecutive bars (settings: " Reversal after x bars in the same direction ").
Then a circle-shaped drawing will be drawn 1 bar back, at the previous high/low, dependable of the previous direction.
From there originates a sabre-shaped figure where the tip lies as far as the user-set MA length.
The angle of the "sabre" relies on the ATR of the previous 14 bars.
Less volatility will create a flatter sabre while the opposite is true when there is more volatility in the previous 14 bars.
The sabre is created by the latest feature, polylines , which enables us to connect several 'points', resulting in a polyline.new() object.
Do note that sabres are offset by one bar to the past to align their locations.
🔶 SETTINGS
MA Type: SMA, EMA, SMMA (RMA), HullMA, WMA, VWMA, DEMA, TEMA, NONE (off)
Length: this sets the length of MA, and the length of the sabre shape
Previous Trend Duration: After the MA direction is the same for x consecutive bars, the first time the direction changes, a sabre is drawn
Rug Pull DetectorOverview
Have you ever wondered why tickers have such erratic movements that seemingly come from nowhere? These "rug pull" events happen quite often and can catch even the most seasoned traders off-guard.
Unlike most other indicators which rely on historical data to make inferences about future price movements, the Rug Pull Detector (RPD) enables you to take a glimpse into market makers' delta-neutral hedging in real-time.
Market makers by nature must be delta-neutral which means that they cannot position themselves to profit from providing liquidity (either long or short). Liquidity provided to the short or long side must end up in a stock purchase or sale to neutralize the trade.
Volatile movements in a ticker's price movement most often result directly after a period of extremely low volatility. These volatile movements are very often "rug pulled" which ends up reverting the ticker back to the price at which the event first occurred. RPD shows these events in real-time. This knowledge can be used to help determine the most probable near-future direction a ticker will gravitate towards after a rug pull event occurs.
Usage
RPD works on any ticker and on any timeframe and can be used as a tool in determining an exit price for a trade. Vertical shading on the chart indicates a warning signal that a rug pull event may be about to kick-off. Once a rug pull event has occurred and is confirmed, a blue label will appear on the chart with a price. A line is then drawn from the bar at which the event occurred and is extended to each subsequent bar until the price is reached once more; thus concluding the event. Furthermore, red or green shading will be present to easily visually identify rug pull events on the chart and whether they are risks to the downside (red) or upside (green). RPD is broken down into 2 main types of events:
Active Event - These events are characterized by a red or green shading and a blue price line.
Dormant Event - These events do not have shading but are still identifiable via a blue price line. Active events that are superseded by newer events will become dormant.
Active events tend to have a higher chance to return to the initial price point and tend to arrive there quicker.
Dormant events have a slightly lower chance to return to the initial price point and may take longer to arrive there.
Please note:
This indicator has no way of telling the exact amount of time that will pass before the ticker returns to the identified price; however, in more cases than not - the ticker will return to that price within a reasonable amount of time relative to the timeframe you are viewing.
There is a small chance any single event will never conclude. These are anomalies and do occur on occasion.
Using RPD alongside tools such as the RSI, Anchored VWAP, or other trend-based indicators will help determine when the ticker's price might be about to pivot and head back towards the identified price point.
Seeing is Believing:
SPY 1D downside rug-pull
----------------------------------------------
AAPL 15s downside and upside rug-pulls
----------------------------------------------
AMD 2D downside rug-pull
----------------------------------------------
VIX 1h downside and upside rug-pulls
Want to see more? Check out my recent Ideas for more examples of the Rug Pull Detector in action.
Disclaimer:
Any information in relation to the Rug Pull Detector does not constitute any financial, investment, or trading advice. Trade or invest at your own risk.

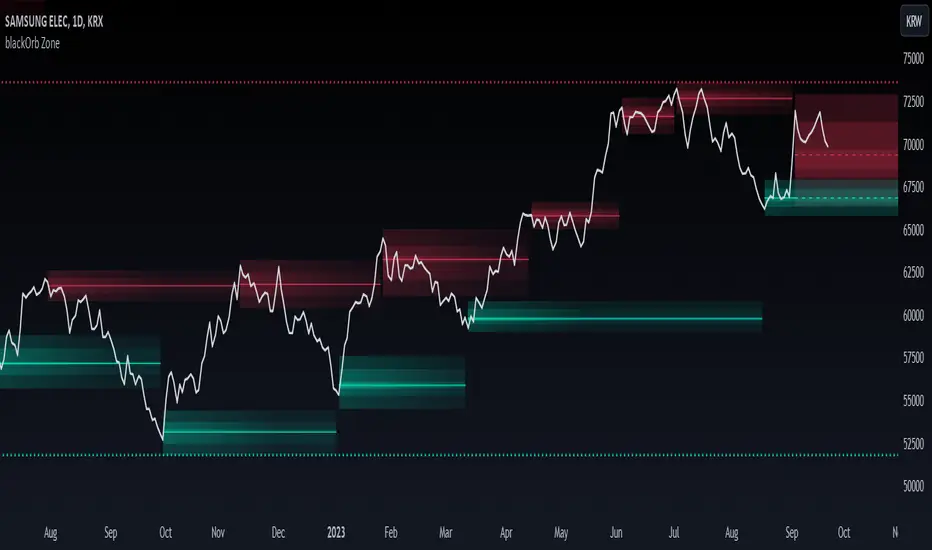
blackOrb ZoneBuying near the bottom and selling near the peak can be a challenging trading approach. However, it all begins with the ability to identify these essential zones. This indicator is targeting support and resistance with heightened accuracy. It utilizes features like:
I. Multi-Level Weighting for Enhanced Support and Resistance Zones
II. Vertical Zone Range Adjustment for Enhanced Price Level Identification
III. High-Time Frame for Solid Macro Validation
IV. Projection Function for Informed Trade Management
V. Automatic Level Identification for Pinpointing Potential Order Positions
VI. Customizable Pivot Analysis for Accurate Zone Identifications
Technical Methodology
I. Multi-Level Weighting for Enhanced Support and Resistance Zones
Support and resistance are more accurately represented as wider zones rather than singular lines. In practical application, relevant support or resistance levels often converge around a central mean-weighted level within a zone.
This indicator visually represents these zones by calculating values from open, high, low, and close prices, accentuating them through varying opacities. Higher opacity within an area indicates a higher likelihood of it serving as a relevant support or resistance level.
Multiple mean options within the settings menu encompass weighted average calculations that utilize different combinations of price data within the relevant pivot analysis phase. This versatility allows users to target pertinent levels within a zone. For instance, when employing hlcc4 price data, the calculation is as follows:
mean_price_hlcc4 = (high + low + close + close) / 4
II. Vertical Zone Range Adjustment for Enhanced Price Level Identification
This feature enables users to precisely adjust the vertical zone range for price references within potential support or resistance phases. For instance, decreasing the reference setting results in a more granular validation within a narrower range. This creates vertically thinner zones with increased price level precision, although it may offer a less comprehensive perspective.
III. High-Time Frame for Solid Macro Validation
The indicator enhances pivot points, potentially in conjunction with high-time frame validation, to identify significant price zones with heightened confirmation strength driven by volume. Higher time frames provide more extensive volume verification, for instance, comparing the 4-hour to the 24-hour timeframe (a multiple of six).
This feature involves cross-referencing data from higher time frames, heightening the reliability of support and resistance zones and providing valuable insights into potential trading interest levels.
Technically, the indicator applies the identical rigorous analysis to both lower and higher time frames. This approach facilitates a more comprehensive perspective and aids in the clearer identification of overarching macro support and resistance levels, even when focusing on smaller timeframes. For instance, a potential support zone identified on the daily time frame can gain higher confidence when confirmed on a weekly chart.
IV. Projection Function for Informed Trade Management
The projection function visually extends the most recent analysis of support and resistance zones forward, in accordance with the user's configured parameters.
By displaying precise price values at these visualized support and resistance levels, this indicator offers valuable assistance in decision-making, particularly when planning real-time orders or when engaged in an active trade management phase (e.g., for the purpose of adjusting stop-loss levels post-entry).
Note: This function is based on historical data. It may not account for unforeseen market events. It's important to complement this feature with ongoing analysis of real-time market data.
V. Automatic Level Identification for Pinpointing Potential Order Positions
It is empirically observed that traders frequently position orders at price levels that conform to quantized values due to cognitive biases.*
Consequently, blackOrb Zone not only facilitates the identification of pertinent levels within a weighted zone but also features an "auto" functionality designed to analyze price dynamics in the proximity of these relevant levels. The objective is to identify discrete values in close vicinity, which exhibit a higher likelihood of serving as authentic support and resistance zones.
This processing approach assists traders in precisely locating the central mean-weighted level within a given zone and identifies proximate quantized levels.
Note: This method becomes especially relevant during phases of price retesting, where market participants converge, contributing to a further refinement of levels, indicative of an asymmetric balance between supply and demand.
*Source: Prof. Mitchell, Jason. "Clustering and Psychological Barriers: The Importance of Numbers." Journal of Futures Markets, vol. 21, no. 5, 2001, pp. 395-428.
VI. Customizable Pivot Analysis for Accurate Zone Identifications
The indicator employs pivot points to pinpoint key price zones where price dynamics could encounter buying or selling pressure.
Essential components of this method involve comparing time units both to the left and right within a designated phase of support or resistance, effectively defining the search range for pivotal points.
For instance, in the analysis below, the search is for the highest price point that hasn't been surpassed within a certain resistance zone in the last 10 time units to the left and 10 time units to the right:
ta.pivothigh(10, 10)
Potential Trade Management Applications of blackOrb Zone
- Reversal Trading : Robust support zones with bullish signals can indicate opportune moments for buying or long position entries, whereas confirmed resistance zones can be identified for selling or short position entries.
- Breakout Trading : Anticipating price surges as price breach support or resistance level. A resistance breakout can signal a bullish price dynamic, while a support breakdown may suggest a bearish price dynamic.
- Range Trading : In lateral sideways markets, users can capitalize on support zones for buying and resistance zones for selling, profiting from price fluctuations.
- Take-Profit Management : For buying or long positions, resistance zones can be identified to determine suitable take-profit levels either within or near these zones - for short positions, vice versa with support zones.
- Stop-Loss Management : For buying or long positions, support zones can be identified to determine appropriate stop-loss levels beneath these zones - for short positions, vice versa with resistance zones to determine stop-loss levels above these zones.
Note on Usability
blackOrb Zone can have synergies with blackOrb Price as both indicators combined can give a bigger picture for supporting comprehensive and multifaceted data-driven trading analysis.
This tool was meticulously created to serve as an additional frame for the seamless integration of other more granular trading indicators. This indicator isn't intended for standalone trading application. Instead, it is serving as a supplementary tool for orientation within broader trading strategies.
Irrespective of market conditions, it can harmonize with a wider range of trading styles and instruments / trading pairs / indices like Stocks, Gold, FX, EURUSD, SPX500, GBPUSD, BTCUSD and Oil.
Inspiration and Publishing
Taking genesis from the inspirations amongst others provided by TradingView Pine Script Wizard Kodify, blackOrb Zone is a multi-encompassing script meticulously forged from scratch. It aspires to furnish a comprehensive approach, borne out of personal experiences and a strong dedication in supporting the trading community. We eagerly await valuable feedback to refine and further enhance this tool.
K's Reversal Indicator IIIK's Reversal Indicator III is based on the concept of autocorrelation of returns. The main theory is that extreme autocorrelation (trending) that coincide with a technical signals such as one from the RSI, may result in a powerful short-term signal that can be exploited.
The indicator is calculated as follows:
1. Calculate the price differential (returns) as the current price minus the previous price.
2. the correlation between the current return and the return from 14 periods ago using a lookback of 14 periods.
3. Calculate a 14-period RSI on the close prices.
To generate the signals, use the following rules:
* A bullish signal is generated whenever the correlation is above 0.60 while the RSI is below 40.
* A bearish signal is generated whenever the correlation is above 0.60 while the RSI is above 60.

Fibonacci Ranges (Real-Time) [LuxAlgo]The "Fibonacci Ranges" indicator combines Fibonacci ratio-derived ranges (channels), together with a Fibonacci pattern of the latest swing high/low.
🔶 USAGE
The indicator draws real-time ranges based on Fibonacci ratios as well as retracements. Breakouts from a Fibonacci Channel are also indicated by labels, indicating a potential reversal.
Each range extremity/area can also be used as support/resistance.
🔶 CONCEPTS
Fibonacci Channels
Latest Fibonacci
Both, Latest Fibonacci and Fibonacci Channels , display different Fibonacci levels (labels not included in the code):
However, the 2 react in a totally different way.
🔹 Fibonacci Channels
2 conditions must be fulfilled until a Fibonacci Channel is displayed:
New swing high/low
close has to be between chosen limits/levels ( Break level )
As visual guidance, chosen Break levels are accentuated by 2 small gray blocks:
Once the channel is displayed, it will remain visible until x consecutive bars break out of the chosen Break level at closing time.
• x consecutive bars is set by Break count .
The amount of breaks is counted in the code. When the price, without breaking the user-set limit, closes back between the 2 levels, the count is reset to 0.
By enabling Channels and Shadows you can see previous channels (" Shadows ", which is always delayed with 1 bar)
Previous channels can be helpful in finding potential support/resistance areas, especially from large channel blocks
The more narrow Break levels are set the less chance the price closes between these 2 levels, and the quicker close breaks out.
In other words, narrow levels give fewer & smaller channels, broader levels give more & larger channels.
Note:
• swing settings: L & R
• Break count (x consecutive bars that close outside chosen levels to invalidate the Fibonacci Channel )
will also be of influence in displaying the channels.
• Show breaks enable you to visualize signals when there is a break:
• Alerts can also be set ( Break Down / Break Up )
🔹 Latest Fibonacci
This displays the Fibonacci levels between the latest swing high and swing low, independently from the Fibonacci Channel .
The Lastest Fibonacci can be helpful in detecting the current trend against the larger Fibonacci Channel .
🔶 SETTINGS
🔹 Swing Settings
L: set left of pivothigh / pivotlow
R: set right of pivothigh / pivotlow
🔹 Fibonacci Channels
Channel : Channel / Channels + Shadows / None
Break level
-0.382 - 1.382
0.000 - 1.000
0.236 - 0.764
0.382 - 0.618
Break count
🔹 Fibonacci
Toggle
Colours: [ -0.382 - 0 ], [ 0.236 - 0.382 ], [ 0.5 ], [ 0.618 - 0.764 ], [ 1 - 1.382 ]

Reversal Confirmations [QuantVue]The Reversal Confirmation Indicator is based on price action and looks to provide opportunities when price gets stretched.
The indicator works by finding the highest and lowest points over the user selected lookback period.
If price closes below the low of the highest bar or closes above the high of the lowest bar a possible reversion to the mean may occur and the indicator will plot a triangle and fire an alert.
This indicator works a reversion to the mean or to potentially time entries in trending markets.
Fully customizable settings:
🔹Lookback Period
🔹Colors
🔹Show / hide upper & lower channels
🔹Show / hide the mean
Give this indicator a BOOST and COMMENT your thoughts!
We hope you enjoy.
Cheers!

Percentile Based Trend StrengthThe "Percentile Based Trend Strength" (PBTS) calculates trend strength based on percentile values of high and low prices for various length periods and then identifies the current trend as either Bullish, Bearish, or N/A (No Trend). Here's a step-by-step explanation of the code:
Percentile Calculations:
For each specified length period (13, 21, 34, 55, 89, and 144 - Fibonacci numbers), the code calculates the 75th percentile of high prices (e.g., percentile_13H) and the 25th percentile of low prices (e.g., percentile_13L). These percentiles represent levels that prices need to exceed or fall below to indicate a strong trend.
Calculate Highest High and Lowest Low:
The highest high (75th percentile high price of longest length) and lowest low (25th percentile low price of longest length) for the longest length period (144) are calculated as highest_high and lowest_low. These values represent threshold price levels .
Trend Strength Conditions:
The code calculates various conditions to determine trend strength. For each percentile value and each length period, it checks if the percentile value is greater than the highest high (trendBull) or less than the lowest low (trendBear). These conditions are used to assess the strength of the bullish and bearish trends.
Count Bull and Count Bear:
The countBull and countBear variables count the number of bullish and bearish conditions met, respectively. These counts help evaluate trend strength.
Weak Bull and Weak Bear Count:
The code calculates the number of weak bullish and bearish conditions. Weak conditions occur when a percentile value falls within the range defined by the highest high and lowest low but doesn't meet the strong trend criteria.
Bull Strength and Bear Strength:
bullStrength and bearStrength are calculated based on the counts of bullish, bearish, weak bullish, and weak bearish conditions. These values represent the overall strength of the bullish and bearish trends.
Strong Bull and Bear Conditions:
These conditions occur when the 75th percentile of high prices (for bull conditions) or the 25th percentile of low prices (for bear conditions) exceeds or falls below the highest high or lowest low, respectively, for the specified length period.
Strong bull conditions indicate a strong upward trend, while strong bear conditions indicate a strong downward trend.
Strong conditions are indicative of more significant price movements and are considered as primary signals of trend strength.
Weak Bull and Bear Conditions:
Weak bull and bear conditions are more nuanced. They occur when the 75th percentile of high prices (for weak bull conditions) or the 25th percentile of low prices (for weak bear conditions) falls within the range defined by the highest high and lowest low for the specified length period.
In other words, prices are not strong enough to reach the extreme levels represented by the highest high or lowest low, but they still exhibit some bullish or bearish tendencies within that range.
Weak conditions suggest a less robust trend. They may indicate that while there is some bias toward a bullish or bearish trend, it is not as strong or decisive as in the case of strong conditions.
Current Trend Identification:
The current trend is determined by comparing bullStrength and bearStrength. If bullStrength is greater, it's considered a Bull trend; if bearStrength is greater, it's a Bear trend. If they are equal, the trend is identified as N/A (No Trend).
Displaying Trend Information:
The code creates a table to display the current trend, reversal probability (strength), count of bullish and bearish conditions, weak bullish and weak bearish counts, and colors the text accordingly.
Plotting Percentiles:
Finally, the code plots the percentile lines for visualization, with 20% transparency. It also plots the highest high and lowest low lines (75th and 25th percentile of the longest length 144) using their original colors.
In summary, this indicator calculates trend strength based on percentile levels of high and low prices for different length periods. It then counts the number of bullish and bearish conditions, factors in weak conditions, and compares the strengths to identify the current trend as Bullish, Bearish, or No Trend. It provides a table with trend information and visualizes percentile lines on the chart.

ATR Trend Reversal Zone indicatorThis indicator helps avoid taking reversal trades too close to the 21 EMA, which may fail since the market often continues its trend after retracing from the 21 EMA level. It does not generate a direct signal for reversal trades but rather indicates points where you can consider potential reversal trades based on your trading methodology
This script defines an indicator that calculates the 21 Exponential Moving Average (EMA) and the Average True Range (ATR) for a given period. It then computes the distance between the most recent closing price and the 21 EMA in terms of ATR units. If this distance is equal to or greater than 3 ATRs, a small green circle is plotted below the corresponding bar on the chart, indicating a potential reversal condition.
Baha'i Reversal Points [CC]The Baha'i Reversal Points is a custom creation that combines some of my favorite passions, creating stock indicator scripts and my faith. The Baha'i Faith believes in the oneness of God and all religions, and sees the number 9 as significant because that is the number of major world religions as well as the Baha'i symbol is a nine-pointed star. The number 19 is also seen as significant because in the Baha'i calendar, there are 19 months, and each month is made up of 19 days. Anyway, with all that being explained, I created these reversal points to find the points where the last 19 highs or lows are higher or lower, respectively than the previous high or low nine days ago. As with many indicators, this does have some hits and misses but does a pretty good job of finding reversal points based on these criteria.
There are a few different ways to analyze this data to determine when to buy or sell. I have set the default behavior for when we encounter the first time that the amount of highs or lows is greater than or equal to the length amount using a crossover or crossunder alert. You could also ignore the crossover or crossunder alerts and buy when the count is greater than or equal to the length, which can happen for extended periods depending on the underlying trend. Overall, buy when the buy label appears and sell when the sell label appears.
Let me know if there are any other custom indicators or scripts you would like to see me publish!

Reversal Candles UG [5ema]The indicator can be find 8 reversal candlestick patterns of bullish or bearish.
-----
How to build?
Based on available reversal patterns that was be share by a group trader.
With name: T1, T1S, T2, T2S, T3, T3S, T3 Pro, T3 Max.
Ex1 - T1 Bull Candles and T3 Bull Candles:
Ex2 - T2 Bull Candles:
Ex2 - T1S Bull Candles:
-----
How to use?
Combine with other indicators like MA, EMA, RSI, Support, Resistance,... to set up a trading strategy.
Make a Alert to get a notification when a reversal candles appear.
-----
This indicator is for reference only, you need your own method and strategy.
If you have any questions, please let me know in the comments.

Pro Supertrend CalculatorThis indicator is an adapted version of Julien_Eche's 'Pro Momentum Calculator' tailored specifically for TradingView's 'Supertrend indicator'.
The "Pro Supertrend Calculator" indicator has been developed to provide traders with a data-driven perspective on price movements in financial markets. Its primary objective is to analyze historical price data and make probabilistic predictions about the future direction of price movements, specifically in terms of whether the next candlestick will be bullish (green) or bearish (red). Here's a deeper technical insight into how it accomplishes this task:
1. Supertrend Computation:
The indicator initiates by computing the Supertrend indicator, a sophisticated technical analysis tool. This calculation involves two essential parameters:
- ATR Length (Average True Range Length): This parameter determines the sensitivity of the Supertrend to price fluctuations.
- Factor: This multiplier plays a pivotal role in establishing the distance between the Supertrend line and prevailing market prices. A higher factor value results in a more significant separation.
2. Supertrend Visualization:
The Supertrend values derived from the calculation are meticulously plotted on the price chart, manifesting as two distinct lines:
- Green Line: This line represents the Supertrend when it indicates a bullish trend, signifying an anticipation of rising prices.
- Red Line: This line signifies the Supertrend in bearish market conditions, indicating an expectation of falling prices.
3. Consecutive Candle Analysis:
- The core function of the indicator revolves around tracking successive candlestick patterns concerning their relationship with the Supertrend line.
- To be included in the analysis, a candlestick must consistently close either above (green candles) or below (red candles) the Supertrend line for multiple consecutive periods.
4.Labeling and Enumeration:
- To communicate the count of consecutive candles displaying uniform trend behavior, the indicator meticulously applies labels to the price chart.
- The positioning of these labels varies based on the direction of the trend, residing either below (for bullish patterns) or above (for bearish patterns) the candlestick.
- The color scheme employed aligns with the color of the candle, using green labels for bullish candles and red labels for bearish ones.
5. Tabular Data Presentation:
- The indicator augments its graphical analysis with a customizable table prominently displayed on the chart. This table delivers comprehensive statistical insights.
- The tabular data comprises the following key elements for each consecutive period:
a. Consecutive Candles: A tally of the number of consecutive candles displaying identical trend characteristics.
b. Candles Above Supertrend: A count of candles that remained above the Supertrend during the sequential period.
3. Candles Below Supertrend: A count of candles that remained below the Supertrend during the sequential period.
4. Upcoming Green Candle: An estimation of the probability that the next candlestick will be bullish, grounded in historical data.
5. Upcoming Red Candle: An estimation of the probability that the next candlestick will be bearish, based on historical data.
6. Tailored Configuration:
To accommodate diverse trading strategies and preferences, the indicator offers extensive customization options. Traders can fine-tune parameters such as ATR length, factor, label and table placement, and table size to align with their unique trading approaches.
In summation, the "Pro Supertrend Calculator" indicator is an intricately designed tool that leverages the Supertrend indicator in conjunction with historical price data to furnish traders with an informed outlook on potential future price dynamics, with a particular emphasis on the likelihood of specific bullish or bearish candlestick patterns stemming from consecutive price behavior.

Support & Resistance AI (K means/median) [ThinkLogicAI]█ OVERVIEW
K-means is a clustering algorithm commonly used in machine learning to group data points into distinct clusters based on their similarities. While K-means is not typically used directly for identifying support and resistance levels in financial markets, it can serve as a tool in a broader analysis approach.
Support and resistance levels are price levels in financial markets where the price tends to react or reverse. Support is a level where the price tends to stop falling and might start to rise, while resistance is a level where the price tends to stop rising and might start to fall. Traders and analysts often look for these levels as they can provide insights into potential price movements and trading opportunities.
█ BACKGROUND
The K-means algorithm has been around since the late 1950s, making it more than six decades old. The algorithm was introduced by Stuart Lloyd in his 1957 research paper "Least squares quantization in PCM" for telecommunications applications. However, it wasn't widely known or recognized until James MacQueen's 1967 paper "Some Methods for Classification and Analysis of Multivariate Observations," where he formalized the algorithm and referred to it as the "K-means" clustering method.
So, while K-means has been around for a considerable amount of time, it continues to be a widely used and influential algorithm in the fields of machine learning, data analysis, and pattern recognition due to its simplicity and effectiveness in clustering tasks.
█ COMPARE AND CONTRAST SUPPORT AND RESISTANCE METHODS
1) K-means Approach:
Cluster Formation: After applying the K-means algorithm to historical price change data and visualizing the resulting clusters, traders can identify distinct regions on the price chart where clusters are formed. Each cluster represents a group of similar price change patterns.
Cluster Analysis: Analyze the clusters to identify areas where clusters tend to form. These areas might correspond to regions of price behavior that repeat over time and could be indicative of support and resistance levels.
Potential Support and Resistance Levels: Based on the identified areas of cluster formation, traders can consider these regions as potential support and resistance levels. A cluster forming at a specific price level could suggest that this level has been historically significant, causing similar price behavior in the past.
Cluster Standard Deviation: In addition to looking at the means (centroids) of the clusters, traders can also calculate the standard deviation of price changes within each cluster. Standard deviation is a measure of the dispersion or volatility of data points around the mean. A higher standard deviation indicates greater price volatility within a cluster.
Low Standard Deviation: If a cluster has a low standard deviation, it suggests that prices within that cluster are relatively stable and less likely to exhibit sudden and large price movements. Traders might consider placing tighter stop-loss orders for trades within these clusters.
High Standard Deviation: Conversely, if a cluster has a high standard deviation, it indicates greater price volatility within that cluster. Traders might opt for wider stop-loss orders to allow for potential price fluctuations without getting stopped out prematurely.
Cluster Density: Each data point is assigned to a cluster so a cluster that is more dense will act more like gravity and
2) Traditional Approach:
Trendlines: Draw trendlines connecting significant highs or lows on a price chart to identify potential support and resistance levels.
Chart Patterns: Identify chart patterns like double tops, double bottoms, head and shoulders, and triangles that often indicate potential reversal points.
Moving Averages: Use moving averages to identify levels where the price might find support or resistance based on the average price over a specific period.
Psychological Levels: Identify round numbers or levels that traders often pay attention to, which can act as support and resistance.
Previous Highs and Lows: Identify significant previous price highs and lows that might act as support or resistance.
The key difference lies in the approach and the foundation of these methods. Traditional methods are based on well-established principles of technical analysis and market psychology, while the K-means approach involves clustering price behavior without necessarily incorporating market sentiment or specific price patterns.
It's important to note that while the K-means approach might provide an interesting way to analyze price data, it should be used cautiously and in conjunction with other traditional methods. Financial markets are influenced by a wide range of factors beyond just price behavior, and the effectiveness of any method for identifying support and resistance levels should be thoroughly tested and validated. Additionally, developments in trading strategies and analysis techniques could have occurred since my last update.
█ K MEANS ALGORITHM
The algorithm for K means is as follows:
Initialize cluster centers
assign data to clusters based on minimum distance
calculate cluster center by taking the average or median of the clusters
repeat steps 1-3 until cluster centers stop moving
█ LIMITATIONS OF K MEANS
There are 3 main limitations of this algorithm:
Sensitive to Initializations: K-means is sensitive to the initial placement of centroids. Different initializations can lead to different cluster assignments and final results.
Assumption of Equal Sizes and Variances: K-means assumes that clusters have roughly equal sizes and spherical shapes. This may not hold true for all types of data. It can struggle with identifying clusters with uneven densities, sizes, or shapes.
Impact of Outliers: K-means is sensitive to outliers, as a single outlier can significantly affect the position of cluster centroids. Outliers can lead to the creation of spurious clusters or distortion of the true cluster structure.
█ LIMITATIONS IN APPLICATION OF K MEANS IN TRADING
Trading data often exhibits characteristics that can pose challenges when applying indicators and analysis techniques. Here's how the limitations of outliers, varying scales, and unequal variance can impact the use of indicators in trading:
Outliers are data points that significantly deviate from the rest of the dataset. In trading, outliers can represent extreme price movements caused by rare events, news, or market anomalies. Outliers can have a significant impact on trading indicators and analyses:
Indicator Distortion: Outliers can skew the calculations of indicators, leading to misleading signals. For instance, a single extreme price spike could cause indicators like moving averages or RSI (Relative Strength Index) to give false signals.
Risk Management: Outliers can lead to overly aggressive trading decisions if not properly accounted for. Ignoring outliers might result in unexpected losses or missed opportunities to adjust trading strategies.
Different Scales: Trading data often includes multiple indicators with varying units and scales. For example, prices are typically in dollars, volume in units traded, and oscillators have their own scale. Mixing indicators with different scales can complicate analysis:
Normalization: Indicators on different scales need to be normalized or standardized to ensure they contribute equally to the analysis. Failure to do so can lead to one indicator dominating the analysis due to its larger magnitude.
Comparability: Without normalization, it's challenging to directly compare the significance of indicators. Some indicators might have a larger numerical range and could overshadow others.
Unequal Variance: Unequal variance in trading data refers to the fact that some indicators might exhibit higher volatility than others. This can impact the interpretation of signals and the performance of trading strategies:
Volatility Adjustment: When combining indicators with varying volatility, it's essential to adjust for their relative volatilities. Failure to do so might lead to overemphasizing or underestimating the importance of certain indicators in the trading strategy.
Risk Assessment: Unequal variance can impact risk assessment. Indicators with higher volatility might lead to riskier trading decisions if not properly taken into account.
█ APPLICATION OF THIS INDICATOR
This indicator can be used in 2 ways:
1) Make a directional trade:
If a trader thinks price will go higher or lower and price is within a cluster zone, The trader can take a position and place a stop on the 1 sd band around the cluster. As one can see below, the trader can go long the green arrow and place a stop on the one standard deviation mark for that cluster below it at the red arrow. using this we can calculate a risk to reward ratio.
Calculating risk to reward: targeting a risk reward ratio of 2:1, the trader could clearly make that given that the next resistance area above that in the orange cluster exceeds this risk reward ratio.
2) Take a reversal Trade:
We can use cluster centers (support and resistance levels) to go in the opposite direction that price is currently moving in hopes of price forming a pivot and reversing off this level.
Similar to the directional trade, we can use the standard deviation of the cluster to place a stop just in case we are wrong.
In this example below we can see that shorting on the red arrow and placing a stop at the one standard deviation above this cluster would give us a profitable trade with minimal risk.
Using the cluster density table in the upper right informs the trader just how dense the cluster is. Higher density clusters will give a higher likelihood of a pivot forming at these levels and price being rejected and switching direction with a larger move.
█ FEATURES & SETTINGS
General Settings:
Number of clusters: The user can select from 3 to five clusters. A good rule of thumb is that if you are trading intraday, less is more (Think 3 rather than 5). For daily 4 to 5 clusters is good.
Cluster Method: To get around the outlier limitation of k means clustering, The median was added. This gives the user the ability to choose either k means or k median clustering. K means is the preferred method if the user things there are no large outliers, and if there appears to be large outliers or it is assumed there are then K medians is preferred.
Bars back To train on: This will be the amount of bars to include in the clustering. This number is important so that the user includes bars that are recent but not so far back that they are out of the scope of where price can be. For example the last 2 years we have been in a range on the sp500 so 505 days in this setting would be more relevant than say looking back 5 years ago because price would have to move far to get there.
Show SD Bands: Select this to show the 1 standard deviation bands around the support and resistance level or unselect this to just show the support and resistance level by itself.
Features:
Besides the support and resistance levels and standard deviation bands, this indicator gives a table in the upper right hand corner to show the density of each cluster (support and resistance level) and is color coded to the cluster line on the chart. Higher density clusters mean price has been there previously more than lower density clusters and could mean a higher likelihood of a reversal when price reaches these areas.
█ WORKS CITED
Victor Sim, "Using K-means Clustering to Create Support and Resistance", 2020, towardsdatascience.com
Chris Piech, "K means", stanford.edu
█ ACKNOLWEDGMENTS
@jdehorty- Thanks for the publish template. It made organizing my thoughts and work alot easier.

Reversal Signal [5ema]This indicator can find a reversal point when the price is oversold, the breakout is far from the EMA.
-----
How to calculate?
Find the minimum (maximum) value on five EMAs: 20, 50, 200, 460, 610.
Calculate the number left bars with condition that is completely above (below) the min (max) EMA line.
The signal bar is Engulfing bar.
-----
How to appear signal?
Have signal bar cross the min (max) EMA line.
The number left bars that is completely above (below) the min (max) EMA line greater than inputting.
-----
How to use?
Can change the value of EMAs to suitable with symbols and strategy.
Can change the number left bars to suitable with symbols and strategy.
Can see the trend cloud to recognize the trending.
Review a strategy when appear the signal on chart.
Make the alert when appear the signal.
Can choose only Buy or Sell signal.
-----
This indicator is for reference only, you need your own method and strategy.
If you have any questions, please let me know in the comments.

Trend Change DetectorThe trend change detector oscillator is a tool designed to help traders identify the current trend direction paired with the potential reversal zones.
The oscillator is made of multiple parts:
- The colored histogram, that displays the current long-term trend direction (long if above 0, short if below)
- The trend line, which shows the price in relation to the fair value of the current trend
- The reversal zones, which are the area that alarms the traders that the price might reverse soon after having touched them
The indicator can work with three different inputs. In the Source panel, you can choose between "Price", "Price and Volume" and "Ponderated Volume". The price input uses only the price, the price and volume use the average between the price and the ponderated volume, and the ponderated volume shows the indicator working with volume data, with formulas such as the On Balance Volume and the Accumulation-Distribution line.
This indicator can be used both for trend following technique, using the cross of the trend line with the 0-line as signals in conjunction with the bias given by the histogram, and for mean reversal technique thanks to the reversal zones that allow traders to identify potential tops and bottoms.

QQE Weighted Oscillator [LuxAlgo]The QQE (Quantitative Qualitative Estimation) Weighted Oscillator improves on its original version by weighting the RSI based on the indications given by the trailing stop, requiring more effort in order for a cross with the trailing stop to occur.
🔶 USAGE
The QQE Weighted Oscillator is comprised of a smoothed RSI oscillator and a trailing stop derived from this same RSI. The oscillator can be used to indicate whether the market is overbought/oversold as well as an early indication of trend reversals thanks to the leading nature of the RSI.
Using higher Factor values will return a longer-term trailing stop.
Like with a regular RSI divergence can be indicative of a reversal.
Further weighting will control how much "effort" is required for the trailing stop to cross the RSI. For example. For example, an RSI above the trailing stop will require a higher degree of negative price variations in order for a potential cross to occur when using higher weights.
This can cause higher weightings to return more cyclical and smoother results.
🔶 SETTINGS
Length: Length of the RSI oscillator.
Factor: Multiplicative factor used for the trailing stop calculation.
Smooth: Degree of smoothness of the RSI oscillator.
Weight: Degree of weighting used for the RSI calculation.

Swing Ranges [ChartPrime]Swing Ranges is an indicator designed to provide traders with valuable insights into swing movements and real-time support and resistance (SR) levels. This tool detects price swings and plots boxes around them, allowing traders to visualize the market dynamics efficiently. The indicator's primary focus is on real-time support and resistance levels, empowering traders to make well-informed decisions in dynamic market conditions.
Key Features:
Swing Box Visualization:
Swing Ranges excels at detecting swings in the price data and visually representing them with boxes on the price chart. This enables traders to quickly identify swing ranges, essential for understanding market trends and potential reversal points. VWAP POCs are also provided giving areas of high activity in each block.
Real-Time Support and Resistance Levels:
The core feature of Swing Ranges is its real-time support and resistance levels. These levels are dynamically calculated based on the volume-weighted data for each specific range. The indicator displays the strength of support and resistance zones with percentage bars, indicating the ratio between bullish and bearish volume. This real-time information empowers traders to assess the strength and significance of each SR level, enhancing their ability to execute well-timed trades.
ATR (Average True Range) Value:
Swing Ranges also includes an ATR value label, which shows the Average True Range for the selected period. ATR aids traders in understanding market volatility, enabling them to set appropriate stop-loss and take-profit levels for their trades.
VWAP (Volume Weighted Average Price) Information:
Traders c an readily access the VWAP value through the indicator's label. VWAP provides insights into the average price at which an asset has been traded, helping traders identify potential fair value areas and market trends.
Price Difference Percentage:
Swing Ranges displays the percentage difference between the high and low of each swing. This information allows traders to gauge the magnitude of price movements and assess potential profit targets more effectively.
The indicator also has a NV value. If the NV is high e.g. 10% or more there is indecision in the market and the market is trying to remain in a given range.
Settings Inputs:
1. Length Control:
The Length setting input in Swing Ranges allows traders to adjust the sensitivity of the indicator to detect swings. Traders can customize the length based on their trading strategies and timeframes.
2. ATR Period Adjustment:
The ATR Period input allows traders to fine-tune the calculation period for the Average True Range. This feature enables traders to adapt the indicator to different market conditions and asset classes.
Swing Ranges: Real-Time Support and Resistance Indicator is a comprehensive tool that combines swing visualization with dynamic support and resistance levels. By focusing on real-time SR levels, this indicator equips traders with the essential information needed to make confident trading decisions in ever-changing market conditions.

Price breakout and reversal [TCS] | PAThis indicator is designed to identify potential breaks and reversals in price movements for a financial instrument.
The indicator displays several elements to assist users in spotting specific market conditions:
1. High and Low Pivots : The indicator marks the highest and lowest points on the price chart within a customizable lookback period. These pivots represent important turning points in the price movement and serve as reference levels for potential breakouts and reversals.
2. Fair Value Line : A horizontal line is drawn at the midpoint between the high and low pivots. This line represents the "fair value" based on the recent price action. Traders may consider this level as a reference for evaluating the price's deviation from its average value.
3. Bullish Breakouts : When the closing price of the financial instrument crosses above the high pivot the indicator identifies a potential bullish breakout. This suggests a possible buying opportunity.
4. Bearish Breakouts : Conversely, a bearish breakout is identified when the closing price crosses below the low pivot. This may indicate a selling opportunity.
5. Fair Value Breakouts : In addition to regular breakouts, the indicator can detect breakouts based on the fair value line. If the closing price crosses above or below the fair value line, it may signal a fair value breakout, indicating the price's potential return to its average level.
6. Reversals : Reversal patterns are essential in technical analysis. The indicator identifies potential bullish and bearish reversals .
The indicator enhances its visual signals with geometric shapes (triangles and diamonds) placed above or below the price bars to represent different types of breakouts and reversals.
Moreover, the indicator can be configured to send alerts to the user when any of these specific events occur, helping traders stay informed and respond promptly to potential trading opportunities.
Please note that this code is for educational purposes only and should not be used for trading without further testing and analysis.

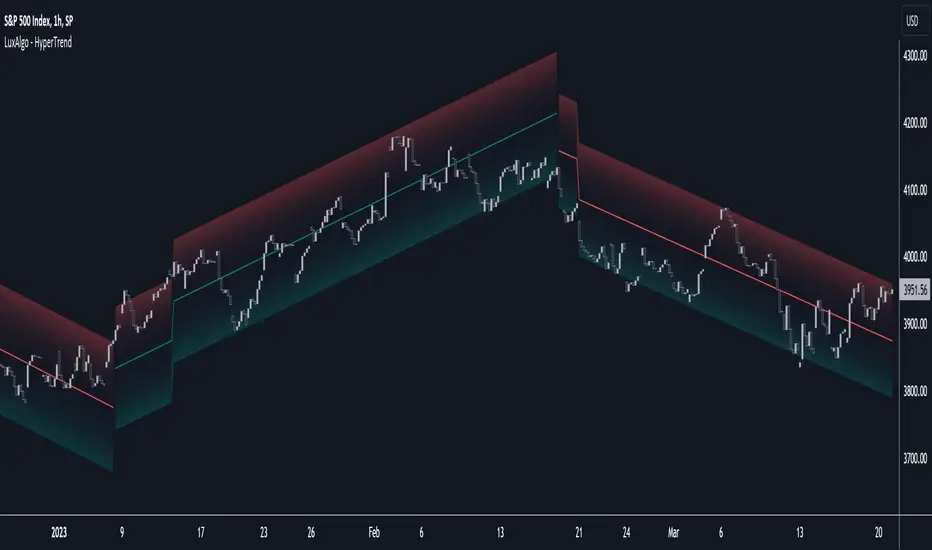
HyperTrend [LuxAlgo]The HyperTrend indicator aims to provide a real-time estimate of an underlying linear trend in the price. Support and resistance extremities are constructed from this estimate which can provide trade opportunities within the overall trend.
Most tools that return lines on a chart are either subject to backpainting or repainting. We aimed to provide a reliable real-time method to estimate linear trends in the price, enhancing traders' decision making processes when it comes to trading trends in price, hence the term 'HyperTrend'.
🔶 USAGE
Users can use the HyperTrend to easily determine the trend direction in the price, with an average sloping upward indicating an uptrend, and an average sloping downward indicating a downtrend.
The channels upper extremity can act as a resistance, while the lower extremity can act as a support. Contact with candle wicks can signal timely reversals/retracements.
Using a higher "Multiplicative Factor" value will return less frequent new channels, and is suitable to analyze longer-term trends. The slope settings on the other end allow us to control the slope of the returned channels, with higher values returning flatter results (similar to our previously posted predictive ranges).
🔹 Channel Average
The channel average can return an estimate of the current (and future) trend in the price, the chart below shows an interval where a linear regression is displayed alongside the channel average:
Unlike the linear regression, the average does not have any lookahead bias, this of course comes at the price of accuracy in most cases.
Users can also use this average as a support or resistance. The breakout of a TC average that has been tested multiple times can be considered more significant in suggesting a trend reversal.
🔶 SETTINGS
Multiplicative Factor: Control the allowed degree of deviation of the price from the average line. Higher values will return less frequent new channels.
Slope: Controls the steepness of the returned lines. Higher values will return flatter results.
Width %: Width percentage of the channel. Lower results will return narrower channels.