Average True Range - without open barBasic ATR without the current open bar in progress, it calculates the closed bars within the chosen ATR PeriodIndicateur Pine Script®par TVUser388576825
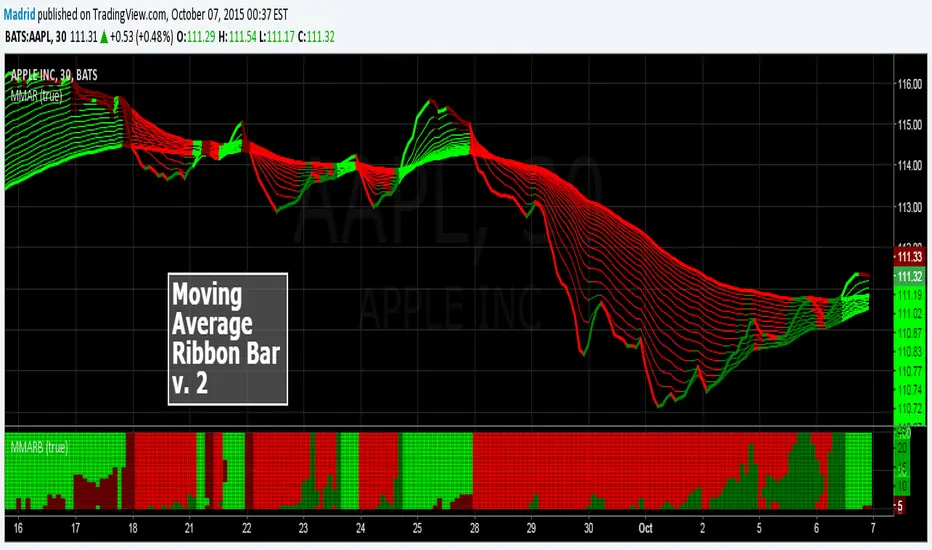
Madrid MA Ribbon Bar v2This script is the second version of the Moving average Ribbon Bar, a companion study of the MA Ribbon. In this version the display is changed, instead of lines, it display the results in stacked bars, making it more user friendly and allowing it to be expanded or contracted without loosing visual continuity. Indicateur Pine Script®par MadridMis à jour 2424 4.9 K
Binary option trading by two previous barsThis simple script uses the idea of inertia of the market. if 2 previous candles have the same color, current meant to have that too. Following this signal is equal to buying a binary option on the start of the bar (week here). Signals are shown as arrows on the series. The color of the bar shows the outcome of the current option: yellow is success, black is failure. The same outcomes are at the bottom of the chart. The blue line is the total revenue of all options so far. Can be used as template for strategy simulation.Indicateur Pine Script®par radixvinni1010 1.3 K
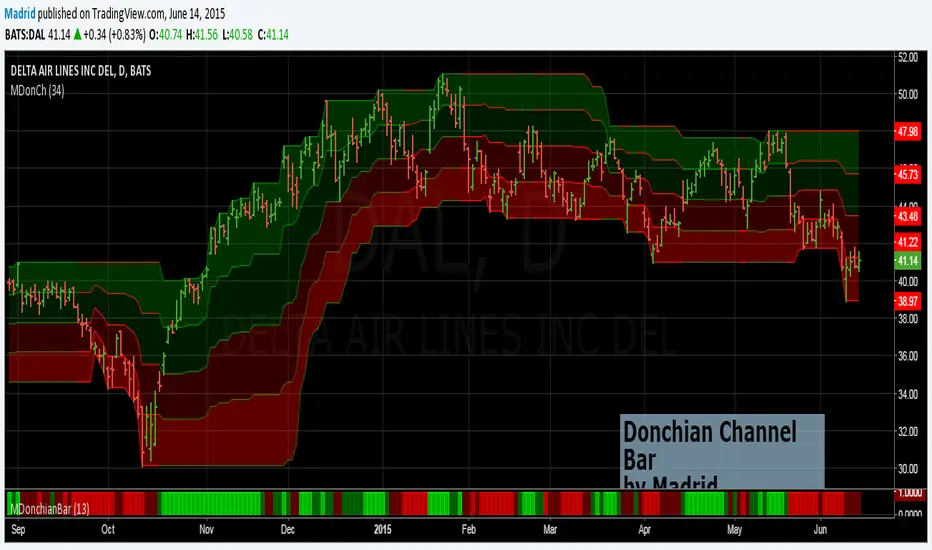
Madrid Donchian BarThis is the companion bar of the Donchian Channel study. This bar at the bottom of the screen depicts the detrended position of the closing price. This is useful to reduce clutter on the screen and locate the position of the closing price at a glance. Lime ; Extremely Bullish Green : Bullish Maroon : Bearish Red : Extremely BearishIndicateur Pine Script®par Madrid11495
2 Bar Strategy + Fib EntryCustom indicator for my 2 bar strategy, bullish or bearish waring setup signal included and entry zone Indicateur Pine Script®par dansullivan3306
VJ TRIGGER BARTrigger Bar in the consolidation predicting a breakoutIndicateur Pine Script®par velprakashj1
OU Depth of Market (DOM) Including Per Bar Volume ShapesWork in progress visualizing the volume per bar of a security, set for 15 second timeframe for ES NQ futures. Indicateur Pine Script®par CallMeOptionPls0
Fair Value Gap Bar Locked Signals Fair Value Gap – Bar Locked + Signals (Stable)This is a clean Smart Money Concepts (SMC) indicator focused exclusively on detecting and tracking Fair Value Gaps (FVGs) with automatic mitigation tracking and trade signals. What It DoesIdentifies imbalances in price action (gaps where there's no trading overlap) and tracks them until they're "filled" (mitigated). These gaps represent areas where institutional orders may return to fill the inefficiency.Core ConceptsIndicateur Pine Script®par jmslimus6
Volume footprint 15 bars by MH RaajThis multi volume data indicator is as same as the Volume footprint of previous version just difference is, it shows only the data of last 15 bars in classic mode of volume footprint.Indicateur Pine Script®par MH_Raaj26
Engulfing + Pinbar + Inside BarThis indicator combines three powerful candlestick patterns in one tool: Engulfing Candles (Bullish & Bearish) Pinbars / Hammers (Reversal signals) Inside Bars (Consolidation + breakout setup) Each pattern can be enabled or disabled individually through the settings panel. Candle colors and labels help you quickly identify strong price action zones.Indicateur Pine Script®par MG_108Mis à jour 8
Inside Bar by bilalThis indicator will display inside bar candle to represent the value candle of the zone for any timeframe.Indicateur Pine Script®par bilalbaazworld1
Gold Pin Bar Pivot Alerts - FixedThis script is designed for the high volatility of Gold (XAU/USD). It identifies Pin Bars with body less than 30% of the candle's total range, and the candle occuring at a structural Pivot High or Pivot LowIndicateur Pine Script®par olushekun43
Surprise volume bar This is to detect the bar that is 3 times over the 60 average volume.Indicateur Pine Script®par emhwang36
GKZ 3-Bar Compression ReversalThis one is NOT an indicator but a strategy Simple rules Weekly close is above 30 EMA weekly for atleast 3-5 weeks ( keeping fans of Stan Weinstein happy) following assumptions today is Day T , SO T-2 was a red candle T-1 was a green candle but its high is lower than T-2 and its close is above T-2 T ( confirmation candle): T's high is higher than T-2 and T-1 and its close is higher than T-1 aiyyo, this is so confusing...how do i find such stocks G? Drummmrolllllll : chartink.comStratégie Pine Script®par GKLDH69812
Volume Breakout % [No Bar Color]This indicaot use for all user when in 5 min chat. all time fream not wrok.Vol bar numbser of calculation .Indicateur Pine Script®par DEVOLS1
Kai simple mother bar Identify mother bar break candles based on price action and above-average volume, helping to detect breakout points in the direction of the trend as well as potential reversals.Indicateur Pine Script®par SimpleV3
Weekly Inside Bar Scannerthis is a screened for weekly inside bar ff f fd d dg d gIndicateur Pine Script®par romaninet0
Market Structure [BOS/ChoCh Line & Bar-Chart]Overview A comprehensive market structure indicator that identifies Break of Structure (BOS) and Change of Character (CHoCH) patterns - essential concepts in Smart Money trading methodology. ━━━━━━━━━━━━━━━━━━━━━━━━━━━━━━━━━━━━━━━━ 🔹 KEY FEATURES Two detection modes: Swing-based (High/Low) and Line Chart-based (Close) Automatic HH/LL/LH/HL labeling with price and percentage change BOS (Break of Structure) for trend continuation CHoCH (Change of Character) for trend reversals Market Structure Candle Coloring (MSC) Optional Line Chart overlay Fully customizable colors and display options Built-in alerts for BOS and CHoCH events ━━━━━━━━━━━━━━━━━━━━━━━━━━━━━━━━━━━━━━━━ 🔹 DETECTION MODES Swings Mode Uses candlestick highs and lows to identify swing points. This is the traditional approach and works well for most trading styles. Line Chart Mode Uses closing prices only to identify peaks and troughs - similar to how a line chart displays price action. This mode filters out wicks and can provide cleaner structure identification. ━━━━━━━━━━━━━━━━━━━━━━━━━━━━━━━━━━━━━━━━ 🔹 STRUCTURE LABELS HH (Higher High) - Price made a new high above the previous high → Bullish HL (Higher Low) - Price made a higher low → Bullish LH (Lower High) - Price failed to make a new high → Bearish LL (Lower Low) - Price made a new low below the previous low → Bearish ━━━━━━━━━━━━━━━━━━━━━━━━━━━━━━━━━━━━━━━━ 🔹 BOS vs CHoCH BOS (Break of Structure) A continuation signal. Occurs when price breaks a key level in the direction of the current trend. Bullish BOS: Price closes above the last swing high during an uptrend Bearish BOS: Price closes below the last swing low during a downtrend CHoCH (Change of Character) A reversal signal. Occurs when price breaks the key level that would invalidate the current trend. Bullish CHoCH: During a downtrend, price closes above the high that produced the last Lower Low Bearish CHoCH: During an uptrend, price closes below the low that produced the last Higher High ━━━━━━━━━━━━━━━━━━━━━━━━━━━━━━━━━━━━━━━━ 🔹 CANDLE COLORING (MSC) When enabled, candles are colored based on the current market structure trend: Bullish trend: Candles colored in the bullish color Bearish trend: Candles colored in the bearish color Trend-conforming candles appear solid, counter-trend candles appear faded Note: For best results, go to Chart Settings → Symbol and set Body/Border/Wick colors to transparent. ━━━━━━━━━━━━━━━━━━━━━━━━━━━━━━━━━━━━━━━━ 🔹 SETTINGS Market Structure Settings Detection Mode - Choose between Swings or Line Chart Swing Length - Sensitivity of pivot detection (higher = less sensitive) Show BOS / Show CHoCH - Toggle display of each pattern type Line Chart Display Show Line Chart - Display the close-based line overlay Line Chart Color / Width - Customize appearance Labels & Extra Data Show HH/LL/LH/HL Labels - Toggle swing point labels Show Price at Pivots - Display price values Show % Change - Display percentage change between swings ━━━━━━━━━━━━━━━━━━━━━━━━━━━━━━━━━━━━━━━━ 🔹 ALERTS The indicator includes alerts for: Bullish/Bearish BOS Bullish/Bearish CHoCH ━━━━━━━━━━━━━━━━━━━━━━━━━━━━━━━━━━━━━━━━ 🔹 USAGE TIPS Use higher Swing Length values on higher timeframes to filter noise CHoCH signals potential trend reversals - consider waiting for confirmation BOS signals trend continuation - can be used for entries in the trend direction Combine with other confluence factors like support/resistance, order blocks, or volume analysis The Line Chart mode can help identify structure on volatile instruments where wicks create noise For best display of bar coloring set Visual Order -> Bring to Front Indicateur Pine Script®par trading-guide18
Fibonacci Fibonacci automatic drawing - Last 144 barFibonacci automatic drawing: It automatically plots Fibonacci based on the last 144 bars. According to the drawing rules, it calculates itself from bottom to top and from top to bottom. This will answer the most challenging questions about drawing the right thing. If 144 bar is not reached, it draws using manual input. This will be a useful and practical perspective. This is for those who want to see the most valuable Fibonacci values on a chart.Indicateur Pine Script®par Trend_AS2290
Hammer Strategy (CLOSE ON NEXT BAR) [WORKING]Adjustable hammer and inverted hammer candle Ham? INV? is the hammer Entry on HAM, INV OR HAM?, INV? close next barStratégie Pine Script®par jonfuss841116
Volatile bar founderIt is very easy to find volatile bars with this simple and wonderful script.Indicateur Pine Script®par ashru19899
ZKNZCN Önceki Bar H/L (Ayrı Kontrol)Bir önceki barın high & low noktalarını çizgi halinde görmeyi sağlar.Indicateur Pine Script®par ahmet_dogruu9
5-Bar BreakoutThis indicator shows if the price is breaking out above the high or the low of the previous 5 barsIndicateur Pine Script®par sjibreelMis à jour 5