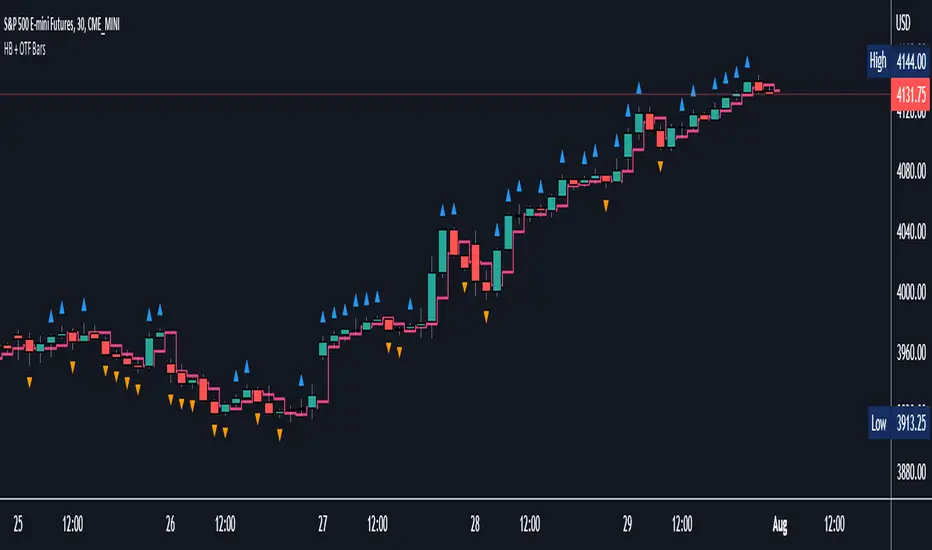
MACD-V as Columns BarI use MACD-V as Columns Bar and including the signal line Not use MACD-V - Signal Line as Histogram Enjoy!Indicateur Pine Script®par ArmAkharin4418
chart visible bar timeWith the latest added features chart.left_visible_bar_time and chart.right_visible_bar_time it is now possible to place label.new() positions at the equivalent of 'location.top' and 'location.bottom' The following are examples of functions which enables to find the visible chart highest/lowest bars: highest_visible_chart() => var float highs = na highs := time == chart.left_visible_bar_time ? high : time > chart.left_visible_bar_time and high > highs ? high : highs lowest_visible_chart() => var float lows = na lows := time == chart.left_visible_bar_time ? low : time > chart.left_visible_bar_time and low < lows ? low : lows In this example labels are plotted when a sma crosses another sma Also combined with 3 boxes, scrolling gives insights how the features work To all who make Tradingview the way it is, lots and lots of thanks! Cheers!Indicateur Pine Script®par fikiraMis à jour 66339
MTF CCI BarOVERVIEW This indicator shows whether Commodity Channel Index (CCI) is above or below 0, represented by a bar. This indicator is compatible with MTF. CONCEPTS What do you want to know about market analysis? Do you want a hard analysis? You can look for it. All I want to know is whether the commonly known technical analysis is 'UP' or 'DOWN'. All I want to know is whether the current market price is going up or down. Not only for the current, but also for the monthly, weekly, and daily status. I want to make a decision in a moment. Without even thinking about it. That is why I created a color-coded bar indicator to show the status. No need to frown anymore. DETAILS CCI is a momentum oscillator used in technical analysis primarily to identify overbought and oversold levels by measuring an instrument's variations away from its statistical mean. For this indicator, I have removed the concept of overbought and oversold. 0 <= CCI green 0 > CCI red However, with future upgrades, I would like to color-code it for overbought and oversold conditions as well.Indicateur Pine Script®par FX_KEYSTONE2290
TableBarValues_v4It give you the absolute value of bar changes for different period of tims (33, 100, 200) AND the max barchange ont the same period. Can be added in v4 in all codes. Stupid but useful. You can add it to any v4 script. The location of the table can be changed easily Inspired from the tradingview community. Don't forget to hydrate. @MagnummIndicateur Pine Script®par magnumm8
FiboBars ExtendedA trend indicator FiboBars Extended , the main purpose of which is to confirm the trend and cut off market noise. In his logic, he uses the Fibonacci sequence. Two settings are used to account for noise suppression accuracy: Period - number of calculation bars Level - Fibonacci number selection Indicateur Pine Script®par CapitalizatorUA2266
Wick Pressure/Close point inside the barCalculates the strength of closing within the bar. Higher the closing within the high/low points of the bar, greater is the buying strength and vice versa. HMA of the score for the input period is then divided by standard deviation for smoothing. Works well for higher timeframes with a larger data set. Compliments other indicators. Input period should be changed for various timeframes. Shorter the timeframe, the longer the input period is preferable.Indicateur Pine Script®par venkatadora1152
Alpha BarsTo understand if your stock is behaving strongly or poorly, it is imperative to compare its daily changes to that of the S&P 500. To display true Relative Strength, your stock must outperform the S&P 500 by more than its BETA would suggest. The ALPHA Bars tool shows whether the stock outperforms its benchmark and what positive or negative Alpha it returned for the day. Note, that it does not factor in interest rates as the standard model does. To learn more about how Alpha can be used in stock analysis, please visit: www.carusoinsights.com Note that you can change the benchmark symbol from the S&P 500 to whatever benchmark is relevant for your analysis. Indicateur Pine Script®par CarusoInsights1111895
Zigzag Volume BarsBack to my favourite topic - Zigzags. Here is an indicator which can help you visualise volume data on Zigzag swing highs and lows. Settings are pretty simple and provides variety of display options Display options are as demonstrated in the chart has following main types. Regular Plus/Minus - Stacked Plus/Minus - Overlapping Plus/Minus - Opposite Sides Apart from the main display types, stacked display has several sub-types which determine whether to place green bar below red or the other way around. Snapshot below shows example of each type. Indicateur Pine Script®par Trendoscope3232625
MOFX Inside BarInside Bar Indicator, shows when a candle is contained within the previous candle.Indicateur Pine Script®par jackgreenwood3015
Inside Breakout - inside bar - PerQuantumCoin Premium IndicatorHOW IT WORKS: - The Inside Breakout gives signals on the chart on the breakout of inside bar chart pattern; - It allows to trade trend or counter-trend signals; - Computes intrinsic values to access the strength of the Buy/Sell signal; - Allows users to adjust their own settings, adapting the signals produced; - These signals can be also set up as Alerts; - The indicator has a few custom features that allows users to filter out signals using multi-timeframe trend indicator and to keep tracking positions so that one can only get new signals when they reserve position; This Script is meant to help traders easily identify great entry opportunities. The Script does NOT repaint signals.Indicateur Pine Script®par PerQuantumCoin8834
Intraday Bar CountingAs a day-trader, revising is the most important habit. This script adds numbers on intraday bars to help you revise and analyze patterns and your entries/exits. Great help!Indicateur Pine Script®par yeungshawnMis à jour 1414201
MACD Bar 1.0 [upslidedown]MACD is one of the most consistent ways a trader can determine overall trend direction. In this script, I've simplified the traditional MACD histogram into a compact bar with trend change shapes (▲▼) when the MACD histogram goes under the zero line or above the zero line. With traditional MACD I often have to zoom in, wasting precious time. This indicator fixes that problem. I use this script as a confirmation for other trigger signals, not as an entry or exit signal. I find this compact widget to be a preferable visualization of MACD on lower timeframes, while high timeframe analysis lends itself to the traditional MACD built-in with more data for decision making. This is also very useful when crafting trading strategies to quickly check for confluence of signals. In addition to the traditional EMA smoothing that comes with MACD, I exposed a series of common moving average types. These include: SMA, EMA, WMA, RMA, SWMA, VWMA, Hull, TEMA, and ZLEMA. TEMA and ZLEMA are not standard builtins, but when looking for fast confirmation they can be very useful. They can also create LOTS of noise, so consider this wisely before changing the builtin methodology. One neat trick is to pair a "fast" version of this with fast moving average type and then a slow one using traditional EMA. ▲▼ signals = trend shift in direction of triangle full color "bull or bear" color = strong trend half color (semi-transparent) "bull or bear" color = weakening trend Indicateur Pine Script®par upslidedownMis à jour 66172
SMI Ergodic Indicator Bar ColorsThis script simply displays bar colors corresponding to the SMI Ergodic Indicator. It does not display the oscillator or indicator itself. I prefer not to crowd my display with too many oscillators - others may find this script useful as well. Used in conjunction with other indicators, the SMII can give early reversal signals. Thanks to the TV community.Indicateur Pine Script®par scantor5161124
Heikin Ashi Bar OverlayThis script shows Heikin Ashi bars on your chart with specified vertical offsetIndicateur Pine Script®par dimdenMis à jour 77261
Internal Bar Strength (ValueRay)The IBS (Internal Bar Strength) as we know it, calculates only correctly on the long side. When the candle closes in loss, the original IBS still uses the upper wick. This IBS checks first if its an up or down candle and then uses the top or bottom wick to calculate the IBS. The yellow line is the corrected IBS, the blue line the originalIndicateur Pine Script®par derMatzeImNetzMis à jour 50
Volume Bar Breakout and Breakdown IndicatorVolume shows strength of a movement and highest volume shows the region that pushed price to certain extent with full strength. Breakout or Breakout of the highest volume bar range shows continuity further push by sellers or buyers indicating a trend continuation for a small period if not for long duration. Entries can be taken once signal is generated with stoploss as recommended. Guidelines: Don't trade if range is too large Don't trade if Breakdown or Breakdown candle body / range is too large or if there is high volatility Use additional indicator to get the idea of overall trend analysis Indicateur Pine Script®par iitiantradingsageMis à jour 124124 4.4 K
Swing Dream - PAINT BARS | MA | EMA | DMA | VWAP | TABLE | ADR %- Swing Dream - Script created for breakout-swing traders, in the style of QullaMaggie * , Dan Zanger, Oliver Kell, and Stockbee. The following indicators are used by most successful breakout-swing traders such as mentioned above. (As published) it contains: Painted Bars, also known as inside/outside candles. Used for candle analysis and to determine breakout pivots & levels. For instance; use it in different timeframes and seek formations (ex, 3-1-2). For further inspiration, study Rob Smith's The Strat . MA, Simple Moving Averages (Basic levels = 10,20,50,200). Use this indicator to define resistance/support areas as well as the overall long/swing-term trend. In breakout strategies such as EP, Flags, etc this can be used for trailing stops; an example, post-breakout, let the price ride the 20ma before exiting your position. EMA, Exponential Moving Averages with periods inspired by Qullamaggie (10,20,65). Use this on shorter timeframes (ex, 1h) and for the same principles as MAs. VWAP, Volume-Weighted Average Price. As for the previous, utilize this as a level indicator to find areas of resistance/support. Good for swing-trading as it implies whenever holders are profitable or not. DMA, Displaced Moving Average (Horizontal). Personally, I use this a lot. Works very well for trailing stops (post breakout) and "bounce" areas. Choose your own offset and period. ADR%, Average Daily Range Percentage. Displayed in the table and used to define a symbol's volatility. A very good tool for Qullamaggie-style trading. Personally, I try to find setups with over 6% ADR. Basic definition; low ADR% = Increased chance of a symbol to move slower and in smaller ranges. A higher value equals the opposite. Table. A table with basic symbol-related information. Could save you plenty of time whenever you scan or search for new swing setups. Looking to add more features here. Why should you use this script? Well, instead of having tens of different indicators, use this script and combine everything together with EP, Flag, or breakout principles. Suited for every plan, and more efficient in my opinion. View settings to turn on/off different indicators. * If you're looking for an introduction and further explanation of how Qullamaggie uses mentioned indicators, I could recommend checking out his website, stream, or participation in "Chat With Traders". At last, I want to credit: @jkcqld @neolao @TheScrutiniser This Script will get updated and improved. // TechFille006Indicateur Pine Script®par TechFille006Mis à jour 6565 1.1 K
MACD Bar & BG Histo Original Source Code of trading view used Bar color and background change added as per histogram for better trend change understand Indicateur Pine Script®par bas9inMis à jour 4417
Plot Real Open and Close - SamXI built this indicator as a personal request from a friend. He often trades using Heiken Ashi charts, but wanted a way to easily cross-reference real-price open and close values for the same timeframe on the same chart (as HA candles are by design lagging, they can take a few periods to catch up to a large move). This can also be used to help guide support and resistance zones using real-price data points should you so choose. There are 2 major ways to configure this indicator to display real-price open and close: As a Bar or Hollow Candle style chart overlay As on-chart shapes (allowing individual control over which data to show - open, close, or both) Indicateur Pine Script®par SamAccountXMis à jour 33327
Session's First Bar RangeFirst Bar is crucial when there is gap up or gap down opening. It is recommended to use 15m Timeframe for better use. Crossing this range signifies the absorption of existing buyers/sellers in the opening session and sometimes decide the trend onwards.Indicateur Pine Script®par iitiantradingsage1414297
Inside BarScript eliminates the equal highs as inside bars, useful for GT communityIndicateur Pine Script®par FinancialUnited25
TimeLibrary "Time" Utilities for measuring time. bar() Gets the number of milliseconds per bar.Bibliothèque Pine Script®par ElectrifiedMis à jour 1138
VPBar‴ | Volume & Volatility Power Bar‴What does it do? Draws the volume demand into the candlestick in order for you to identify the volume power in during candle formation. How does it work? Super easy. It's not too obvious how the volume power affects the market movement by just looking at the volume bars. This indicator transfere to the candlesticks the volume power demand which helps the trader understand the more/less probability of the market moving foward or reverting. What's my filling? Gives you a quick perception of the lastes market demand over the market movement. It makes total sence seeing the volume in such a very obvious format. Indicator features: - Volume Power (1): green and red gradient volume power (5 green gradients and 5 red gradients) - Volume Power (2): market standard gradient for positive and negative candles (only 5 colors for both market directions - doesn't help allot, reason why I created this indicator) - Trend Color Bar: let the candlesticks show you the trend and its reversal - Momentum Power: besides to the above features, you can add a momentum power indicator with arrow and/or moving average lines crossing To have access to this indicator, please DM me. Don't contact me in the comment area.Indicateur Pine Script®par MarceloTorresMis à jour 26