BOSS Smooth Stochastic Bull/Bear Oscillator With Alerts THE BEST FOREX, BINARY OPTIONS, AND CRYPTO INDICATORS FOR TRADINGVIEW.COM
Short Entry
During a price downtrend and you get a sell signal (red dot) enter short when the "K" line (green line) drops below 65 (mid upper band).
Long Entry
During an uptrend, buy when you get a long signal (green dot) and "D" line (red line) rises above 35 (mid lower band) .
Bull/Bear
Green background indicates bullish price action (uptrend)
Red background indicates bearish price action (downtrend)
Available At bosscripts.com
Website bosscripts.com
Recherche dans les scripts pour "bear"

Eagle-CrossingThis is Arcane Bears First Script Which charts your Golden Cross and Death Cross, You can update the settings as you see fit!
If you have any questions please join us at www.arcanebear.com

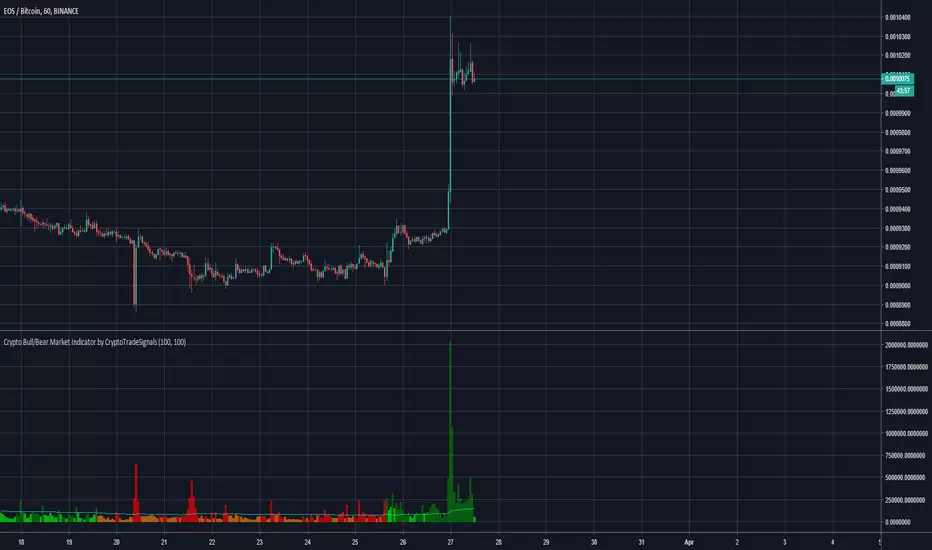
Crypto Bull/Bear Market Indicator by CryptoTradeSignalsHave you ever struggled to identify the sentiment of the crypto market?
With the "Crypto Bull/Bear Market Indicator by CryptoTradeSIgnals" you can easily determine whether markets are “bullish” or “bearish".
Features
Combines price and volume algorithms to easily identify market sell offs or strong buying activity.
Synergises with with Crypto Peak and Crypto Bottom indicators to better identify ENTRY and EXIT points for your trades.
Complete REWRITE of the pre-existing Crypto Bull/Bear Signal which provides better visual cues to understand market activity.
>>Get access to our Crypto Trading Indicators by visiting our website (please go to my main profile page or check the my signature)<<
AG Market QualityGiven that we are primarily focussed on trend-following, we built this indicator in a quest to assess the "quality" of a market. It was adapted primarily from methods that trading coach Dr. Van Tharp popularised, namely to do with his SQN.
This indicator has 5 zones that act to classify the market:
Strong Bull - Dark Green
Bull - Green
Neutral - Grey
Bear - Red
Strong Bear - Dark Red
The black line is an SMA(20) of Market Quality (indicating average quality over a period).
The simplistic theory is to look for long trades when the quality is indicating bull or strong bull conditions (green or dark green), and look for short trades when the quality is indicating bear or strong bear conditions (red or dark red). When the quality is in neutral territory (grey bars), the market is choppy/sideways/rangebound, and it's generally best to stay out in these conditions (for trend-followers).
We like to look for long trades when the quality is bull or strong bull, and above the average quality (black line), and look for short trades when the quality is bear or strong bear, and below the average quality.
So, not only does this indicator help you decide when to get in the market, it also tells you when to stay out of the market - really handy!
You can change the periods of the Market Quality, and also the SMA measuring average quality.

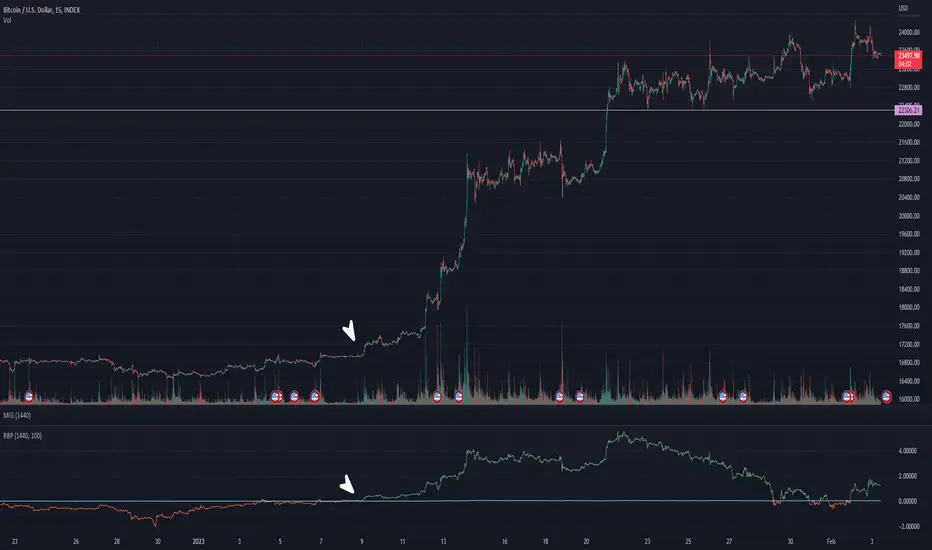
Bitfinex Sentiment Index [Long-Short]BSI provides two attractive graphs that breakdown the long (green area) and short (red area) positions ratio for the all Bitfinex margin cryptocurrency pairs only .
It is a quantitative measure of the bullishness or bearishness that can be used as a trading rule or in a trading system entries or exits. Included slow stochastic oscillator.

LazyBear's Wave Trend Strategy by SDMFHello.
This is a strategy using the Lazy Bears Wave Trend indicator which he was so nice to release for free.
I heavily modified it and added a huge amount of options for the indicator as well as for the strategy.
Unfortunately it's locked with a passcode for now so my friends can use it
The results above are nit picked for oil 15 minute chart.
using 40% of our equity per trade on 50x leverage.
these are not 100% realistic altho shouldn't be too far from the truth.
Have not tried it on crypto.
Script is in Beta version and will get upgraded plenty in the near future.

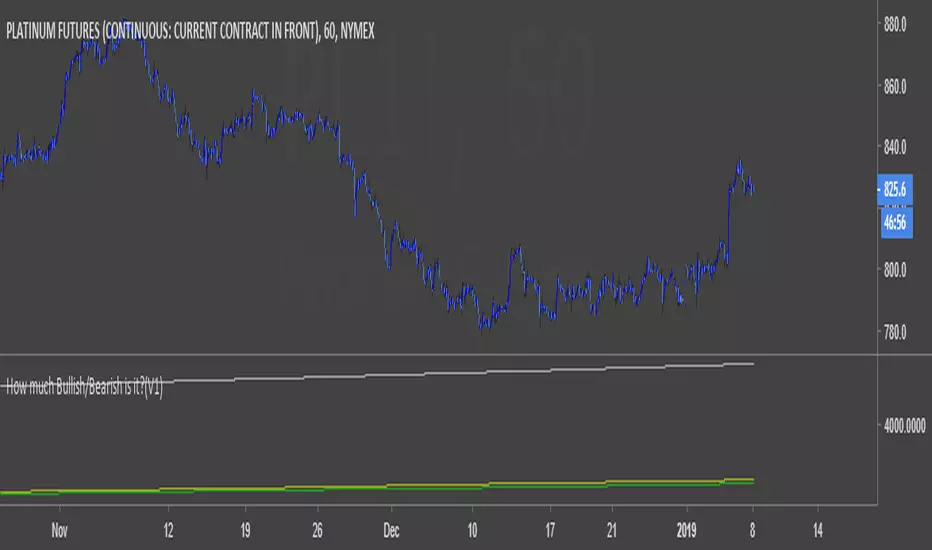
How much Bullish/Bearish is it?(V1)A script can show the amount of the bullishness and bearishness of candles on the chart based on the offered calculations.
Bull/Bear CandleThis script identifies whether the current and previous candle is bullish, bearish or neutral. Bullish candles are displayed with a green triangle, bearish with a red, and neutral with a yellow. The bull/bear cut off is set at 65% but this is adjustable to your taste.
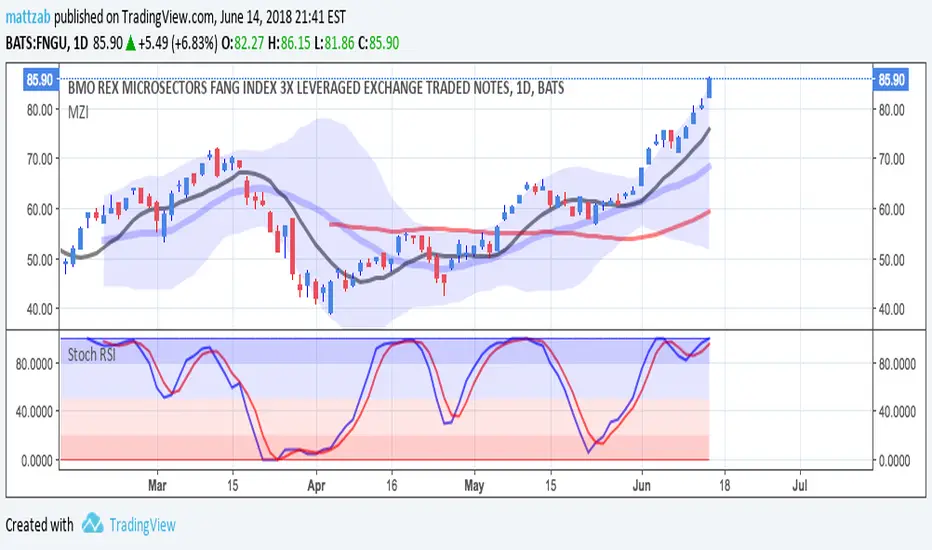
Bull Bear Stoch RSIStandard Stoch RSI with some color modification. 0 - 20 = Really Bearish (Dark Red Zone) 20 - 50 = Bearish (Light Red Zone) 50 - 80 = Bullish (Light Blue Zone) and 80 - 100 = Really Bullish (Strong Blue Zone). Thick lines at top and bottom to easily see 100 and 0.
Confluence Strategy Backtest This is modified version of Dale Legan's "Confluence" indicator written by Gary Fritz.
================================================================
Here is Gary`s commentary:
Since the Confluence indicator returned several "states" (bull, bear, grey, and zero),
he modified the return value a bit:
-9 to -1 = Bearish
-0.9 to 0.9 = "grey" (and zero)
1 to 9 = Bullish
The "grey" range corresponds to the "grey" values plotted by Dale's indicator, but
they're divided by 10.
You can change long to short in the Input Settings
Please, use it only for learning or paper trading. Do not for real trading.

Confluence Strategy This is modified version of Dale Legan's "Confluence" indicator written by Gary Fritz.
================================================================
Here is Gary`s commentary:
Since the Confluence indicator returned several "states" (bull, bear, grey, and zero),
he modified the return value a bit:
-9 to -1 = Bearish
-0.9 to 0.9 = "grey" (and zero)
1 to 9 = Bullish
The "grey" range corresponds to the "grey" values plotted by Dale's indicator, but
they're divided by 10.

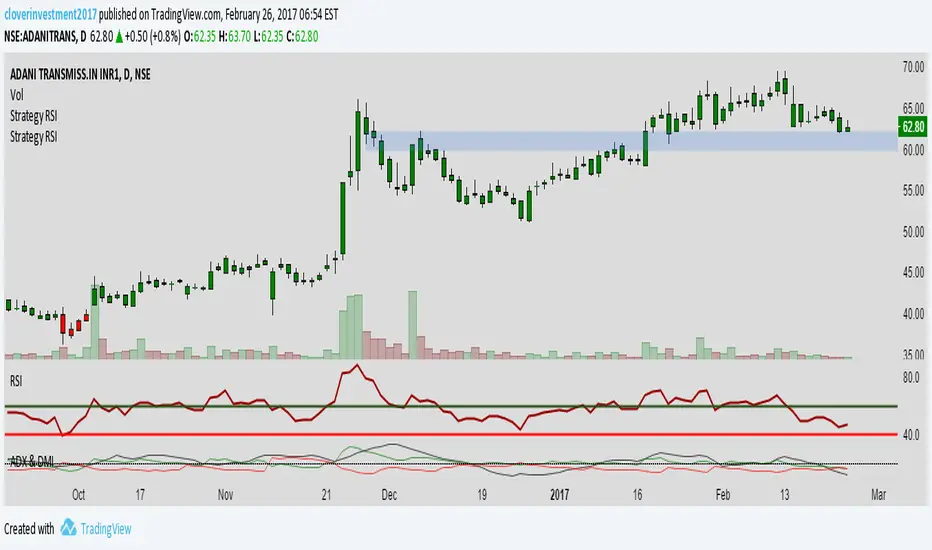
RSI IN Bull AND BEARLook RSI will oversold at 40 and 60 in Bullish Market
and RSI overbought at 60 and 40 at Bearish Market
To know more about Bullish and Bearish Market Criteria
Connect me at cloverinvestmentsindia@gmail.com
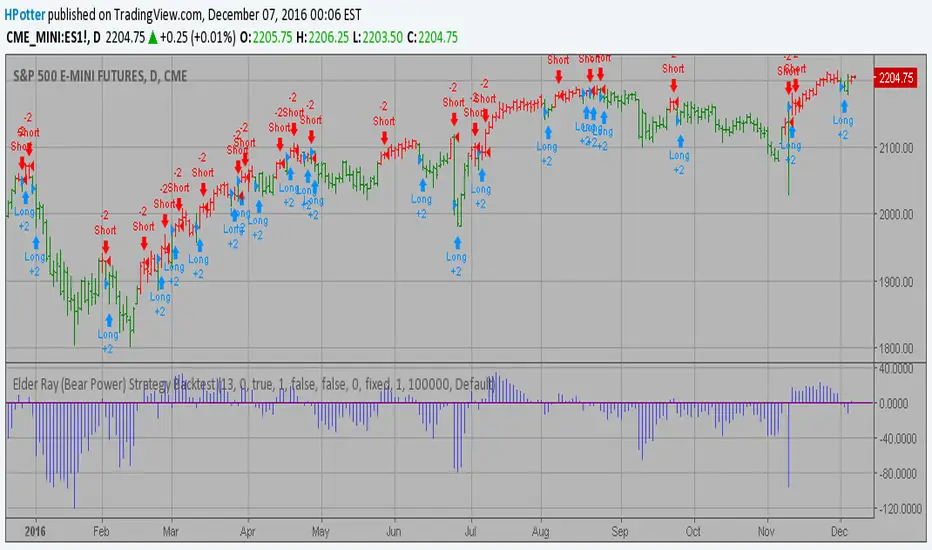
Elder Ray (Bear Power) Strategy Backtest Developed by Dr Alexander Elder, the Elder-ray indicator measures buying
and selling pressure in the market. The Elder-ray is often used as part
of the Triple Screen trading system but may also be used on its own.
Dr Elder uses a 13-day exponential moving average (EMA) to indicate the
market consensus of value. Bear Power measures the ability of sellers to
drive prices below the consensus of value. Bear Power reflects the ability
of sellers to drive prices below the average consensus of value.
Bull Power is calculated by subtracting the 13-day EMA from the day's High.
Bear power subtracts the 13-day EMA from the day's Low.
You can use in the xPrice any series: Open, High, Low, Close, HL2, HLC3, OHLC4 and ect...
You can change long to short in the Input Settings
Please, use it only for learning or paper trading. Do not for real trading.
EMA bullish/bearish dashboard - MTFThis is a good reminder for which way you should be placing orders.
It's best to not ignore these signals!!!
lime = full bull - 100ema above 200ema and price is above 200ema
green = hallf bull - price now below 200ema but 100ema is still above the 200
maroon = full bear - opposite of full bull
red = half bear - opposite of half bull
Also with multi timeframe option - so I guess you could stack several of these on a single framed chart if you wanted.

[NM] EMADiff v01 - an indicator for everyone !Allright gang, we are here with a new indicator that should help you with determining the direction to trade or whether you should trade at all.
It uses the close of the candle and 2 EMAs.
The faster moving line is the difference between the close and the Slow EMA, while the slower moving line shows the difference between the Fast EMA and the Slow EMA.
There are a couple of ways you can use this indicator, depending on your trading style :
For the quick profit, in and out :
- enable the safer trading option and keep smoothing at the default setting, buy when both lines are green, sell when both line are red and get out when one of the lines changes color (or when profit target is reached) (see the top option)
For longer trades :
- you can increase the smoothing, use a higher Slow EMA and disable the Safer trading option, enter either when both lines have the same color, either on a crossover. (the bottom option)
In both cases, if both lines hover around the zero line, the trend is definitely not strong.
Much more options are available so I would love to hear how you use this indicator. A thumbs up if you like it would be highly appreciated :)
Works nicely together with my other indicators below :
To add this indicator (or any other) to your chart, click the "Add to favorites" button. Then while having the chart you wish to apply it to open, click on Indicators > Favorites > EMADiff v01 (or any other indicator that you favorited.

Elder Ray Composite DOA hybrid representation of Elder Ray's Bear/Bull as an oscillator, using TEMA and LRC calculations to average out the signals. The Oscillation is based off of the Derivative oscillator. This gives an interesting interpretation of Bear vs Bull power. Give it a try!

M5_Bull/Bear BBOM5_ Bull/Bear BBO is a derivative oscillator built from LuxAlgo’s original Bollinger Bands Breakout Oscillator (BBO).
This version restructures the original breakout logic into a bull / bear adaptive oscillator, introduces inverted symmetry, and expands the visual system with dynamic level states and conditional color logic. The goal is to provide contextual momentum awareness rather than discrete trade signals.
A key design focus is the interaction between dominant pressure and the absence of opposing pressure. Buying and selling pressure may coexist, but moments where opposing pressure fully dissipates are treated as structurally significant — a “door opening” condition where price is no longer constrained by counter-pressure and is free to expand.
Pressure is explicitly mirrored from the opposite side, creating a symmetrical framework where each side’s expansion is reflected against the other. These mirrored structures are allowed to cross, not as directional signals, but as markers of peak intensity or exhaustion within an expanding pressure phase.
Transitional regimes — where one pressure fades before the other fully emerges — are intentionally left visible rather than smoothed away. These areas often produce late confirmation or no follow-through at all, and are presented as a challenging but informative market state rather than a condition to be optimized away.
The script is intended for visual analysis and context alignment, not as a standalone entry/exit system.
Credits & Licensing
Original concept and base implementation: LuxAlgo
Modifications, restructuring, and visual system: Metaltek5
License: Creative Commons Attribution–NonCommercial–ShareAlike 4.0 (CC BY-NC-SA 4.0)
This script is published as open source under the same license as the original work.
Non-commercial use only. Attribution and share-alike required.
Annotated example illustrating dominant pressure, mirrored behavior, and door opening conditions

MTF SMA Zones + EMA Trend (Bull & Bear) + EMA DisplayMTF SMA Zones + EMA Trend (Bull & Bear) + EMA Display

Ichimoku bull bear trend Multi-BG by Pranojit Dey It gives you bullish and bearish bias using ichimoku, VWAP, SMA and Pivot. can be used as a great confirmation tool for trading. Use it. You will love it. Lets trade traders....

Halo MTF Market Bias (Bull / Bear)This indicator is designed to provide a clear directional market bias at a glance, using a clean and easy-to-read multi-timeframe analysis.
It allows traders to quickly determine whether the market is bullish or bearish, helping them trade only in the direction of the overall market context.
The indicator automatically analyzes the bias on the following timeframes:
1 minute
5 minutes
15 minutes
30 minutes
1 hour
4 hours
Daily
👉 Works on all markets: Crypto, Forex, Indices, Gold, and more.
⚠️ Important
This indicator is not a trading system.
It should be used as a decision-support tool, always combined with a clear strategy and proper risk management.

Bull-Bear Strategy10-level EMA cross-period resonance, accurately capturing trend ignition points and outperforming single-period strategies by far. K-line bull-bear power weighting filters out 90% of oscillating noise, leading to a sharp surge in signal win rate. Historical backtesting yields an outstanding win rate. Strict position control is required for live trading. This does not constitute investment advice.

Bullish & Bearish Engulfing The Bullish & Bearish Engulfing Indicator is a body-based candlestick pattern indicator designed to identify potential trend reversal points in the markets. The indicator automatically detects Bullish Engulfing patterns that appear at the end of downtrends and Bearish Engulfing patterns that form at the end of uptrends.
The Bullish & Bearish Engulfing Indicator is suitable for use with price action, support-resistance, and trend continuation/reversal strategies. Rather than being a standalone trading tool, it is designed as a powerful contextual analysis tool to support decision-making processes. When used with the correct market structure and additional confirmations, it helps to identify high-quality trading opportunities.
