CM Gann Swing High Low V2CM Gann Swing High Low V2
Added Improvements:
Used PineScript “linebr" code so solid lines plot only when condition = true.
Via Inputs Tab:
Ability to Turn On/Off Highlight Bars When Crossing Above/Below Swing High Low
Ability to Turn On/Off Back Ground Highlights When Crossing Above/Below Swing High Low
Ability to Turn On/Off linebr plots.
Other Features: All Available Via Inputs Tab
Ability to Adjust Moving Average Values to adjust Sensitivity.
Ability to Turn On/Off Triangles Above/Below Bars based on Indicator.
Ability to Turn On/Off Triangles at Top And Bottom Of Screen Showing Direction of Indicator.
***Basically you have Option to View Indicator about every way possible.
***Special Thanks to Glaz for Original Code.
Recherche dans les scripts pour "cm"

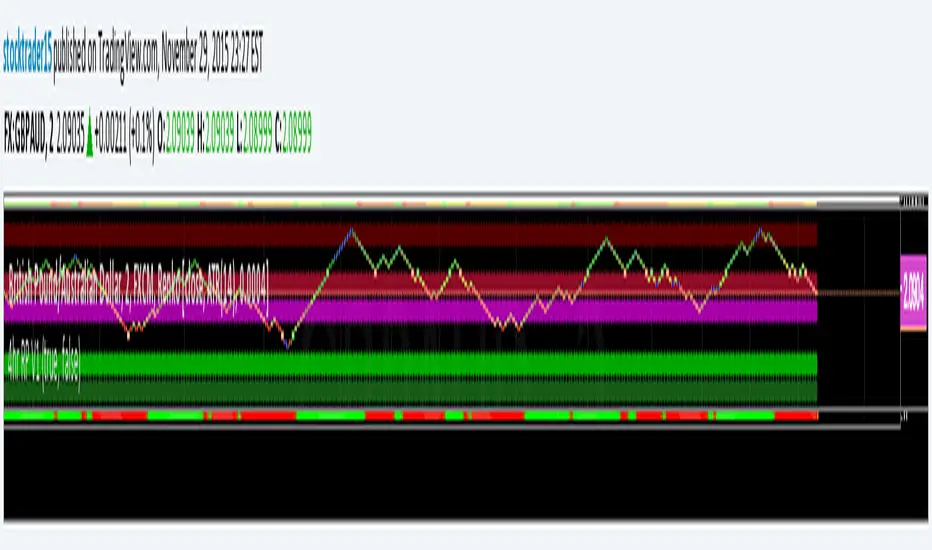
CM ATR PercentileRankCM ATR PercentileRank - Great For Showing Market Bottoms.
When Increased Volatility to the Downside Reaches Extreme Levels it’s Usually a Sign of a Market Bottom.
This Indicator Takes the ATR and uses a different LookBack Period to calculate the Percentile Rank of ATR Which is a Great Way To Calculate Volatility
Be Careful Of Using w/ Market Tops. Not As Reliable.
***Ability to Control ATR Period and set PercentileRank to Different Lookback Period
***Ability to Plot Histogram Just Showing Percentiles or Histogram Based on Up/Down Close
Fuchsia Lines = Greater Than 90th Percentile of Volatility based on ATR and LookBack Period.
Red Lines = Warning — 80-90th Percentile
Orange Lines = 70-80th Percentile
Other Useful Indicators
Williams Vix Fix
CM_RSI EMA Is a Great Filter for Williams Vix Fix

CM Time Based Vertical LinesCM Time Based Lines
Requested by codetrader to Visually Show Day Change on Intra-Day Charts.
Custom Indicator: Ability To Plot Recurring Time Lines On Chart!
Example of Uses:
Plot Lines at Midnight to Show Daily Change.
Plot Lines at Opening of Different Sessions.
Plot Lines at Opening and Closing of Sessions.
Plot Lines Every 4 Hours (Forex) To See 4-Hour Price Action!
Ability to Change Times!
Ability to Plot Up To 6 Recurring Time Based Lines!
Plus Many Other Uses!
Ability To Turn On/Off Any of the 6 Customizable Lines in Inputs Tab!
Ability To Change Thickness of Lines to Cover Multiple Bars!

CM Percent Move Upper V1CM Percent Move Upper V1 .... Goes With the Lower Indicator
Created by ChrisMoody on 9/3/2014 by Request from vlad.adrian
**Plots A BackGround Highlight if % Move is Greater or Equal to User Input
** % Move is based on Close of Current Bar Compared to Close of Previous Bar

CM Percent Move Lower V1CM Percent Move Lower V1
Created by ChrisMoody on 9/3/2014 by Request from vlad.adrian
**Plots the percent move based on the Close of Bar Compared to the Close of Previous Bar
**If Bar closes Up then Histogram is Green, If Bar Closes Down Histogram is Red.
**Ability to Show/Hide Background Highlights, Horizontal Lines, % Histogram, and SMA of Percent Moves

CM Opening Range-Asia and Europe SessionCM Opening Range Asia AndEurope Sessions
Requested by rayhug1 to use Asia Range of 5pm Est to 2am Est...uses 540 minutes (5pm to 2am Est — 9 Hours) to calculate the Range...then breakouts trigger after 2am
-Ability to change Start and End Times to use any entire session.
---Defaults to 540 minutes (9 hours) but Opening Range Calculation can be changed to 1 hour, 2 hour etc. in Inputs tab
***Known Bug…Currently will NOT Plot accurately the U.S. Session from 0800 to 0759. Will Update Indicator when Fixed.
-Ability to Change the Start and End Times to Accommodate any session.
—Default is 1700 to 1659 (Asian Range)
—Europe Session 0200 to 0159
***All times are based on New York Time or Eastern Standard time … GMT-5
***Times will change based on Daylight Savings Time.

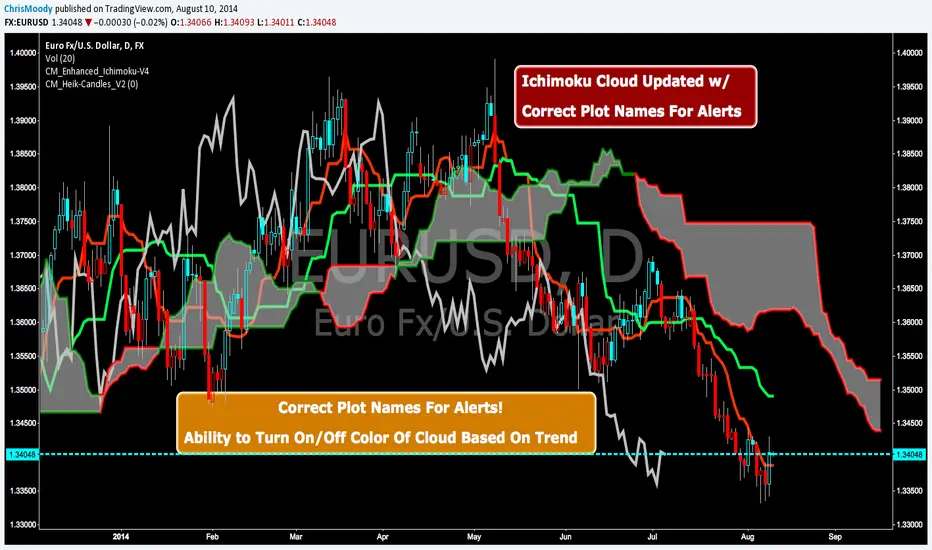
CM Enhanced Ichimoku Cloud-V4CM Enhanced Ichimoku Cloud-V4 Updated For Alerts!!!
Correct Plot Names For Alerts!
Ability to Turn On/Off Color Of Cloud Based On Trend!
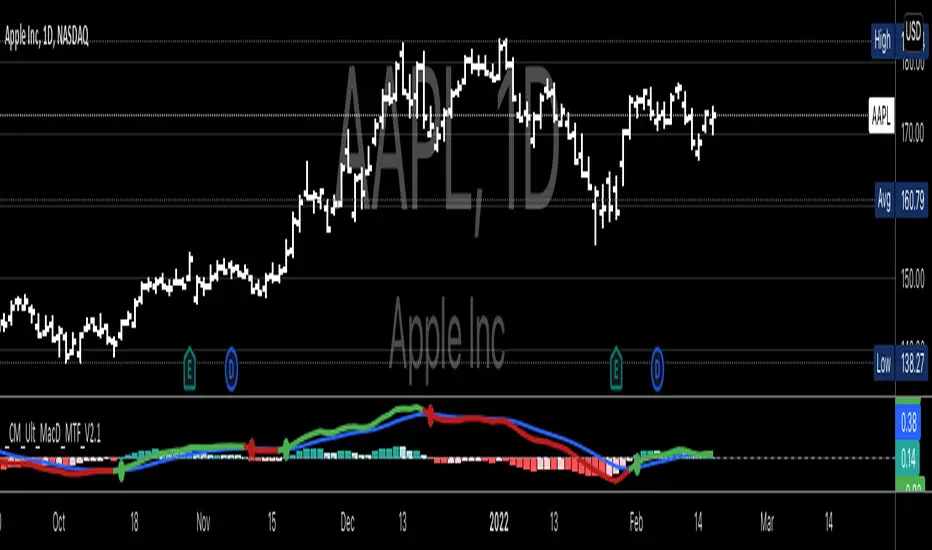
CM MACD Custom Indicator - Multiple Time Frame - V2***For a Detailed Video Overview Showing all of the Settings...
Click HERE to View Video
New _CM_MacD_Ult_MTF _V2 Update 07-28-2021
Thanks to @SKTennis for help in Updating code to V2
Added Groups to Settings Pane.
Added Color Plots to Settings Pane
Switched MTF Logic to turn ON/OFF automatically w/ TradingView's Built in Feature
Updated Color Transparency plots to work in future update
Added Ability to Turn ON/OFF Show MacD & Signal Line
Added Ability to Turn ON/OFF Show Histogram
Added Ability to Change MACD Line Colors Based on Trend
Added Ability to Highlight Price Bars Based on Trend
Added Alerts to Settings Pane.
Customized how Alerts work. Must keep Checked in Settings Pane, and When you go to Alerts Panel, Change Symbol to Indicator (CM_Ult_MacD_MTF_V2)
Customized Alerts to Show Symbol, TimeFrame, Closing Price, MACD Crosses Up & MACD Crosses Down Signals in Alert
Alerts are Pre-Set to only Alert on Bar Close
See Video for Detailed Overview
New Updates Coming Soon!!!
***Please Post Feedback and Any Feature Requests in the Comments Section Below***
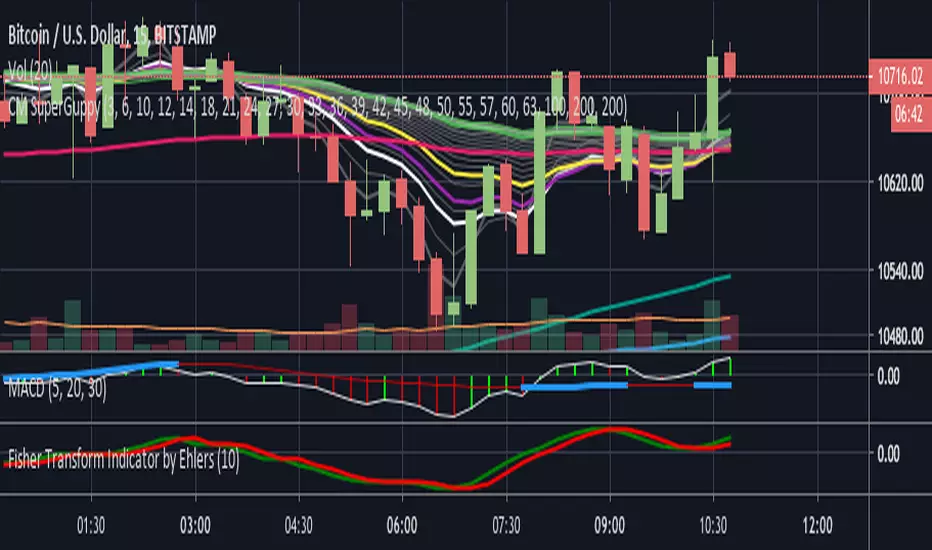
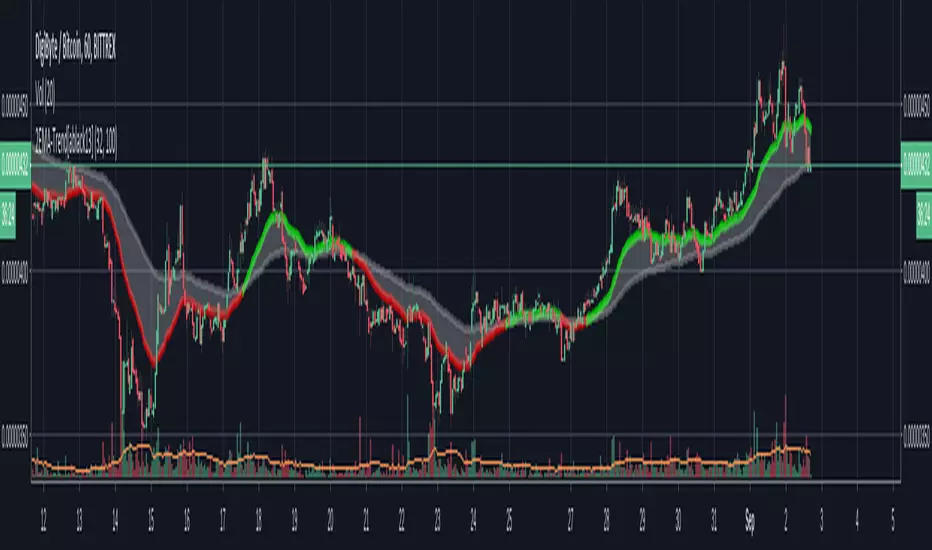
CM Super GuppyTook @ChrisMoody's awesome Guppy EMA Script and changed it to match the neew Super Guppy format.
Original here:

Stochastics + CM Williams VixFix (Simple Buy Signal)📈 Stochastics + CM Williams VixFix (Simple Buy Signal)
This indicator combines two powerful tools to detect potential bottoming opportunities:
✅ Stochastics: Looks for momentum reversals. A signal is triggered when both %K and %D are below the oversold threshold (default: 20), suggesting the asset is deeply oversold.
✅ CM Williams Vix Fix: A volatility-based fear detector. When it spikes above its dynamic threshold, it indicates potential panic selling — often preceding a market bounce.
💡 Buy Signal is generated when:
%K and %D are both below 20
VixFix shows a volatility spike (green condition)
Use this script to identify high-probability reversal setups, especially during market corrections or panic phases.
ANN BTC MTF CM Sling Shot SystemHi all, this script was created as a result of ANN training in all time frames of bitcoin data.
Trained data is built on Chris Moody's Sling Shot system.
CM Sling Shot System :
This system automatically generates the ANN output for all time periods.
Therefore, it has multi-time-frame feature.
Artificial Neural Networks training details:
Average Errors
1 minute = 0.005570
3 minutes = 0.006674
5 minutes = 0.007067
15 minutes = 0.010000
30 minutes = 0.009398
45 minutes = 0.010000
1 Hour = 0.006848
2 Hours = 0.006901
3 Hours = 0.009608
4 Hours = 0.009774
1 Day = 0.010000
1 Week = 0.010000
The results look good (All Average Error <= 0.01 ), the Sling Shot Method is also good, but you can also refer to historically slower period averages to filter these arrows a bit more. I leave the decision to you.
Best regards.

ST15 CM inspired 4hr renko Pivots
Standard pivot points do not work with ATR Renko charts, but I really enjoy using pivot points to find strong s/r, so I started to look at scripts that could provide the same results as floor trader pivots but on a renko chart. I found a script written by CM that I was able to tweak a little and I got it work with ATR renkos. The only issue now is he only wrote the script to look for 1hr pivot points so I am now in the process off writing versions that can do the 240 1d 1w and 1m pivot points as well. Here is the 4hr :) enjoy! Thank you CM :)
Candle Body RatioThis indicator is designed to calculate the percentage of the upper wick, the body, and the lower wick of the candle over which your cursor is positioned.

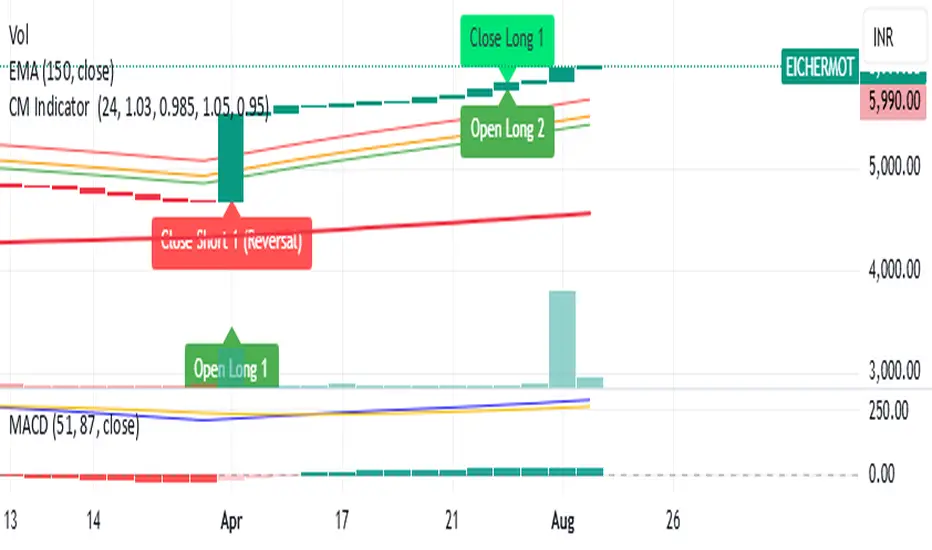
CM Indicator About Indicator:-
1) This is best Indicator for trend identification.
2) This is based on 42 EMA with Upper Band and Lower bands for trend identification.
3) This should be used for Line Bar chart only.
4) Line bar chart should be used at 1 hour for 15 line breaks.
How to Use:-
1) To go with trend is best use of this indicator.
2) This is for stocks and options not for index. Indicator used for Stocks at one hour and options for 10-15 minutes line break.
3) There will be 5% profitability defined for each entry, 3 entries with profit are best posible in same continuous trend 4 and 5th entry is in riskier zone in continuous trend.
4) Loss will only happen if there is trend reversal.
5) Loss could only be one trade of profit out of three profitable trades.
6) Back tested on 200 stocks and 100 options.


CM SlingShot System by GibsJust got an excellent indicator by ChrisMoody and changed the EMAs, he deserves all the credit!


CM Super Guppy zlEMAI combined Fritz Murphy's Super Guppy with Buckkets TTZ Zlema Guppy. I have tried a few settings on it but finding it difficult to optimize. So if anyone with some time on their hands wants to give it a go feel free. Let me know how you get on.

CM Stochastic POP Method 2-Jake Bernstein_V1Yesterday Jake Bernstein authorized me to post his updated results with the Stochastic Pop Trading System he developed many years ago.
You can take a look at the Original System with Updated Settings at
This indicator is a different set of rules Jake mentioned in the PDF he allowed me to post.
To view the PDF use this link:
dl.dropboxusercontent.com
Today we’re releasing the version described in the PDF that uses the StochK values of 55, 50, and 45. The rules are discussed in the PDF but here is a simple breakdown:
Enter Long when StochK is below 50 and Crosses Above 55
Exit Long on Cross Below 55
Enter Short when StochK is Above 50 and crosses Below 45
Exit Short on Cross Above 45
Two Important Items to understand about this method:
To code the rules Precisely we need a function that will be available when Strategy Capabilities are released on TradingView.
There is one of Jakes Profit Maximizing Strategies that needs to be integrated with this code…which again we need the Strategy based Function that will be coming soon.
To Compare this system to the Stochastic Pop Method 1 System shown yesterday at I used the same Symbol and dates for you to compare…but remember to give this Method 2 System a Fair Look/Evaluation…we need the Soon To Be Released…TradingView Strategy Capabilities.
BackTesting Results Example: EUR-USD Daily Chart Since 01/01/2005
Strategy 1 – Stochastic Pop Method 2 System:
Go Long When Stochasticis below 50 and Crosses Above 55. Go Short When Stochastic is above 50 and Crosses Below 45. Exit Long/Short When Stochastic has a Reverse Cross of Entry Value.
Results:
Total Trades = 151
Profit = 40,758 Pips
Win% = 37.1%
Profit Factor = 1.26
Avg Trade = 270 Pips Profit
***Most Consecutive Wins = 4 ... Most Consecutive Losses = 7
Strategy 2:
Rules - Proprietary Optimization Jake Will Teach. Only Added 1 Additional Exit Rule.
Results:
Total Trades = 151
Profit = 60.305 Pips
Win% = 37.1%
Profit Factor = 1.38
Avg Trade = 399 Pips Profit
***Most Consecutive Wins = 4 ... Most Consecutive Losses = 7
Indicator Includes:
-Ability to Color Candles (CheckBox In Inputs Tab)
Green = Long Trade
Blue = No Trade
Red = Short Trade
Jake Bernstein will be a contributor on TradingView when Backtesting/Strategies are released. Jake is one of the Top Trading System Developers in the world with 45+ years experience and he is going to teach TradingView.com’s community how to create Trading Systems and how to Optimize the correct way.
Link To PDF:
dl.dropboxusercontent.com
Link to Original Version of Indicator with Updated Settings.
