Volume Flow ConfluenceVolume Flow Confluence (CMF-KVO Integration)
Core Function:
The Volume Flow Confluence Indicator combines two volume-analysis methods: Chaikin Money Flow (CMF) and the Klinger Volume Oscillator (KVO). It displays a histogram only when both indicators align in their respective signals.
Signal States:
• Green Bars: CMF is positive (> 0) and KVO is above its signal line
• Red Bars: CMF is negative (< 0) and KVO is below its signal line
• No Bars: When indicators disagree
Technical Components:
Chaikin Money Flow (CMF):
Measures the relationship between volume and price location within the trading range:
• Calculates money flow volume using close position relative to high/low range
• Aggregates and normalizes over specified period
• Default period: 20
Klinger Volume Oscillator (KVO):
Evaluates volume in relation to price movement:
• Tracks trend changes using HLC3
• Applies volume force calculation
• Uses two EMAs (34/55) with a signal line (13)
Practical Applications:
1. Signal Identification
- New colored bars after blank periods show new agreement between indicators
- Color intensity differentiates new signals from continuations
- Blank spaces indicate lack of agreement
2. Trend Analysis
- Consecutive colored bars show continued indicator agreement
- Transitions between colors or to blank spaces show changing conditions
- Can be used alongside other technical analysis tools
3. Risk Considerations
- Signals are not predictive of future price movement
- Should be used as one of multiple analysis tools
- Effectiveness may vary across different markets and timeframes
Technical Specifications:
Core Algorithm
CMF = Σ(((C - L) - (H - C))/(H - L) × V)n / Σ(V)n
KVO = EMA(VF, 34) - EMA(VF, 55)
Where VF = V × |2(dm/cm) - 1| × sign(Δhlc3)
Signal Line = EMA(KVO, 13)
Signal Logic
Long: CMF > 0 AND KVO > Signal
Short: CMF < 0 AND KVO < Signal
Neutral: All other conditions
Parameters
CMF Length = 20
KVO Fast = 34
KVO Slow = 55
KVO Signal = 13
Volume = Regular/Actual Volume
Data Requirements
Price Data: OHLC
Volume Data: Required
Minimum History: 55 bars
Recommended Timeframe: ≥ 1H
Credits:
• Marc Chaikin - Original CMF development
• Stephen Klinger - Original KVO development
• Alex Orekhov (everget) - CMF script implementation
• nj_guy72 - KVO script implementation
Recherche dans les scripts pour "oscillator"
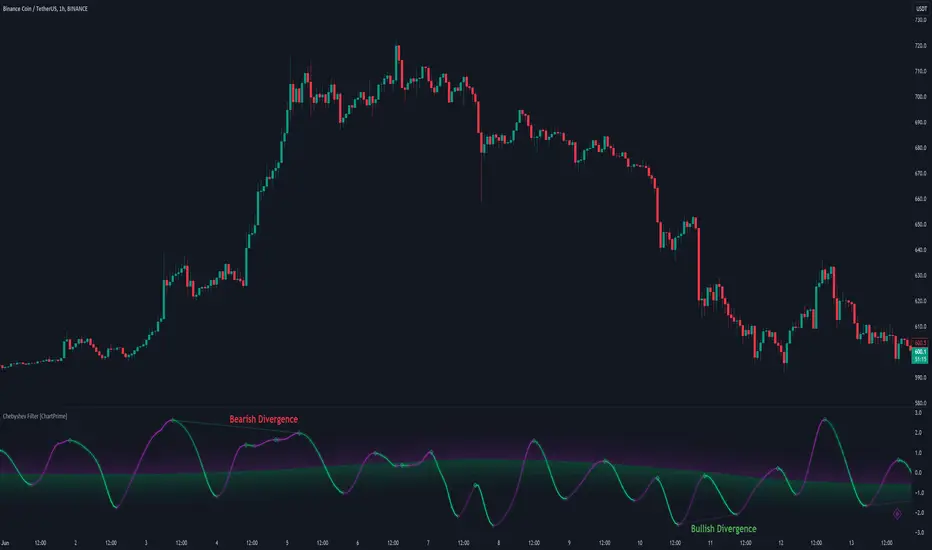
Chebyshev Filter Divergences [ChartPrime]The Chebyshev Filter Divergences Oscillator
The Chebyshev Filter indicator is a powerful tool designed to identify potential divergences between price and a filtered version of price based on the Chebyshev filter algorithm. It helps to spot mean reversion points by highlighting areas where price and the filtered price exhibit conflicting signals.
Chebyshev Filter Background:
The Chebyshev filter, named after the Russian mathematician Pafnuty Chebyshev , was invented in the mid-19th century. It's a type of filter used in signal processing and digital signal processing for smoothing or removing unwanted frequency components from a signal.
It provides a sharp cutoff between the passband and stopband of a filter while minimizing ripple in the passband or stopband.
Chebyshev filters are widely used in various applications, including audio and image processing, telecommunications, and financial analysis, due to their efficiency and effectiveness in filtering out noise and extracting relevant information from signals.
◆ Indicator Calculation:
The indicator first applies a Chebyshev filter to the price data, producing a filtered price series. It then normalizes this filtered price series to a range, where it can be used as oscillator with divergences.
◆ Visualization:
The filtered price series is plotted on the chart, highlighting areas where it deviates from its smoothed average.
Bullish and bearish divergences are marked on the chart with specific lines and colors, indicating potential shifts in market sentiment.
Signs of change in direction are also marked on the chart, providing additional insights into possible mean reversals of price.
◆ User Inputs:
Ripple (dB): Specifies the desired ripple factor in decibels for the Chebyshev filter.
Normalization Length: Sets the length of the normalization period used in the Chebyshev filter.
Pivots to Right and Left: Determines the number of pivot points to the right and left of the current point to consider when detecting divergences.
Max and Min of Lookback Range: Specifies the maximum and minimum lookback range for identifying divergences.
Show Divergences: Enables or disables the display of bullish and bearish divergences.
Visual Settings: Allows customization of colors for visual clarity.
In conclusion, the Chebyshev Filter Divergences indicator, with its ability to identify potential mean reversion points through divergences between price and a filtered version of price, offers traders a valuable tool for decision-making in the financial markets. By highlighting areas of divergence, traders can potentially capitalize on market inefficiencies and make more informed trading decisions.
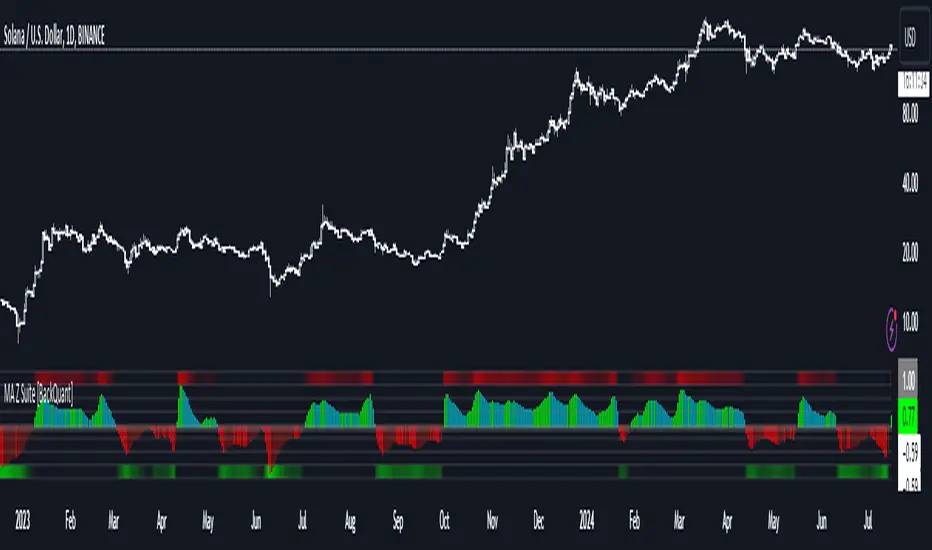
Moving Average Z-Score Suite [BackQuant]Moving Average Z-Score Suite
1. What is this indicator
The Moving Average Z-Score Suite is a versatile indicator designed to help traders identify and capitalize on market trends by utilizing a variety of moving averages. This indicator transforms selected moving averages into a Z-Score oscillator, providing clear signals for potential buy and sell opportunities. The indicator includes options to choose from eleven different moving average types, each offering unique benefits and characteristics. It also provides additional features such as standard deviation levels, extreme levels, and divergence detection, enhancing its utility in various market conditions.
2. What is a Z-Score
A Z-Score is a statistical measurement that describes a value's relationship to the mean of a group of values. It is measured in terms of standard deviations from the mean. For instance, a Z-Score of 1.0 means the value is one standard deviation above the mean, while a Z-Score of -1.0 indicates it is one standard deviation below the mean. In the context of financial markets, Z-Scores can be used to identify overbought or oversold conditions by determining how far a particular value (such as a moving average) deviates from its historical mean.
3. What moving averages can be used
The Moving Average Z-Score Suite allows users to select from the following eleven moving averages:
Simple Moving Average (SMA)
Hull Moving Average (HMA)
Exponential Moving Average (EMA)
Weighted Moving Average (WMA)
Double Exponential Moving Average (DEMA)
Running Moving Average (RMA)
Linear Regression Curve (LINREG) (This script can be found standalone )
Triple Exponential Moving Average (TEMA)
Arnaud Legoux Moving Average (ALMA)
Kalman Hull Moving Average (KHMA)
T3 Moving Average
Each of these moving averages has distinct properties and reacts differently to price changes, allowing traders to select the one that best fits their trading style and market conditions.
4. Why Turning a Moving Average into a Z-Score is Innovative and Its Benefits
Transforming a moving average into a Z-Score is an innovative approach because it normalizes the moving average values, making them more comparable across different periods and instruments. This normalization process helps in identifying extreme price movements and mean-reversion opportunities more effectively. By converting the moving average into a Z-Score, traders can better gauge the relative strength or weakness of a trend and detect potential reversals. This method enhances the traditional moving average analysis by adding a statistical perspective, providing clearer and more objective trading signals.
5. How It Can Be Used in the Context of a Trading System
In a trading system, it can be used to generate buy and sell signals based on the Z-Score values. When the Z-Score crosses above zero, it indicates a potential buying opportunity, suggesting that the price is above its mean and possibly trending upward. Conversely, a Z-Score crossing below zero signals a potential selling opportunity, indicating that the price is below its mean and might be trending downward. Additionally, the indicator's ability to show standard deviation levels and extreme levels helps traders set profit targets and stop-loss levels, improving risk management and trade planning.
6. How It Can Be Used for Trend Following
For trend-following strategies, it can be particularly useful. The Z-Score oscillator helps traders identify the strength and direction of a trend. By monitoring the Z-Score and its rate of change, traders can confirm the persistence of a trend and make informed decisions to enter or exit trades. The indicator's divergence detection feature further enhances trend-following by identifying potential reversals before they occur, allowing traders to capitalize on trend shifts. By providing a clear and quantifiable measure of trend strength, this indicator supports disciplined and systematic trend-following strategies.
No backtests for this indicator due to the many options and ways it can be used,
Enjoy
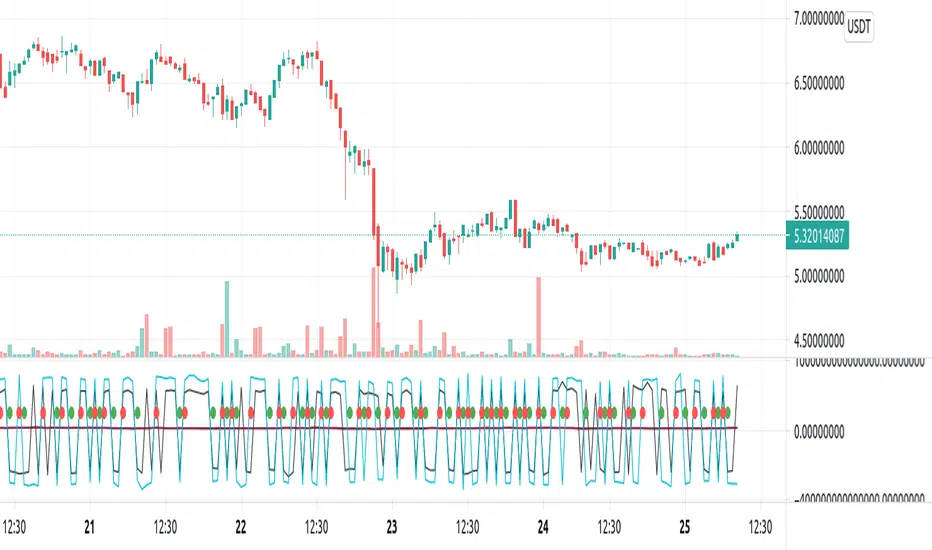
Color Stochastic IndicatorThis Pine Script™ indicator, "Color Stochastic Indicator," is designed to visualize the stochastic oscillator with color-coded trends and shaded background levels, providing a clearer understanding of market trends and potential trading signals.
Key Features:
Customizable Parameters:
K Period: The period for the %K line in the stochastic calculation (default: 50).
D Period: The period for the %D line, which is the moving average of %K (default: 13).
Slowing: The slowing factor applied to the stochastic calculation (default: 2).
Smoothing: A factor for additional smoothing of the stochastic values (default: 1.0).
Use Crossover: Option to determine trend based on the crossover of %K and %D lines.
Display Levels: Option to show significant stochastic levels on the chart (0.2, 0.5, 0.8).
Price Field: Selection of the price field used in calculations.
Stoch Width: Line width for the %K line.
Signal Width: Line width for the %D line.
Background Colors:
Upper Level Background: Shaded area between 0.5 and 0.8 with a customizable color.
Lower Level Background: Shaded area between 0.2 and 0.5 with a customizable color.
Color-Coded Trends:
Wait (Gray): Neutral state when no clear trend is detected.
Uptrend (Green): Indicates a potential buying signal.
Downtrend (Red): Indicates a potential selling signal.
Signal Line (Blue): Represents the %D line for clearer signal identification.
Alerts:
Customizable alerts trigger when the trend changes, providing timely notifications for potential trade opportunities.
How It Works:
Stochastic Calculation:
The %K line is calculated based on the selected K Period.
The %D line is a simple moving average (SMA) of the %K line over the D Period.
Additional smoothing is applied to both %K and %D lines using the specified Smoothing factor.
Fisher Transform:
The script applies a Fisher transform to the smoothed %K values, enhancing the clarity of trend signals.
Trend Determination:
If Use Crossover is enabled, the trend is determined based on the crossover of smoothed %K and %D lines.
If Use Crossover is disabled, the trend is determined based on whether the smoothed %K value is above or below 0.5.
Background Shading:
Fixed background colors are applied using hline and fill functions, highlighting the specified levels on the chart (0.2, 0.5, 0.8).
Plotting:
The smoothed %K line is plotted with color coding based on its value relative to the %D line and threshold levels.
The %D line is plotted for reference.
How to Use:
Adding the Indicator:
Copy and paste the provided Pine Script™ code into a new indicator script in TradingView.
Save and add the indicator to your desired chart.
Configuring Parameters:
Adjust the input parameters (K Period, D Period, Slowing, etc.) according to your trading strategy and preferences.
Enable or disable the Use Crossover option based on whether you prefer trend determination by crossover or threshold.
Interpreting Signals:
Observe the color-coded %K line to identify potential buy (green) and sell (red) signals.
Use the shaded background areas to quickly assess overbought (0.5 to 0.8) and oversold (0.2 to 0.5) conditions.
Monitor alerts for trend changes to take timely trading actions.
Alerts Setup:
Set up custom alerts based on the provided alert conditions to receive notifications when the trend changes.
Originality:
This script combines the stochastic oscillator with color-coding and background shading for enhanced visualization.
It introduces a unique Fisher transform application to the smoothed %K values.
The crossover and threshold-based trend determination options provide flexibility for different trading strategies.
Customizable alert messages help traders stay informed about trend changes in real time.
By incorporating these features, the "Color Stochastic Indicator" offers a comprehensive tool for traders seeking to leverage stochastic analysis with improved clarity and actionable insights.

Price PressureDescription:
The Price Pressure Indicator, developed by OmegaTools, is a robust and versatile tool designed to assist traders in analyzing market dynamics and identifying potential trend shifts. This open-source script, offers a unique approach to understanding price pressure over specified periods, enhancing the user's ability to make informed trading decisions.
Key Features:
1. Dynamic Length Configuration: The indicator allows users to customize the length parameter, ranging from 9 to 100, providing flexibility in adapting to different market conditions.
2. Extensions Control: Traders can fine-tune the extension levels (ob) between 50 and 90, allowing for precise adjustments based on their risk tolerance and trading preferences.
3. Normalization and Oscillation: The script employs a normalization function to standardize price data, offering a clearer representation of market pressure. The resulting oscillator visualizes the normalized pressure, highlighting potential market trends.
4. Pressure Calculation: The indicator calculates price pressure by considering the difference between the previous high and the current close, as well as the difference between the current close and the previous low. This innovative approach enhances the accuracy of pressure analysis.
5. Smoothing Option: While the script currently uses a simple moving average for smoothing, traders have the option to explore other smoothing methods by uncommenting the "smt" input line.
6. Visual Clarity: The indicator provides a visually intuitive representation of pressure and signal lines, aiding traders in quickly interpreting market conditions. The color-coded display enhances user experience, with the ability to discern bullish and bearish pressures.
7. Premium and Discount Zones: The script identifies premium and discount areas, assisting traders in spotting potential buying or selling opportunities. The premium and discount lines can be adjusted based on individual risk tolerance and strategy.
How to Use:
1. Adjust the length and extension parameters based on your trading preferences.
2. Interpret the oscillator and signal lines for insights into market pressure.
3. Utilize premium and discount zones to identify potential entry or exit points.
4. Experiment with different smoothing options for a customized analysis.
Concepts and Methodology:
The Price Pressure Indicator utilizes a normalization function and oscillation to quantify market pressure. By calculating the difference between highs and lows, the script provides a nuanced understanding of current market conditions. The smoothing option further refines the analysis, offering traders a comprehensive tool for trend identification.
Explore, experiment, and leverage the power of the Price Pressure Indicator to enhance your trading strategy on TradingView.

RSI MFI MultiTimeframe Oversold/OverboughtHello Traders,
This indicator is designed to easily visualize the overbought/oversold states of RSI and MFI across multiple timeframes.
The indicator is very straightforward.
The deeper the red, the closer it is to 0, and the deeper the green, the closer it is to 100. The intermediate values are rendered in a transparent gray to focus on the key regions.
However, I understand that traders may have an interest in knowing the most recent state of the oscillator, whether it was overbought or oversold.
For this reason, I have included the 'Gradient Color' option in the color settings.
By turning off this option, you can easily see at a glance which region the oscillator was in most recently.
(Gradient Color Option Off)
In addition, I know that many traders are interested in the actual RSI/MFI values across multiple timeframes.
Thus, I have displayed the RSI/MFI values for each timeframe on the far right.
Furthermore, although the name of this indicator is RSI MFI MultiTimeframe Oversold/Overbought, I have also included the Stochastic RSI as an option, as I find it personally useful.
Feel free to use it if you find it helpful.

Trig-Log Scaled Momentum OscillatorTaylor Series Approximations for Trigonometry:
1. The indicator starts by calculating sine and cosine values of the close price using Taylor Series approximations. These approximations use polynomial terms to estimate the values of these trigonometric functions.
Mathematical Component Formation:
2. The calculated sine and cosine values are then multiplied together. This gives us the primary mathematical component, termed as the 'trigComponent'.
Smoothing Process:
3. To ensure that our indicator is less susceptible to market noise and more reactive to genuine price movements, this 'trigComponent' undergoes a smoothing process using a simple moving average (SMA). The length of this SMA is defined by the user.
Logarithmic Transformation:
4. With our smoothed value, we apply a natural logarithm approximation. Again, this approximation is based on the Taylor expansion. This step ensures that all resultant values are positive and offers a different scale to interpret the smoothed component.
Dynamic Scaling:
5. To make our indicator more readable and comparable over different periods, the logarithmically transformed values are scaled between a range. This range is determined by the highest and lowest values of the transformed component over the user-defined 'lookback' period.
ROC (Rate of Change) Direction:
6. The direction of change in our scaled value is determined. This offers a quick insight into whether our mathematical component is increasing or decreasing compared to the previous value.
Visualization:
7. Finally, the indicator plots the dynamically scaled and smoothed mathematical component on the chart. The color of the plotted line depends on its direction (increasing or decreasing) and its boundary values.

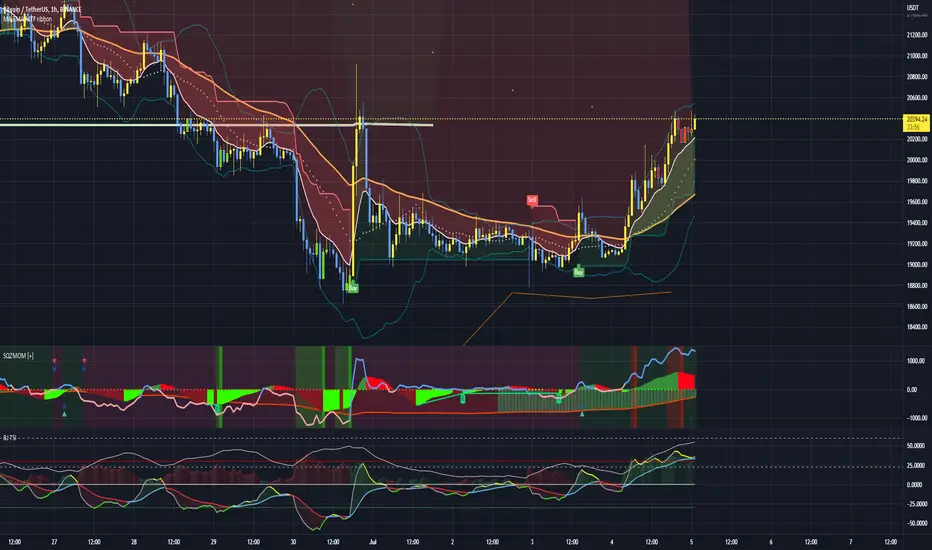
TTM Waves ABC ATR AO MOM SQZ//All code picked from many indicators, if you recognize your code, pls comment so people can see your awesome work! I only edited and added them all together so people don't use all their indicator slots. Hope this indicator helps as many people as it can. LFG!!!
AO (Awesome Oscillator) Useful to find potential reversals in trend.
MOM (Momentum) An oscillator that measures momentum.
ATR (Average True Range) Measures the upside and downside from the average price movement occuring. 1 ATR is the general measurement. Many traders use 2ATR to set a stop and 4ATR to set take profit from their entry based on current reading from the ATR.
SQZ ( TTM Squeeze) Measures when bollinger bands have left the interior of the Keltner Channel in an attempt to predict volatility thats about to happen to either side. Green = Move is probably about to happen.
TTM Waves ( Waves A, B, and C) Measure the previous candles to determine chop, positive or negative trends. C measures the previous 30 candles or so, B the last 15 or so, and A measures the last 8 or so. You can use all three or just one. You can sneak in a move if the 2 fastest ones have moved into your preferred area. (Positive or Negative) If the wave is not fully positve or negative then that is probably chop.
-Penguincryptic

RSI MTF [Market Yogi]The Multi-Time Frame RSI with Money Flow Index and Average is a powerful trading indicator designed to help traders identify overbought and oversold conditions across multiple time frames. It combines the Relative Strength Index (RSI) with the Money Flow Index (MFI) and provides an average value for better accuracy.
The Relative Strength Index (RSI) is a popular momentum oscillator that measures the speed and change of price movements. It oscillates between 0 and 100 and is used to identify overbought and oversold conditions in an asset. By incorporating the RSI across multiple time frames, this indicator offers a broader perspective on market sentiment.
In addition to the RSI, this indicator also includes the Money Flow Index (MFI). The MFI is a volume-based oscillator that measures the inflow and outflow of money into an asset. It takes into account both price and volume, providing insights into the strength and direction of buying and selling pressure.
By combining the RSI and MFI across multiple time frames, traders gain a comprehensive understanding of market dynamics. The indicator allows for comparing the RSI and MFI values across different time frames, enabling traders to identify divergences and potential trend reversals.
Furthermore, this indicator provides an average value of the multi-time frame RSI, offering a consolidated signal that helps filter out noise and enhance the accuracy of trading decisions.
Key Features:
1. Multi-Time Frame RSI: Combines the RSI across different time frames to provide a comprehensive view of market sentiment.
2. Money Flow Index (MFI): Incorporates the MFI to gauge buying and selling pressure based on both price and volume.
3. Average Calculation: Computes the average value of the multi-time frame RSI to generate a consolidated trading signal.
4. Divergence Detection: Enables traders to spot divergences between the RSI and MFI values, indicating potential trend reversals.
5. Overbought and Oversold Levels: Highlights overbought and oversold levels on the RSI, aiding in timing entry and exit points.
The Multi-Time Frame RSI with Money Flow Index and Average is a versatile tool that can be applied to various trading strategies, including trend following, swing trading, and mean reversion. Traders can adjust the time frame settings to suit their preferences and trading style.
Note: It's important to use this indicator in conjunction with other technical analysis tools and indicators to validate signals and make informed trading decisions.

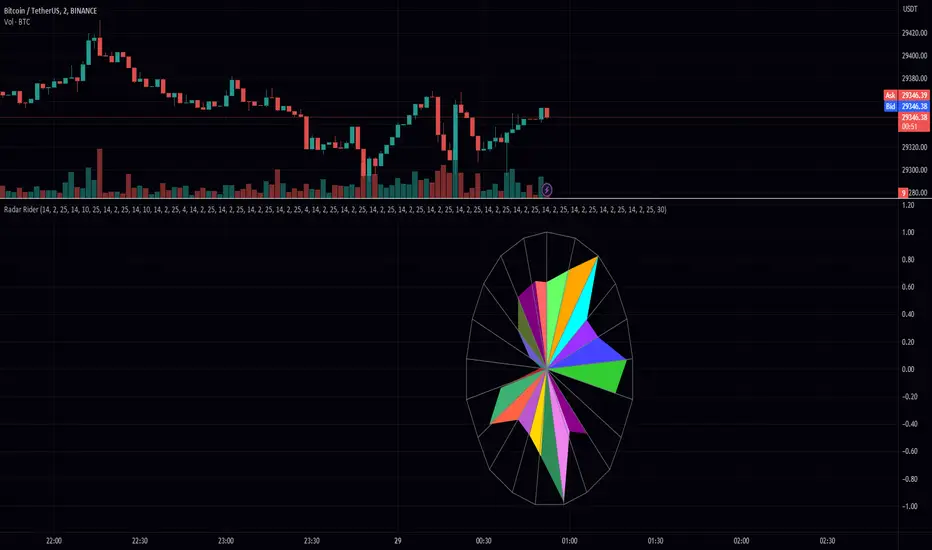
Radar RiderThe Radar Rider indicator is a powerful tool that combines multiple technical indicators into a single spider plot, providing traders with a comprehensive view of market conditions. This article will delve into the workings of each built-in indicator and their arrangement within the spider plot. To better understand the structure of the script, let's first examine some of the primary functions and how they are utilized in the script.
Normalize Function: normalize(close, len)
The normalize function takes the close price and a length as arguments and normalizes the price data by scaling it between 0 and 1, making it easier to compare different indicators.
Exponential Moving Average (EMA) Filter: bes(source, alpha)
The EMA filter is used to smooth out data using an exponential moving average, with the given alpha value defining the level of smoothing. This helps reduce noise and enhance the trend-following characteristics of the indicators.
Maximum and Minimum Functions: max(src) and min(src)
These functions find the maximum and minimum values of the input data over a certain period, respectively. These values are used in the normalization process and can help identify extreme conditions in the market.
Min-Max Function: min_max(src)
The min-max function scales the input data between 0 and 100 by dividing the difference between the data point and the minimum value by the range between the maximum and minimum values. This standardizes the data, making it easier to compare across different indicators.
Slope Function: slope(source, length, n_len, pre_smoothing = 0.15, post_smoothing = 0.7)
The slope function calculates the slope of a given data source over a specified length, and then normalizes it using the provided normalization length. Pre-smoothing and post-smoothing values can be adjusted to control the level of smoothing applied to the data before and after calculating the slope.
Percent Function: percent(x, y)
The percent function calculates the percentage difference between two values, x and y. This is useful for comparing the relative change in different indicators.
In the given code, there are multiple indicators included. Here, we will discuss each of them in detail.
EMA Diff:
The Exponential Moving Average (EMA) Diff is the difference between two EMA values of different lengths. The EMA is a type of moving average that gives more weight to recent data points. The EMA Diff helps traders identify trends and potential trend reversals. In the code, the EMA Diff is calculated using the ema_diff() function, which takes length, close, filter, and len_norm as parameters.
Percent Rank EMA Diff:
The Percent Rank EMA Diff is the percentage rank of the EMA Diff within a given range. It helps traders identify overbought or oversold conditions in the market. In the code, the Percent Rank EMA Diff is calculated using the percent_rank_ema_diff() function, which takes length, close, filter, and len_norm as parameters.
EMA Diff Longer:
The EMA Diff Longer is the difference between two EMA values of different lengths, similar to EMA Diff but with a longer period. In the code, the EMA Diff Longer is calculated using the ema_diff_longer() function, which takes length, close, filter, and len_norm as parameters.
RSI Filter:
The Relative Strength Index (RSI) is a momentum oscillator that measures the speed and change of price movements. The RSI Filter is the RSI value passed through a filter to smooth out the data. In the code, the RSI Filter is calculated using the rsi_filter() function, which takes length, close, and filter as parameters.
RSI Diff Normalized:
The RSI Diff Normalized is the normalized value of the derivative of the RSI. It helps traders identify potential trend reversals in the market. In the code, the RSI Diff Normalized is calculated using the rsi_diff_normalized() function, which takes length, close, filter, len_mad, and len_norm as parameters.
Z Score:
The Z Score is a statistical measurement that describes a value's relationship to the mean of a group of values. In the context of the code, the Z Score is calculated for the closing price of a security. The z_score() function takes length, close, filter, and len_norm as parameters.
EMA Normalized:
The EMA Normalized is the normalized value of the EMA, which helps traders identify trends and potential trend reversals in the market. In the code, the EMA Normalized is calculated using the ema_normalized() function, which takes length, close, filter, and len_norm as parameters.
WMA Volume Normalized:
The Weighted Moving Average (WMA) Volume Normalized is the normalized value of the WMA of the volume. It helps traders identify volume trends and potential trend reversals in the market. In the code, the WMA Volume Normalized is calculated using the wma_volume_normalized() function, which takes length, volume, filter, and len_norm as parameters.
EMA Close Diff Normalized:
The EMA Close Diff Normalized is the normalized value of the derivative of the EMA of the closing price. It helps traders identify potential trend reversals in the market. In the code, the EMA Close Diff Normalized is calculated using the ema_close_diff_normalized() function, which takes length, close, filter, len_mad, and len_norm as parameters.
Momentum Normalized:
The Momentum Normalized is the normalized value of the momentum, which measures the rate of change of a security's price. It helps traders identify trends and potential trend reversals in the market. In the code, the Momentum Normalized is calculated using the momentum_normalized() function, which takes length, close, filter, and len_norm as parameters.
Slope Normalized:
The Slope Normalized is the normalized value of the slope, which measures the rate of change of a security's price over a specified period. It helps traders identify trends and potential trend reversals in the market. In the code, the Slope Normalized is calculated using the slope_normalized() function, which takes length, close, filter, and len_norm as parameters.
Trend Intensity:
Trend Intensity is a measure of the strength of a security's price trend. It is based on the difference between the average of price increases and the average of price decreases over a given period. The trend_intensity() function in the code calculates the Trend Intensity by taking length, close, filter, and len_norm as parameters.
Volatility Ratio:
The Volatility Ratio is a measure of the volatility of a security's price, calculated as the ratio of the True Range (TR) to the Exponential Moving Average (EMA) of the TR. The volatility_ratio() function in the code calculates the Volatility Ratio by taking length, high, low, close, and filter as parameters.
Commodity Channel Index (CCI):
The Commodity Channel Index (CCI) is a momentum-based oscillator used to help determine when an investment vehicle is reaching a condition of being overbought or oversold. The CCI is calculated as the difference between the mean price of a security and its moving average, divided by the mean absolute deviation (MAD) of the mean price. In the code, the CCI is calculated using the cci() function, which takes length, high, low, close, and filter as parameters.
These indicators are combined in the code to create a comprehensive trading strategy that considers multiple factors such as trend strength, momentum, volatility, and overbought/oversold conditions. The combined analysis provided by these indicators can help traders make informed decisions and improve their chances of success in the market.
The Radar Rider indicator is a powerful tool that combines multiple technical indicators into a single, easy-to-read visualization. By understanding the inner workings of each built-in indicator and their arrangement within the spider plot, traders can better interpret market conditions and make informed trading decisions.
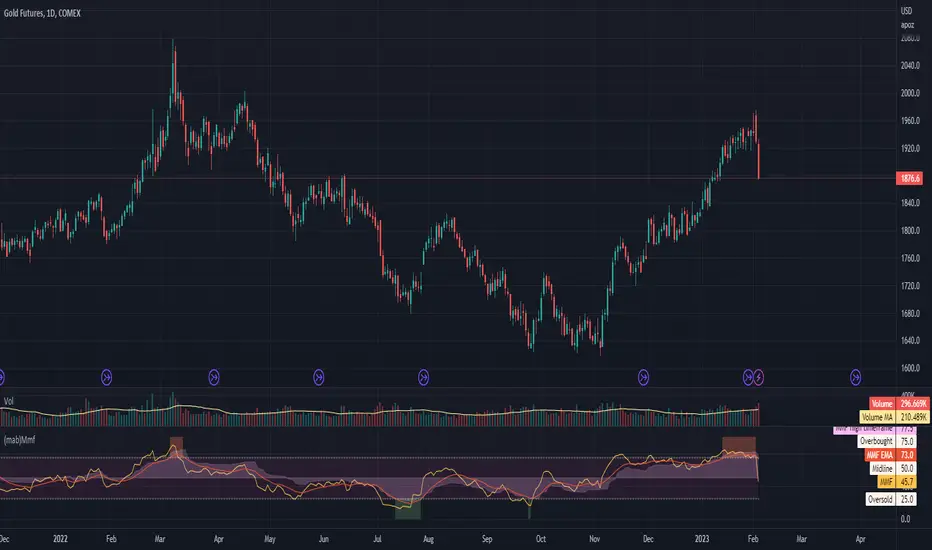
(mab) Money Flow - MMFThis indicator implements the (mab) Money Flow (MMF). The MMF is calculated using a formula inspired by RSI. In contrast to RSI, MMF uses the average of open, high, low and close as price source. This price is then multiplied with the volume as input for the RSI like formula to calculate the value.
Features:
- Volume weighted price momentum oscillator
- Uses average of open, close, high and low as price component to make the signal less choppy while still as fast
- EMA on MMF
- Highlighting when EMA is in oversold or overbought area
- Alarms
Note that the MMF formula is different than the formula used for other money flow indices like MFI or CMF.
Why do we need another money flow indicator if there are already many established ones? Well I used and tested many money flow indicators including MFI and CMF among others. However, none of them showed the results I was looking for. MFI for example uses a simpler formula for the calculation, which results in a different reading that isn't showing divergences as clearly as I would like. CMF on the other hand has no defined maximum or minimum (similar to MACD) so that it's difficult to determine overbought and oversold values. The MMF is an oscillator with a minimum value of 0 and a maximum value of 100 like RSI. The usage of the average of open, close, high and low as price element makes it less choppy compared to RSI while it still reacts as fast to movements.
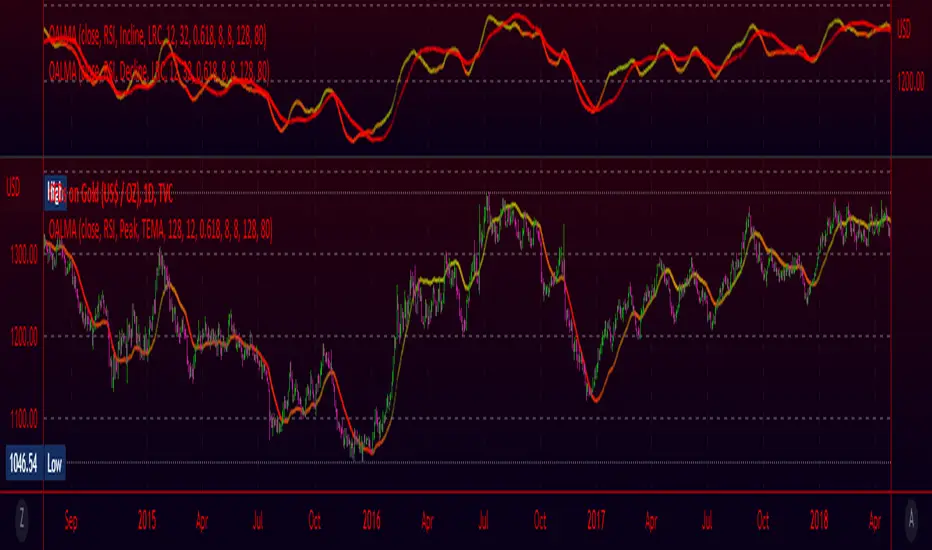
Oscillating Length Moving Averages***CREDIT TO TradingView's TA Library*** (), Attempted to use "import TradingView/ta/4" to import the library, but for whatever reason
some of the functions failed to work, while others had no issue, so I opted to just copy paste what I wanted to use.
This moving average uses an oscillator to influence the length used during calculation. Extremely customizable/tunable with ability to change Max and Min length values, length multiplier, length multiple,4 different settings ,( Decline , <>Peak, >Decline , <>Peak, >
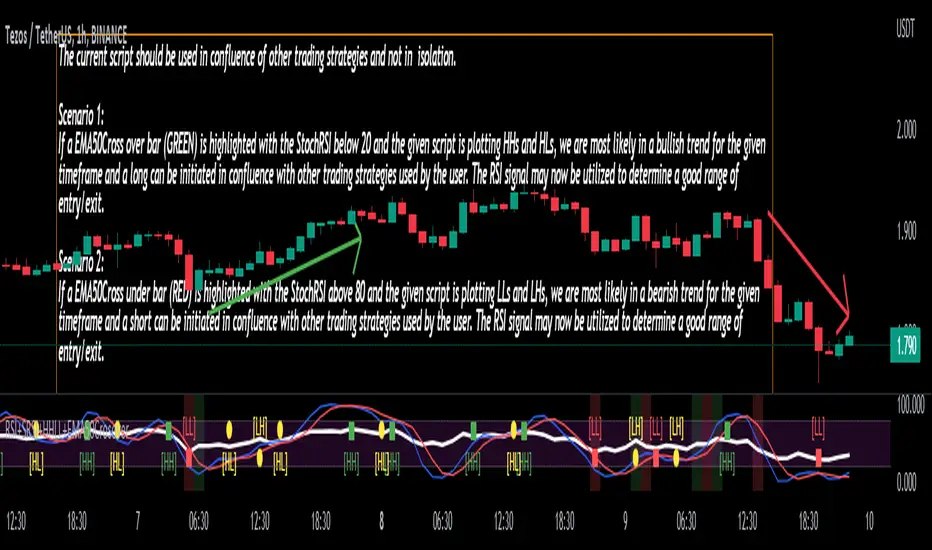
Stoch/RSI with EMA50 Cross & HHLLA hybrid but simple indicator that plots 4 strategies in one pane .
1) RSI Indicator
2) Stoch RSI
3) EMA50 Cross (To determine direction in current timeframe)
4) Higher Highs & Lower Lows to analyze the trend and break of trend
The relative strength index (RSI) is a momentum indicator used in technical analysis. It is displayed as an oscillator (a line graph) on a scale of zero to 100. When the RSI indicator crosses 30 on the RSI chart, it is a bullish sign and when it crosses 70, it is a bearish sign.
The Stochastic RSI (StochRSI) is also a momentum indicator used in technical analysis. It is displayed as an oscillator (a line graph) on a scale of zero to 100. When the StochRSI indicator crosses 20 on the RSI chart, it is a bullish sign and when it crosses 80, it is a bearish sign.
The EMA50Cross denotes two cases in the script:
a) A crossover of CMP on the EMA50 is highlighted by a green bar signals a possible bullish trend
b) A crossunder of CMP on the EMA50 is highlighted by a red bar signals a possible bearish trend
The HHLL is denoted by mneumonics HH, HL,LH, LL. A combination of HHs and HLs denotes a uptrend while the combination of LLs and LHs denoted a downtrend
The current script should be used in confluence of other trading strategies and not in isolation.
Scenario 1:
If a EMA50Cross over bar (GREEN) is highlighted with the StochRSI below 20 and the given script is plotting HHs and HLs, we are most likely in a bullish trend for the given timeframe and a long can be initiated in confluence with other trading strategies used by the user. The RSI signal may now be utilized to determine a good range of entry/exit.
Scenario 2:
If a EMA50Cross under bar (RED) is highlighted with the StochRSI above 80 and the given script is plotting LLs and LHs, we are most likely in a bearish trend for the given timeframe and a short can be initiated in confluence with other trading strategies used by the user. The RSI signal may now be utilized to determine a good range of entry/exit.
Disclaimer:
The current script should be used in confluence with other trading strategies and not in isolation. The scripts works best on 4H and 1D Timeframes and should be used with caution on lower timeframes.
This indicator is not intended to give exact entry or exit points for a trade but to provide a general idea of the trend & determine a good range for entering or exiting the trade. Please DYOR
Credit & References:
This script uses the default technical analysis reference library provided by PineScript (denoted as ta)
Squeeze Momentum Indicator + 2.0This is a squeeze momentum oscillator with ADX-RSI, Elliot waves oscillator, HMA background and more.
I recommend configure ADX-RSI with the following settings:
-ADX Length = 14
-ADX smooth = 14
-RSI Length = 14
-Threshold = 15
-Upline = 70
-Downline = 30
Thanks to OskarGallard for develop this indicator.
I am Sc4lp1ng, the developer of EMA MTF cloud and TSI-ADX Histogram.
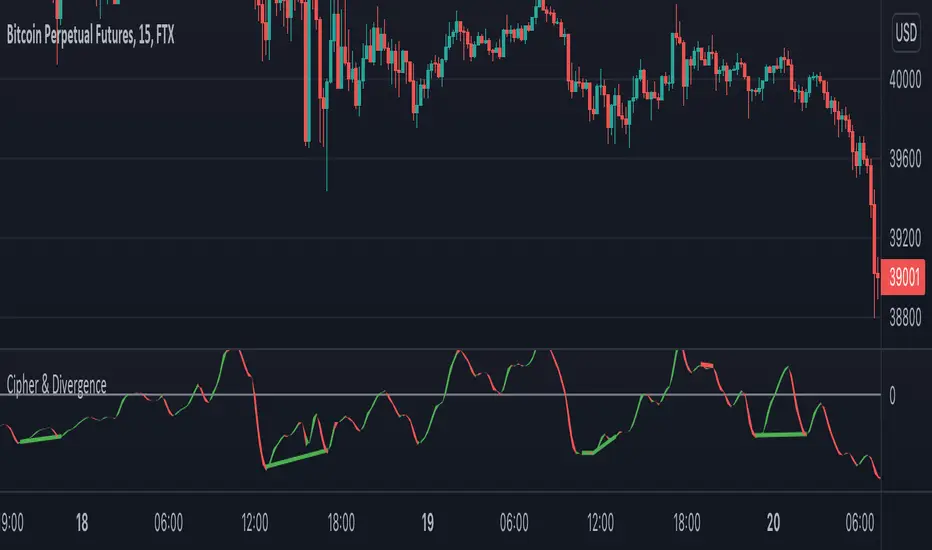
Cipher & DivergenceFor a long time I've been using complicated script with too much informations in it.
In this one I try to have just the bare minimum information to be able to analyse and find a potential reversal zone.
It is inspired from different wave trend / cipher script but has been tuned after months of backtest.
Extending the usage of the wave trend oscillator, which can be used with overbuy & oversell zone it might be better to wait for a confirmation of the movement. This confirmation can be identified by a pull back of the wave trend & price.
We can even confort ourself by waiting for reversal indicators.
Reversal may occurs after a divergence, wait for it, a cross of zero line followed by a PB to find your entry.
You can setup alert on bear / bull divergence but also when the wave trend cross the zero line to never miss a potential trade.
Huge thanks to LazyBear for his wave trend
And thanks vumanchu for his huge cipher script which was very useful for divergence finder
Compound IndicatorThis is an indicator finds end points of short term market trends. this is a combination of many indicators such as
1. Volume change oscillator
2. Money flow index (MFI)
3. Momentum Oscillator (MOM)
4. Stochastic Indicator
6. Relative Strength Indicator (RSI)
7. Relative volatility index (RVI)
8. Balance of power (BOP)
9. Small moving average (SMA)
10. Exponential moving average (EMA)
11. Parabolic SAR
12. Super trend indicator
this script forms a compound indicator after analysing movements of those indicators through different time frames and measure its co-relation and variance with the price action. buy doing that, indicator in a position to identify short term market reversals and presented.

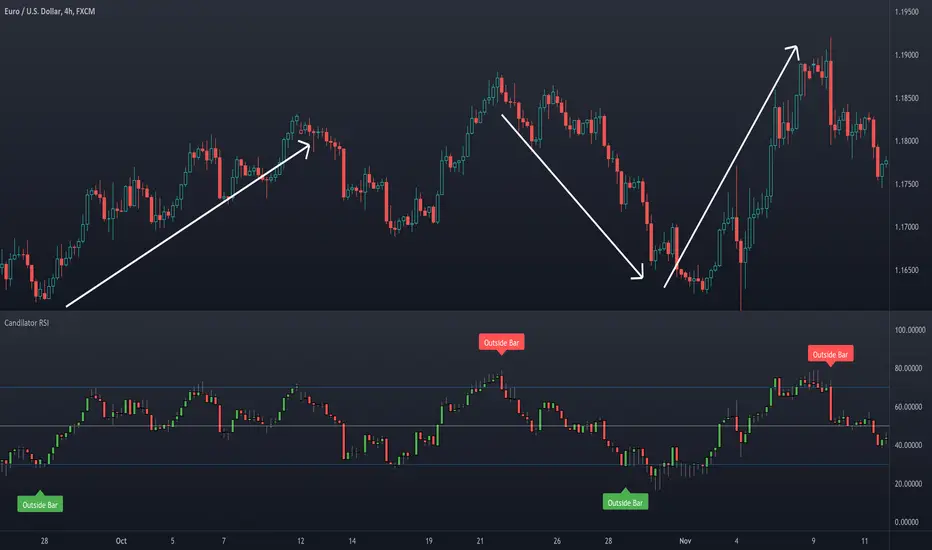
Candilator RSI [AstrideUnicorn]OVERVIEW
The name Candilator comes from blending the words "candlestick" and "oscillator". And as the name suggests, this indicator is a good old RSI plotted as a candlestick chart. To produce a candlestick chart, Candilator RSI calculates four RSI's based on the open, high, low, and close time series. It also has a candlestick patterns detection feature.
HOW TO USE
You can use Candilator RSI as a normal RSI to analyze momentum, detect overbought and oversold markets, and find the oscillator's divergences with the price. You can also get creative and apply all sorts of technical analysis to the RSI candlestick chart, including candlestick patterns analysis.
Candilator RSI can automatically scan the price for some candlestick patterns in the overbought and oversold zones. This feature can help detect price reversals early.
SETTINGS
The indicator settings are divided into two groups: Main Settings and Pattern Detection. In the Main Settings, you can find standard RSI settings. In the Pattern Detection part, you can turn on and off the automatic search for a particular candlestick pattern.
Currency Strength Meter [HeWhoMustNotBeNamed]⬜ Note: This is not the strength of currency pairs. But, in this script we are trying to derive strength of individual currencies by matching against single base currency.
⬜ Process
This is based on similar concept as that of Magic Numbers for stocks. Idea is simple.
▶ Calculate strength of each currency against USD. Derive the strength for both price movement and volume movement.
▶ Similarly calculate momentum of price and volume change.
▶ If USD is base currency, inverse momentum and strength index for the given symbol.
▶ Once these calculations are done, rank each currencies based on individual score on given things.
▶ Add up all the ranks to derive combined rank
▶ sort the currencies in the ascending order of overall rank.
⬜ USAGE
▶ Identify a base currency. In our case, we have used USD as base currency as it is easy to get pairs of all currencies with USD.
▶ Identify most used combos for all other currencies which are paired with USD. Fx pair can either have USD as base currency or quote currency. It is desirable to use the pair which is most traded. For example, USDJPY is more traded pair than JPYUSD - hence it is advisable to use USDJPY instead of JPYUSD. Similarly AUDUSD is more traded than USDAUD - hence choosing AUDUSD for the purpose of this exercise is better approach. Notice that USDJPY has USD as base currency whereas AUDUSD has USD as quote currency. These calculations are handled internally to derive the right outcome irrespective of position of USD in the pair.
▶ Identify the forex broker which has all the selected forex tickers. All comparison is done against a single broker. Hence, choosing broker which does not wide range of forex pairs will show NAN for many rows.
▶ Once we set these, we get tabular output containing strength and oscillator based trend indexes for both price and volume indicator. Currencies are ordered in descending order of strength. Hence, top of the list can be considered as currency having highest strength and bottom of the table can be considered as currency having lowest strength. Please note that the calculation is valid only for selected timeframe and users can set other parameters such as moving average type, oscillator type, length etc which can alter the outcome.
▶ Use multiple timeframes to find out stronger and weaker currencies. Use directional indicators to understand where they are heading. Combine all these info to come up with currency pair you would like to trade :)
⬜ Settings
▶ Main settings and Currencies
Base Currency : This is set to USD by default as rest of the tickers used are paired with USD. Whatever the base currency is selected, rest of the tickers should follow the same combination.
Timeframe : Timeframe for which rankings need to be calculated.
Currencies : These should be the currency pair which involve base currency defined in the setting on either side.
▶ Display
Table : Allows users to set table location and size of the table. By default this is set to middle center and default size is normal. If user want to use multiple timeframes side by side, they can do so by changing these display settings.
Stat Type : To show either comparative ranking or actual indicator values

cowen risk indexThis is my attempt at remaking the cowen risk index. It's definitely not correct, but should give a rough estimate of where his indicator is at. I am taking the price divided by the 400sma to get an oscillator, then we need to account for diminishing returns so I just made an exponentially increasing variable and mutliplying that by the oscillator value. Then I normalized the data as best as I could. Not sure exactly how to do that so if anyone has any suggestions, please let me know.
This only works on the daily and weekly timeframe. You will need to edit the code if you want to have it work for other timeframes.

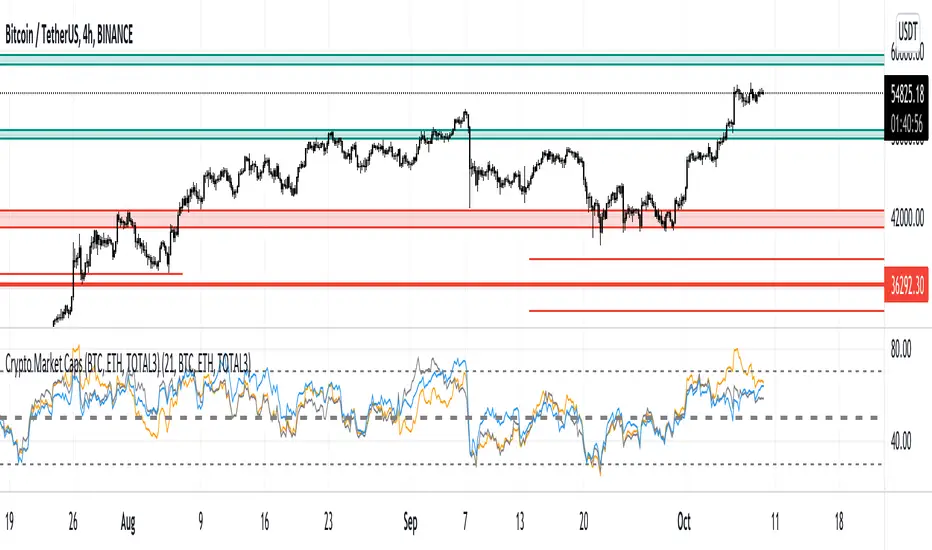
Crypto Market Caps (BTC, ETH, TOTAL3)RSI based Crypto Market Caps (BTC, ETH, TOTAL3) Oscillator
This oscillator displays market caps for:
BTC : CRYPTOCAP:BTC -> in orange
ETH : CRYPTOCAP:ETH -> in gray
ALT (Total crypto excl. BTC & ETH): CRYPTOCAP:TOTAL3 -> in blue
In the settings you can edit:
The 3 market cap symbols
RSI length
All colours ;-)
Hope you enjoy!
% Divergence of RSIA simple script that plots the difference between the %ROC of price vs the %ROC of RSI, AKA the % of divergence. A simple way to analyze how strong a potential divergence is. Top reversals are above 0, bottom reversals are below. A value of 0 means price and RSI are changing by the same % value. So, if oscillator is moving up as price moves up, it means divergence is increasing. If oscillator moves down as price moves up, it means divergence is decreasing.

MTF VWAPA simple wavetrend oscillator based off WaveTrend Oscillator by @LazyBear to visualise 4 different timeframe vwap under 1 chart.
Timeframe can be changed in indicator settings in minutes. Unnecessary waves can be removed by unchecking said TF wave in Style settings.

Repulse-AORepulsion Engine is a proof of concept for a series of indicators using repulsion, as re-contextualized from the following:
www.quantamagazine.org
In my view, the technique is unique, and therefore a new category of indicator, but that distinction will, obviously, be left to the community and to the moderators. One thing that can be said is repulsion appears to be applicable to more than RSI, and while it's not featured here, it has been tested in other related work using SMA, EMA and HMA signal artefacts. Still, the script is raw and not overly clean. One might hope for a git-like versioning system and vertically oriented script window, but that would be playing the blame game, and I would lose that battle. Trading View is awesome as it is and getting better all the time.
This script features an experimental oscillator branch, also utilising some off-in-left-field number theory by which a link is posited to have been made to a fractal domain, around which the oscillator 'more subtly' picks up price movement. Three interrelated pairs are involved, but to avoid long-winded explanation, you might want to just play with changing out XRPUSDT and XRPBTC for two other similarly related securities. Several other scripts on the workbench over here automate this process.
No doubt, more able programmers will easily enhance this and other scripts which arise. If there's interest in this one, more of the raw 'it's not really ready' scripts will likely follow, so people can dig in and do their own mashups sooner rather than later, tossing what is bad and enhancing what is good.
It might be better, and garner a lot less flaming, if this indicator is described as experimental all the way through.
Stubs are present here for users to test performance on their own.
I hope you get something out of it, and if you make one of your own or move this along to a higher standard that you drop me a line to let me know. I'm always eager to learn and to grow.