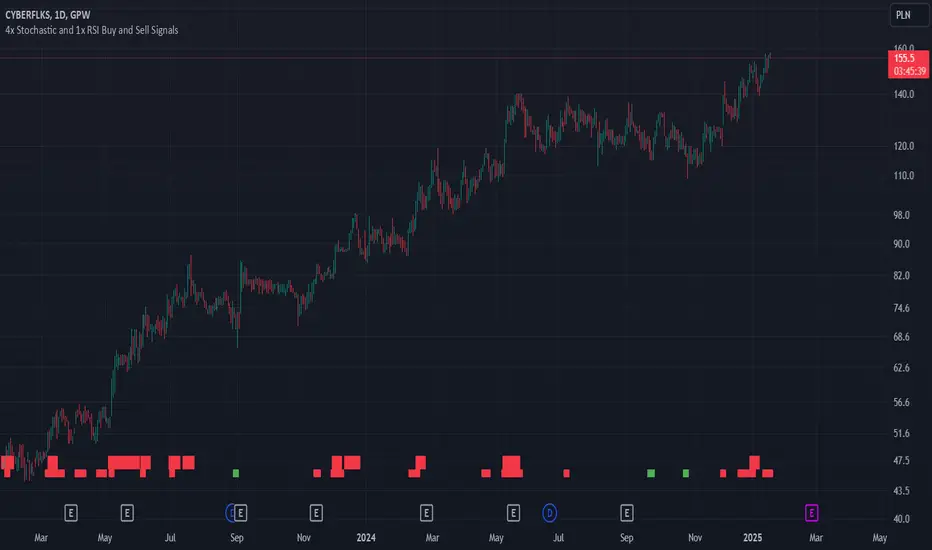
4x Stochastic and 1x RSI Buy and Sell SignalsBuy signal (green), when Stochastic 9, 14, 40 and 60 are bellow 20.
Sell signal (red), when Stochastic 9, 14, 40 and 60 are above 80.
Buy signal is larger, when RSI is also bellow 30.
Sell signal is larger, when RSI is also above 70.
Using RSI is optional and can be disabled.
Use this signals when confirmed by another indicators, like support and resistance levels, EMAs and fundamental analysis.
Recherche dans les scripts pour "stoch"
Stochastic candles "Stochastic Candles" is designed to provide higher timeframe stochastic calculations and enhance the chart with additional visual aids like colored candles and EMA plotting.
Features of the Script:
Higher Timeframe Stochastic Calculation:
This indicator computes the stochastic %K and %D values for a specified higher timeframe and ensures these values are fetched for the higher timeframe data.
Dynamic Label Placement:
The script places labels on the chart displaying the %K and %D values above and below the bars, respectively.
Labels are dynamically deleted after being updated, ensuring only the latest values are visible.
Candle Coloring:
Candles are colored blue if %K > %D, yellow if %D > %K, and retain the default color otherwise.
Exponential Moving Average (EMA):
This indicator work fine . Consolidate market put effects on its performance .

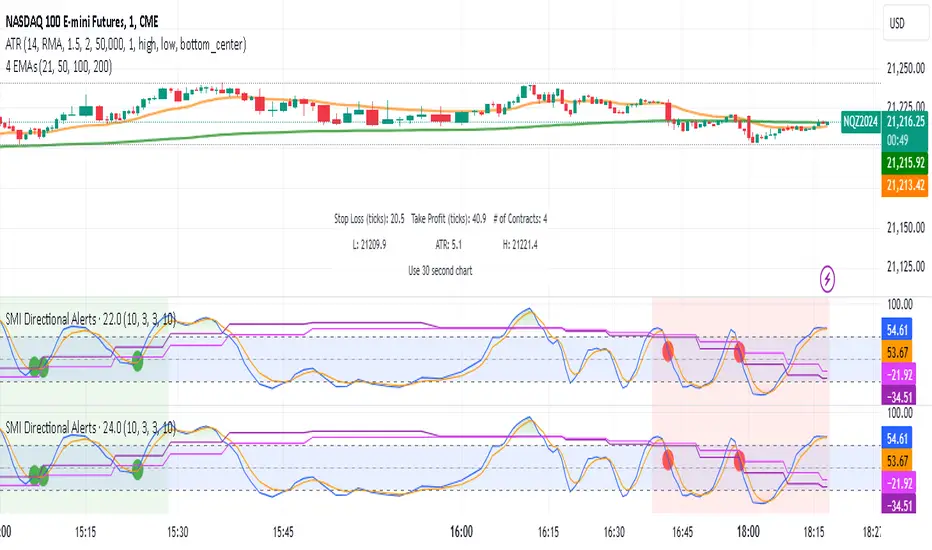
Dual Timeframe Stochastic Momentum Index w/buy sell signalsThis indicator combines momentum analysis across two timeframes to identify high-probability trading opportunities. It plots the Stochastic Momentum Index (SMI) for both the chart timeframe and a higher timeframe (default 10 minutes) to help traders align with the broader market trend.
Key Features
Displays SMI and its EMA for both timeframes
Background shading indicates favorable trading conditions
Signal dots mark potential entry points
Customizable parameters for fine-tuning
Signals Explained
Bullish Signals (Green Dots)
Appear when the chart timeframe SMI crosses above its EMA
Only trigger during periods when the higher timeframe shows:
SMI is above its EMA (increasing momentum)
SMI is between -40 and +40 (not overbought/oversold)
Bearish Signals (Red Dots)
Appear when the chart timeframe SMI crosses below its EMA
Only trigger during periods when the higher timeframe shows:
SMI is below its EMA (decreasing momentum)
SMI is between -40 and +40 (not overbought/oversold)
Settings
%K Length: Lookback period for SMI calculation (default: 10)
%D Length: Smoothing period for primary calculation (default: 3)
EMA Length: Smoothing period for signal line (default: 3)
Alternative Timeframe: Higher timeframe for trend analysis (default: 10 minutes)
Best Practices
Use higher timeframe signals to determine market bias
Wait for signal dots in the chart timeframe for entry timing
Avoid trades when higher timeframe SMI is in extreme zones (above 40 or below -40)
Consider additional confirmation from price action or other indicators
Note: This indicator combines trend and momentum analysis but should be used as part of a complete trading strategy that includes proper risk management.
TASC 2023.06 Stochastic Distance Oscillator█ OVERVIEW
This script implements the stochastic distance oscillator (SDO) , a momentum indicator introduced by Vitali Apirine in an article featured in TASC's June 2023 edition of Traders' Tips . The SDO is a variation of the classic stochastic oscillator and is designed to identify overbought and oversold levels, as well as detect bull and bear trend changes.
█ CONCEPTS
Unlike the classic stochastic oscillator, which compares an asset's price to its past price range, the SDO measures the size of the current distance relative to the maximum-minimum distance range over a set number of periods. The current distance is defined as the distance between the current price and the price n periods ago.
The readings of the SDO can be used to identify the following states of the asset price:
Uptrend state: the oscillator crosses over 50 from a non-uptrend state.
Downtrend state: the oscillator crosses under -50 from a non-downtrend state.
Overbought state: the oscillator is in an uptrend and crosses -50 for the first time.
Oversold state: the oscillator is in a downtrend and crosses 50 for the first time.
Trend continuity: the oscillator crosses 0 in the direction of the current trend.
The script indicates these five conditions using on-chart signals and background coloring.
█ CALCULATIONS
The SDO is calculated as follows:
1. Calculate the distance between the current price and the price n periods ago, as well as the maximum and minimum distances for the selected lookback period. The author recommends using one of two values of n , 14 or 40 bars.
2. Calculate the time series % D that represents the relation between the asset's current distance and its distance range over a loockback period:
% D = (Abs(current distance) − Abs(minimum distance)) / (Abs(maximum distance) − Abs(minimum distance)) * 100
3. Use the calculated % D to obtain the SDO:
If the closing price is above the close n periods ago, SDO = % D
If the closing price is below the close n periods ago, SDO = −% D
If the closing price equals the close n periods ago or the current distance equals the minimum distance, SDO = 0
4. Smooth the SDO using an exponential moving average (EMA). The author recommends using an EMA in the range from 3 to 6 .
Adjustable input parameters include the number of periods n , the lookback period for calculating % D , the smoothing EMA length, and the overbought/oversold threshold level.

DEVIATION OF THE STOCHASTIC INDICATORThis new technical indicator uses the stochastic oscillator as its base and calculates the deviation of its moving average, generating an alternative view of market volatility.

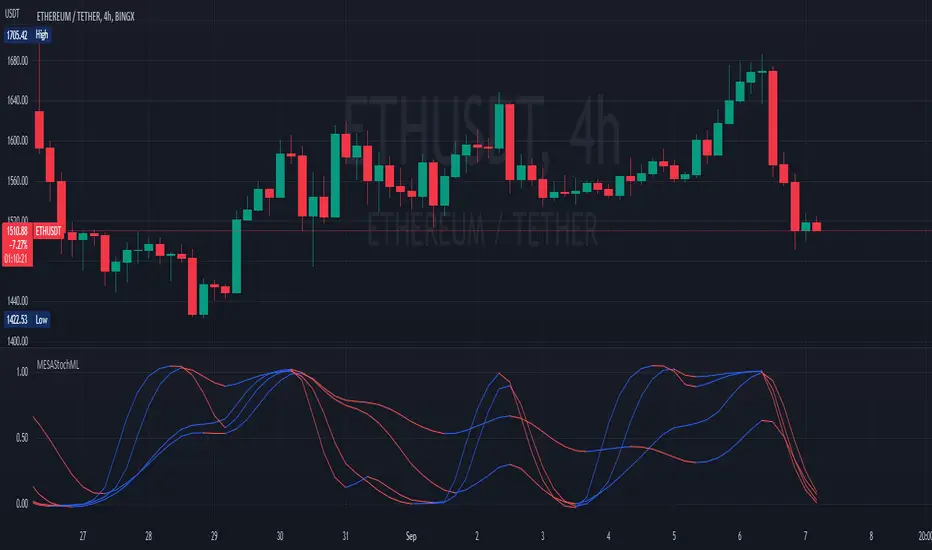
MESA Stochastic Multi LengthJohn Ehler's MESA Stochastic
It is updated and optimized version of script originally published by @veryfid.
Changes:
Converted to v5
Rewrote MESA Function. Same function can now calculate various length signals.
Modified super smoother. Indicator reacts faster to price change.
Optimized code. Functions are only called once per length.
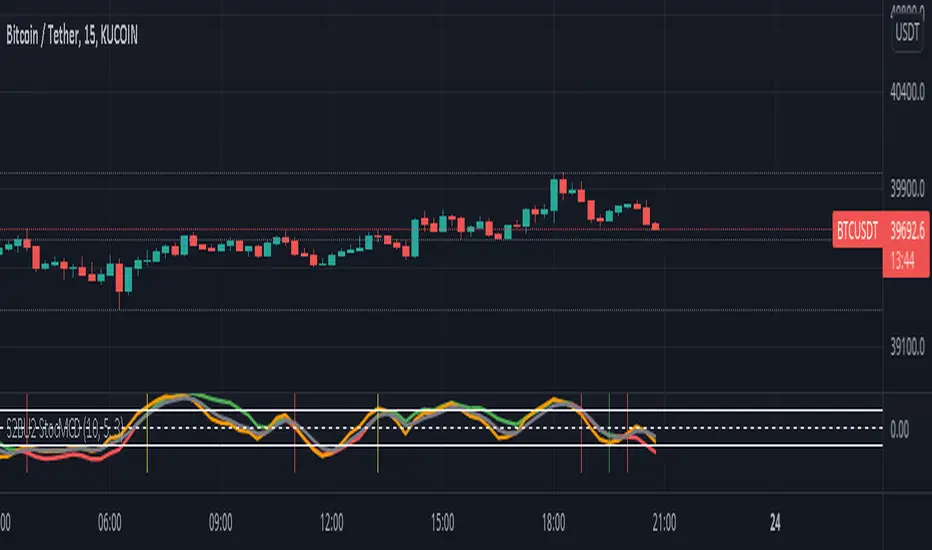
S2BU2 Stochastic Momentum Convergence DivergenceFair Use:
Please do not take my work and sell it under your own name. This was created to benefit everyone - not one person. Feel free however to use it as part of whatever work you wish to sell (of course i would applaud also giving ideas away for free - your choice though ;)
What it is:
This is a twist on the stochastic momentum indicator . It combines the classic stochastic momentum with a slow moving trendline to improve the warning signal for the end of a trend
How it works:
The classic Stochastic Momentum indicates an uptrend when the smi crosses above the signalline and conversely a downtrend when it crosses below.
The improved indicator also shows trend sustainability by displaying a vertical line when the trendline and signal line cross each other. Trendline above signalline indicates a sustained uptrend, trendline below signalline indicates a sustained downtrend.
How to use:
Note this is only a recommendation and not advice. Feel free to experiment and adjust the indicator to fit your tradingstyle. This is only my personal setup. Feel free to share your findings.
Set Alerts for crossovers between smi and signal on 1h and 4h. Also set alerts for crossovers between trend and signal on 4h.
(again, no advice - think for yourself!)
If smi and signal crossdown -> short
If smi and signal crossup -> long
If trend and signal crossdown between top and middle line-> major short
If trend and signal crossup between bottom and middle line -> major long
If trend and signal cross anywhere else -> get out and wait for a new signal
You could also stay in a trend for as long as the trendline does not crossover on the 4h. This works well for major trends and indicates very well the end it.
The end of a major trend is not necessarily the start of a major uptrend - there can and probably will be a consolidation phase.
This does not work well in a choppy market, do not keep a trade going until trend crossover if the market is choppy - you will mostly close with losses!
//chart
[JL] Stochastic Divergence AlertCompare two cross area:
k is increasing, low is lower and previous k is less than bottom level then it is bottom divergence
k is decrease, high is higher and previous k is more than top level then it is top divergence
With long term moving average(400), seems that Stochastic Divergence is more accurate than RSI Divergence on 1m chart.

Natural Stochastic Indicator [CC]The Natural Stochastic Indicator was created by Jim Sloman and this is another indicator from his Ocean series which I will eventually publish all of them. Big thanks to @altcoinz and @tmac87 for giving me all of the source code in order to publish Jim's life work. This is another momentum indicator but unlike a traditional stochastic indicator, this one doesn't use overbought and oversold levels. Instead it becomes a sell signal when the indicator starts getting lower and vice versa. This takes the classic approach to a stochastic and combines it with the time factor from Jim's Ocean Theory to create this new indicator. I have included strong buy and sell signals as darker colors and normal buy and sell signals as lighter colors. Buy when the line turns green and sell when it turns red.
Let me know if there are any other indicators you would like to see me publish!

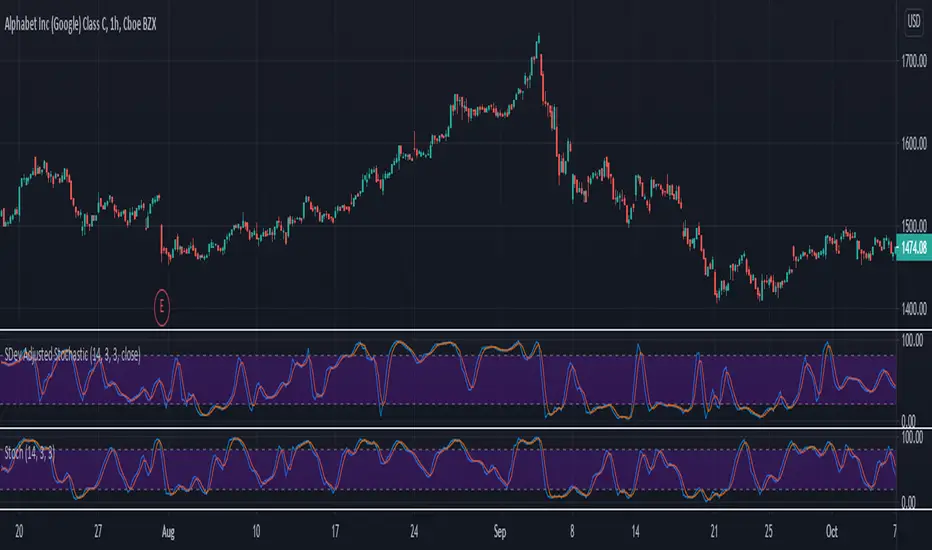
SDev Adjusted StochasticDescription : This Stochastic variant will auto-adjust stochastic period based on volatility measured by standard deviation.
The idea behind it are in highly volatile market, %K period will be reduced to account for recent price range,
while in low volatility market, %K period will be increased to account less of the recent price range.
This idea is based on one of medium article written by Sofien Kaabar with slight modification on the adjusting logic implementation. Any ideas to further improve this indicator are welcome :)
Disclaimer:
I always felt Pinescript is a very fast to type language with excellent visualization capabilities, so I've been using it as code-testing platform prior to actual coding in other platform.
Having said that, these study scripts was built only to test/visualize an idea to see its viability and if it can be used to optimize existing strategy.
While some of it are useful and most are useless, none of it should be use as main decision maker.
DMI Stochastic ToltecasModification of DMI Stochastic Indicator created by @usgears
- Added Crossing Up/Down Text Signal
- Added Crossing Up/Down Arrow Signal
- Added Crossing Up/Down Darts Signal
- Added Midline level
- Custom settings for oversold, midline and overbought levels to select a solid, dotted, or dashed line style.
- Added Background Color

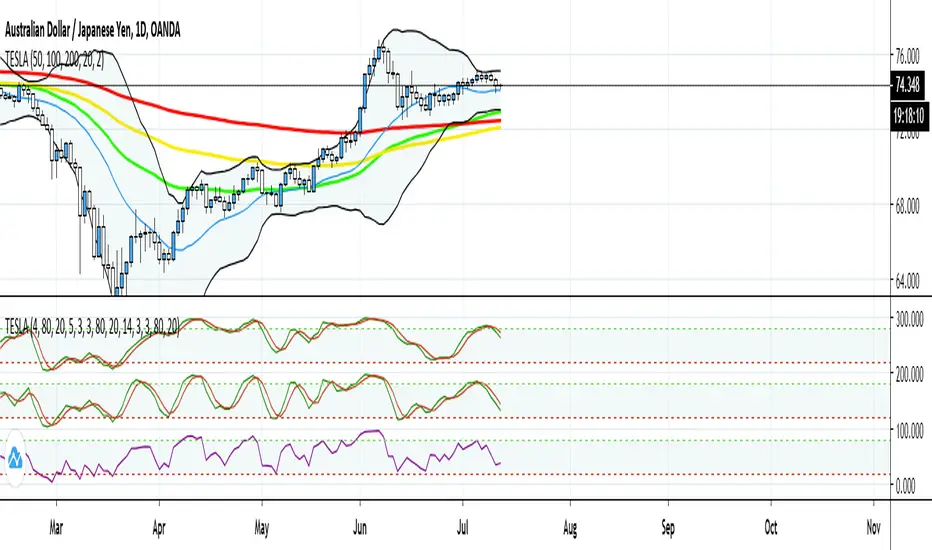
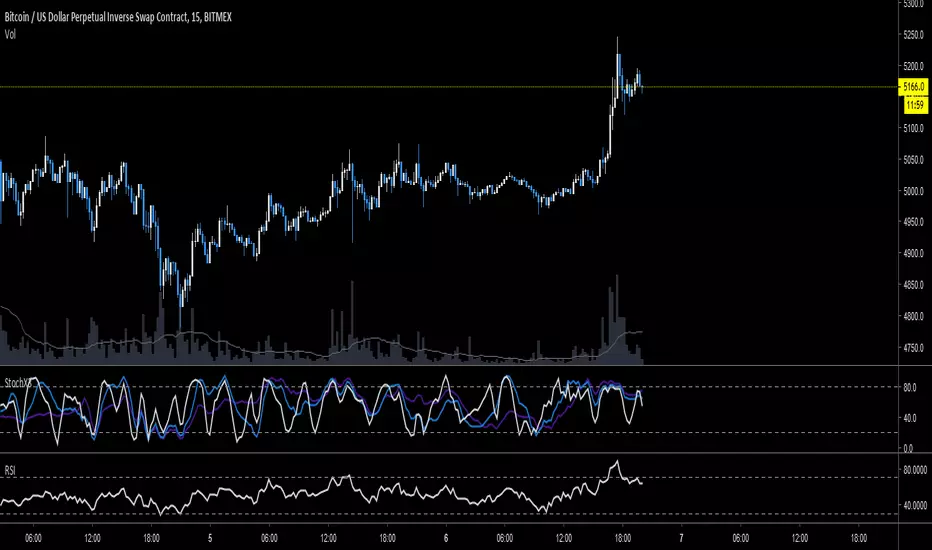
TESLA: RSI and StochasticThis script is part of the "TESLA" strategy and will help traders identifying overbought and oversold condition as well as other applications such as divergence. The features for this script are the following:
- 1 RSI index in order to identify market buying/selling strength
- 2x Stochastic in order to have fast and slow overbought and oversold zones.
Multi Time Frame StochasticThis Indicator draws 6 Stochastic Plots with different Time Frames showing only K Value.
Available Time Frames: 3m, 5m, 15m, 30m, 60m, 240m
Better Stochastic RSI to find DivergencesThis indicator is a modified version of a stochastic RSI oscillator. I want to share this because it is really good for analysis of divergence between price action and the oscillator. You can also use it to trade overbought and oversold conditions.
To find out more what a divergences is when we talk about trading. Take a look at this: medium.com


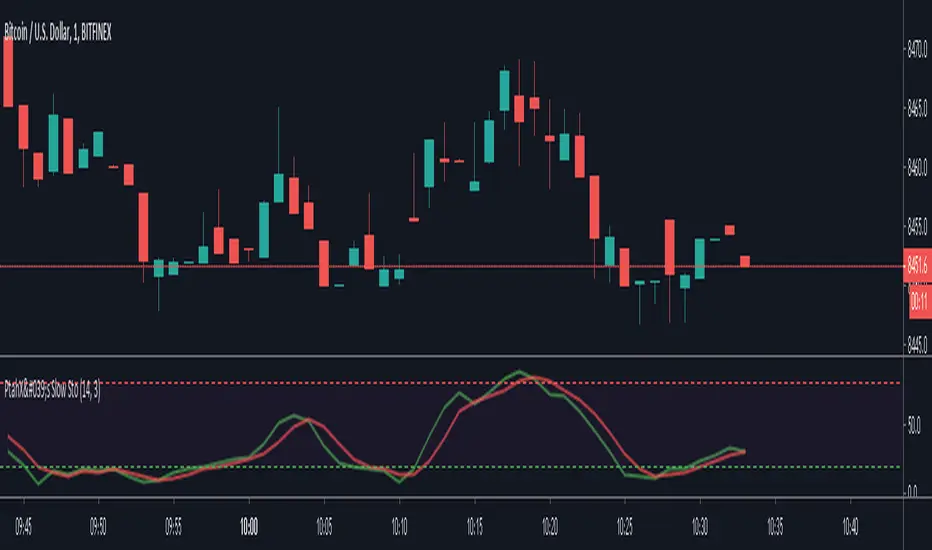
PtahX's Slow Stochastic with AlertsPtahX Slow Stochastic
converted to Pinescript Version 4
initial code thanks to Oshri17 !!
PtahX Version
converted to version 4
modified color scheme
Upper and lower band crossing alerts added (Entrance & Exit)
Modified Stochastic MACD Oscillator - Vitali ApirineFor all MACD enthusiasts out there, hot off the press, I present this next generation "Modified Stochastic MACD Oscillator" employing PSv4.0, originally formulated by Vitali Apirine for TASC - November 2019 Traders Tips. Just when you may have thought it was the end of the evolutionary line for MACD technology, it's not! Basically it's a NEW hybridization of a MACD and stochastic rolled into one, maintaining scale symmetry to support overbought/oversold defined levels across time frames and assets, unlike the ordinary MACD. On the ordinary MACD, this is virtually impossible to do properly, and trust me, I have tried with zero success. My less than 40 line implementation, at initial release, is a heavily modified version of the original indicator using novel techniques, surpassing not only Apirine's original intended design, but also the "contemporary MACD" provided by TV, visible on the bottom of the chart.
Utilizing the "Power of Pine", I included the maximum amount of features I could surmise in an ultra small yet powerful package. I provided an abundance of control over each feature as an attempt to create another heavenly MACD experience in an open source package, only rivaled by my "Ultimate MACD Super Pack". Configurations are displayed above in multiple scenarios that should be suitable for most traders. Of notable mention, I rescaled the oscillator more towards a zero mean unity scale, while still leaving the waveforms completely intact.
Features List Includes:
Dark Background - Easily disabled in indicator Settings->Style for "Light" charts or with Pine commenting
AND much, much more... you have the source!
For those of you who are new to Pine Script, this script also may help you understand advanced programming techniques in Pine and how they may be utilized in a most effective manner. I would like to see Tradingview become the go to platform for the best MACD indicators attainable with this contribution to the TV community. This is commonly what my dense intricate code looks like behind the veil, and if you are wondering why there is no notes, that's because the notation is in the variable naming. If you wish to contribute additional ideas, please do so below in the comments about all things MACD in Pine.
NOTICE: Copy pasting bandits who may be having nefarious thoughts, DO NOT attempt this, because this may violate Tradingview's terms, conditions and/or house rules. "WE" are always watching the TV community vigilantly for mischievous behaviors and actions that exploit well intended authors for the purpose of unscrupulously increasing brownie points in reputation scores. Hiding behind a "protected" wall may not protect you from investigation and account penalization by TV staff. Be respectful, and don't just throw a meaningless feature in there branding it as "your" gizmo. Fair enough? Alrighty then... I firmly believe in "innovating" future state-of-the-art indicators, and please contact me if you wish to do so.
The comments section below is solely just for commenting and other remarks, ideas, compliments, etc... regarding only this indicator, not others. When available time provides itself, I will consider your inquiries, thoughts, and concepts presented below in the comments section if you do have any questions or comments regarding this indicator. When my indicators achieve more prevalent use by TV members, I may implement more ideas when they present themselves as worthy additions. As always, "Like" it if you simply just like it with a proper thumbs up, and also return to my scripts list occasionally for additional postings. Have a profitable future everyone!

Triple Stochastic3 stochastic K-lines with short, medium & long periods & the D-lines removed.
Provides a good indication of where you are in the current supply/demand cycle & I find it helpful for timing entries.
Look for peaks & valleys formed by 2 or 3 lines, & entry would be when they start to turn around.
Try it on multiple timeframes & of course use confluence with other indicators & data.
TA-Money Flow-v2, Stochastic OBVNot sure where I originally got this (somewhere off Tradingview several years ago, thanks to the person who shared), just publishing because of a request.
This is basically a stochastic OBV movement indicator. It is good to work with both price and volume. I've updated to be able to display either as positive only, or both sides (50/-50), also included an invert function. It works great on any time frame, but you need to have volume data.
Enjoy.
I've got a version 3 if you're interested.

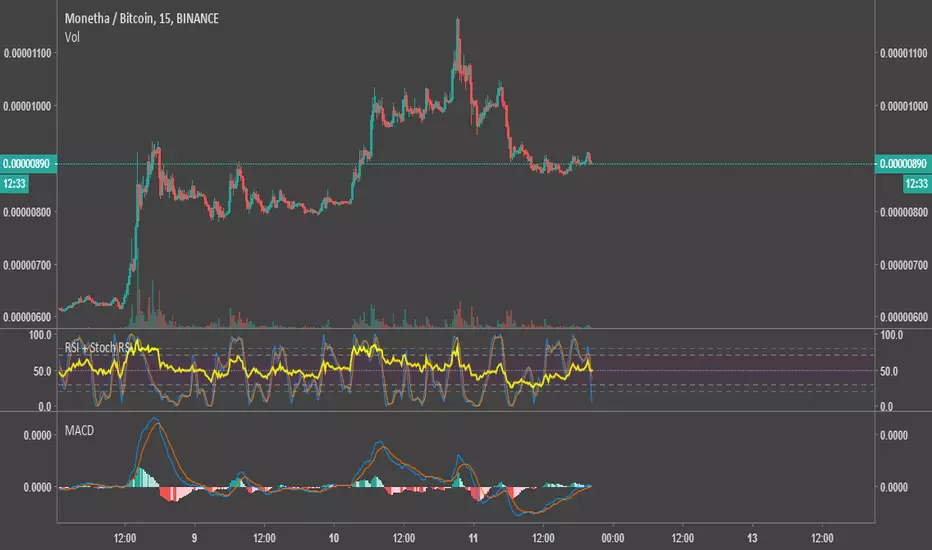
Relative Strength Index & Stochastic RSIThis script calculates both RSI (Relative Strength Index) and Stock (Stochastic) RSI Indicators, and plots them with a distinctive background on the same graph. The colors were chosen to be very easy on the eyes.
I published it as a way to give back to this community. Use your own judgement when trading, I am not responsible for any losses resulting from the use of my script.
Feel free to modify the script with no attribution.
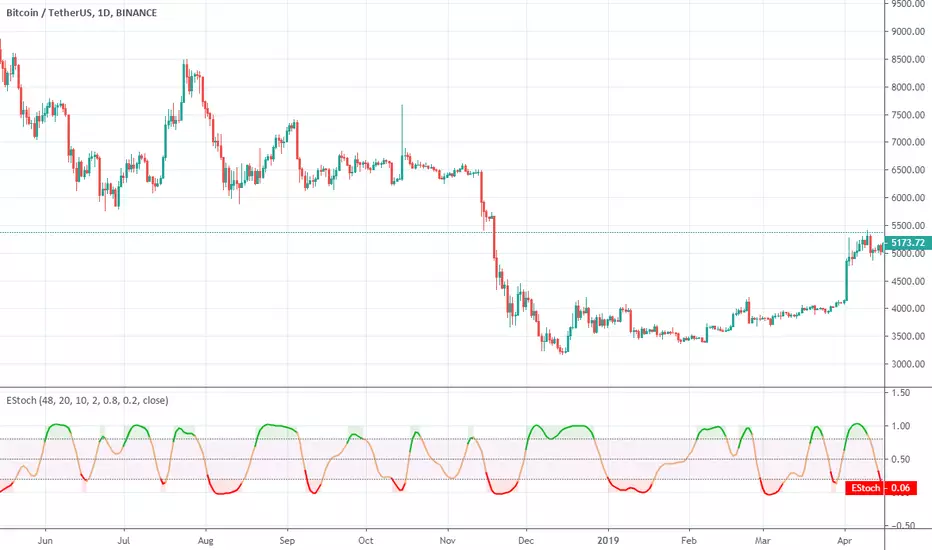
Ehlers StochasticEhlers Stochastic script.
This indicator was originally developed by John F. Ehlers (Stocks & Commodities V. 32:1: Predictive And Successful Indicators).
Ehlers Stochastic Cyber CycleEhlers Stochastic Cyber Cycle indicator script.
This indicator was originally developed by John F. Ehlers (see his book `Cybernetic Analysis for Stocks and Futures`, Chapter 8: `Stochasticization and Fisherization of Indicators`).
