G-Oscillator Strength v.1Hello this is my new indicator. Purpose of this indicator is to find the strength of the trend.
This indicator was developed by RSI(14) and Stochastic(50)
How to used
Red = RSI(14) & Sto(50) < 40
Lightblue = RSI(14) >= 50 and Sto(40) < 50
Darkblue = RSI(14) & Sto(40) >= 50
Green = Sto(40) >= 80
Yellow = RSI(14) < 50 and Sto(40) >= 50
Buy&Sell
Buy signal for this indicator is Lightblue to Darkblue
Sell signal is Green to Darkblue or Darkblue to Yellow
Recherche dans les scripts pour "stoch"

SAK-MPI: Stochastic & RSIDescription : This SwissArmyKnife - MultiPurposeIndicator allows user to modify the conventional indicator smoothing method Stochastic(SMA)/RSI(RMA) to one of filtering tools proposed by John F. Ehlers .
Details of each filtering type can be read in Ehlers Technical Papers: Swiss Army Knife Indicator,
I'm still very new with Digital Signal Processing (DSP) concept and this is my first attempt to help visualize one of Ehlers tools and its practicality (Read: Its experimental).
Any ideas to further improve this indicator are welcome :)
Disclaimer:
I always felt Pinescript is a very fast to type language with excellent visualization capabilities, so I've been using it as code-testing platform prior to actual coding in other platform.
Having said that, these study scripts was built only to test/visualize an idea to see its viability and if it can be used to optimize existing strategy.
While some of it are useful and most are useless, none of it should be use as main decision maker.

Ehler Stochastic Cyber Cycle Signals/AlertsThis script works based on @everget's version of Ehler Stochastic Cyber Cycle. Unlike @everget's work, my adaptation prints only crossovers into the chart that occur above or below the overbought/oversold zone.
You can find @everget's script with all related documentation here
I didn't change the calculation, I only reinvented how it is presented on the chart and added alerts.

Hybrid Overbought/Oversold Detector + Put/Call SignalsThere are many indicators of overbought/oversold conditions out there. Some of more common ones are:
- Bollinger Bands %B
- Money Flow Index (MFI)
- Relative Strength Index (RSI)
- Stochastic
This script uses a combination of these 4 oscillators to confirm overbought/oversold and filter the signals of market reverse which could be used for trading binary options.
You may select which oscillators you want to apply and of course change the source, the length of the calculations and the overbought/oversold levels.
Also the script will draw a combined graph which is the average of the selected oscillators in the options.
Send me your ideas!

[hxro] StochasticSimple Stochastic with HXRO index calculated internaly, you can select BTC , ETH, BNB or CHART for classic usage
The Upper & Lower band are also configurable

Divergence Stoch RSI[mado]Divergence screener for Stoch RSI
Regular Bullish: "D" navy label
Hidden Bullish: "H" navy label
Regular Bearish: "D" red label
Hidden Bearish: "H" red label

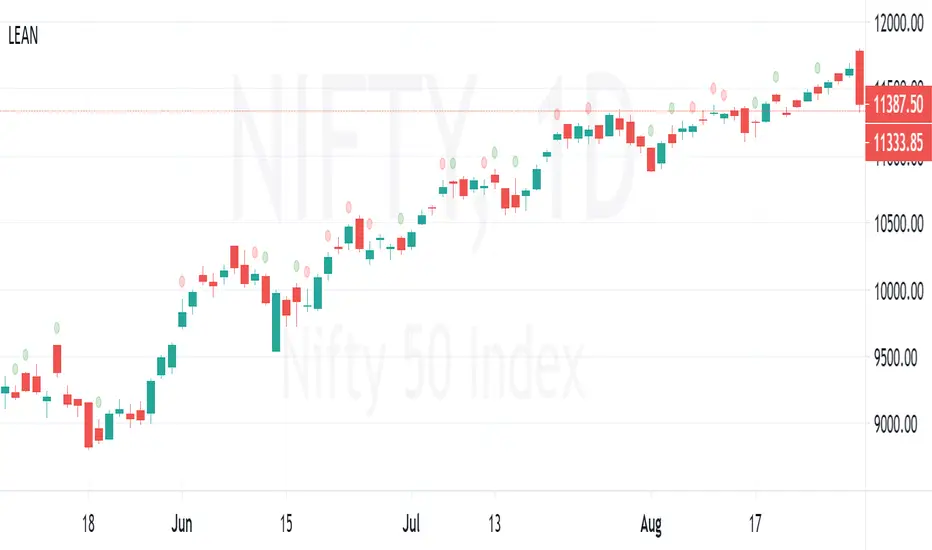
LEAN ChangeLEAN = Difference between %K and %D values of stochastic
Change in LEAN is plotted over the bar as a "Circle"
RED Circle => LEAN is decreased from previous value
GREEN Circle => LEAN is increased from previous value
Value of LEAN can be viewed at data window.
Indicator Panel MTF (MACD, RSI, Momentum, Stoch, CCI)This script shows the values of MACD, RSI, Momentum, Stoch, CCI for current and higher time frames in a panel. if higher time frame is equal or smaller than current time frame and it doesn't show the values for HTF.
And also it shows if their values are increasing, decreasing or equal to last value with "▲", "▼", "="
The signal length for all indicators is 9 and used EMA.
histogram value is indicator value - it's signal value. with this value you can see that indicator and its signal getting closer or not. you may think it's as momentum.
Some functions and idea is used from following scripts:
Thanks to Lucf for the following script:
Thanks to Ricardo Santos for the following script:

Schaff Trend Cycle [ChuckBanger]The Schaff Trend Cycle is a method, developed by Doug Schaff and based on the concept that trends also have repeating high and low patterns, or cycles. This is a modified MACD line, run through a modified stochastic algorithm and smoothed with Wilders’ smoothing in order to estimate the final Schaff Trend Cycle (STC) indicator. Its purpose is to identify the direction, in which a trend cycle is moving and possible peaks and bottoms within this cycle.
If this is interesting you should also take a look at MACD Leader:
For more info about Schaff Trend Cycle Indicator:
www.investopedia.com


Slow Stochastic Multi-K&D Average StudyStudy that takes to average fib MA in stochastic format.
Provides LONG and SHORT alerts
Long = k crossover d
Short = k crossunder d
set alerts for conservative entries
When creating alerts
Set to "Crossing Up"
Value = anything between 0 and 1
I usually set to 0.5
Set to "Once per Bar" to give you the fastest response

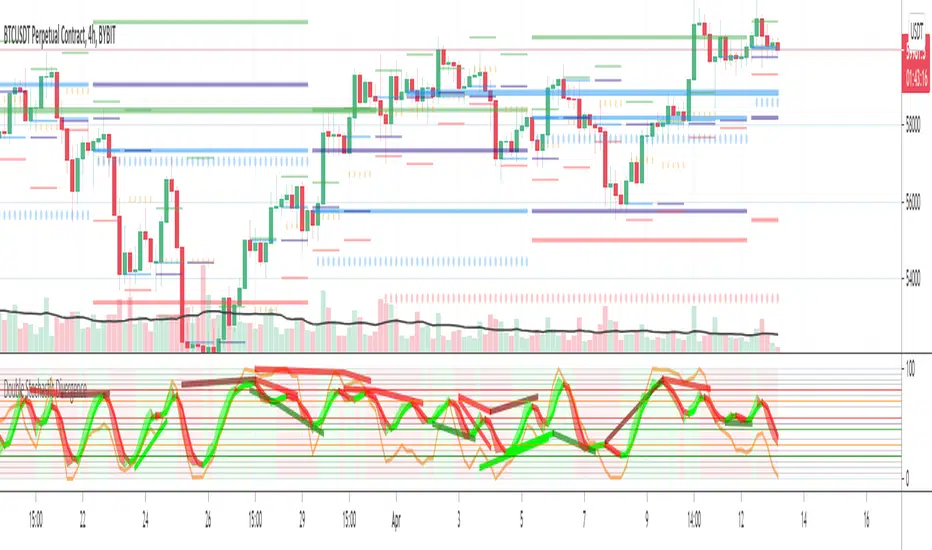
Double Stochastic DivergenceSame as my protected script but you can now see the code
This Study plots divergences and overlays a second %K as a fractal and changes the color of %D for the non fractal
Option to use Stochastic RSI for Fractal
Background Shading according to trend
Feel Free to change the indicator values to suit your style / system
The divergence script is thanks to @RicardoSantos, I've just adjusted it to suite my indicator
Remember that divergences work best when traded with the trend or very late in a trend when going against the trend
Common value for %K is 5, I have chosen 3 as it gives faster entries when using multiple time frames
If you are not using a momentum indicator as a trailing stop and using only cycle indicator
then I would recommended %K be 4 for exits


Inverse Fisher Transform on STOCHASTIC (modified graphics)Modified the graphic representation of the script from John Ehlers - From California, USA, he is a veteran trader. With 35 years trading experience he has seen it all. John has an engineering background that led to his technical approach to trading ignoring fundamental analysis (with one important exception). John strongly believes in cycles. He’d rather exit a trade when the cycle ends or a new one starts. He uses the MESA principle to make predictions about cycles in the market and trades one hundred percent automatically.
In the show John reveals:
• What is more appropriate than trading individual stocks
• The one thing he relies upon in his approach to the market
• The detail surrounding his unique trading style
• What important thing underpins the market and gives every trader an edge
About INVERSE FISHER TRANSFORM:
The purpose of technical indicators is to help with your timing decisions to buy or sell. Hopefully, the signals are clear and unequivocal. However, more often than not your decision to pull the trigger is accompanied by crossing your fingers. Even if you have placed only a few trades you know the drill. In this article I will show you a way to make your oscillator-type indicators make clear black-or-white indication of the time to buy or sell. I will do this by using the Inverse Fisher Transform to alter the Probability Distribution Function (PDF) of your indicators. In the past12 I have noted that the PDF of price and indicators do not have a Gaussian, or Normal, probability distribution. A Gaussian PDF is the familiar bell-shaped curve where the long “tails” mean that wide deviations from the mean occur with relatively low probability. The Fisher Transform can be applied to almost any normalized data set to make the resulting PDF nearly Gaussian, with the result that the turning points are sharply peaked and easy to identify. The Fisher Transform is defined by the equation
1)
Whereas the Fisher Transform is expansive, the Inverse Fisher Transform is compressive. The Inverse Fisher Transform is found by solving equation 1 for x in terms of y. The Inverse Fisher Transform is:
2)
The transfer response of the Inverse Fisher Transform is shown in Figure 1. If the input falls between –0.5 and +0.5, the output is nearly the same as the input. For larger absolute values (say, larger than 2), the output is compressed to be no larger than unity. The result of using the Inverse Fisher Transform is that the output has a very high probability of being either +1 or –1. This bipolar probability distribution makes the Inverse Fisher Transform ideal for generating an indicator that provides clear buy and sell signals.

VolumeS as stochThis volume indicator is my design. in this example we can use it as stoch but only this one based on pure volume .
since it a volume and not price based it allow us to see the real trend before the price go up or down. And by simple math of conversion volume number to real number . we can add this indicator to any indicator that we choose and we can enhance it affect.
this is just concept idea. as the real best setting for this need still to be found:)
if you want o make it faster or slower just change the smooth or length setting
so have fun

[Study] Pivots EMA Stoch SetupUsing daily pivot, if price is greater or under the four EMAs, and if we have a stoch signal, then we have an entry/exit condition.
Inverse Fisher Transform on SMI (Stochastic Momentum Index)Inverse Fisher Transform on SMI (Stochastic Momentum Index)
About John EHLERS:
From California, USA, John is a veteran trader. With 35 years trading experience he has seen it all. John has an engineering background that led to his technical approach to trading ignoring fundamental analysis (with one important exception).
John strongly believes in cycles. He’d rather exit a trade when the cycle ends or a new one starts. He uses the MESA principle to make predictions about cycles in the market and trades one hundred percent automatically.
In the show John reveals:
• What is more appropriate than trading individual stocks
• The one thing he relies upon in his approach to the market
• The detail surrounding his unique trading style
• What important thing underpins the market and gives every trader an edge
About INVERSE FISHER TRANSFORM:
The purpose of technical indicators is to help with your timing decisions to buy or
sell. Hopefully, the signals are clear and unequivocal. However, more often than
not your decision to pull the trigger is accompanied by crossing your fingers.
Even if you have placed only a few trades you know the drill.
In this article I will show you a way to make your oscillator-type indicators make
clear black-or-white indication of the time to buy or sell. I will do this by using the
Inverse Fisher Transform to alter the Probability Distribution Function (PDF) of
your indicators. In the past12 I have noted that the PDF of price and indicators do
not have a Gaussian, or Normal, probability distribution. A Gaussian PDF is the
familiar bell-shaped curve where the long “tails” mean that wide deviations from
the mean occur with relatively low probability. The Fisher Transform can be
applied to almost any normalized data set to make the resulting PDF nearly
Gaussian, with the result that the turning points are sharply peaked and easy to
identify. The Fisher Transform is defined by the equation
1)
Whereas the Fisher Transform is expansive, the Inverse Fisher Transform is
compressive. The Inverse Fisher Transform is found by solving equation 1 for x
in terms of y. The Inverse Fisher Transform is:
2)
The transfer response of the Inverse Fisher Transform is shown in Figure 1. If
the input falls between –0.5 and +0.5, the output is nearly the same as the input.
For larger absolute values (say, larger than 2), the output is compressed to be no
larger than unity. The result of using the Inverse Fisher Transform is that the
output has a very high probability of being either +1 or –1. This bipolar
probability distribution makes the Inverse Fisher Transform ideal for generating
an indicator that provides clear buy and sell signals.

MayerMultiple StochasticThis is an stochastic chart of Price adjusted Mayer Multiple Average Delta.
Moving Average Function can be selected from a list with standard functions and following experimental extras:
- Volume Weighted Exponential Moving Average
- Volume Weighted Time Decayed Moving Average // similar to vwema, but alpha is calculated from length as half-life decay function (not sure if I got that right...)
Default MA function is sma, to keep it true to the original MM indicator, but I think VWEMA and VWTDMA may perform better with exponential nature of Bitcoin .
See also:
Suggestions and bug reports are welcome =)
