Trend Trader Bands Strategy This is plots the indicator developed by Andrew Abraham
in the Trading the Trend article of TASC September 1998
It was modified, result values wass averages.
And draw two bands above and below TT line.
Recherche dans les scripts pour "trend"

Trend Trader Bands This is plots the indicator developed by Andrew Abraham
in the Trading the Trend article of TASC September 1998
It was modified, result values wass averages.
And draw two bands above and below TT line.

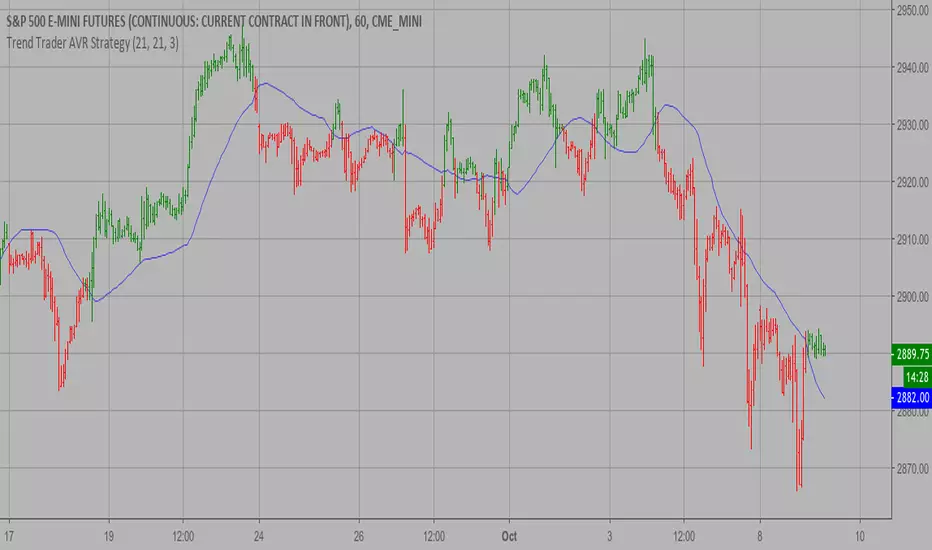
Trend Trader AVR Strategy This is plots the indicator developed by Andrew Abraham
in the Trading the Trend article of TASC September 1998
It was modified, result values wass averages.
Trend Trader AVR This is plots the indicator developed by Andrew Abraham
in the Trading the Trend article of TASC September 1998
It was modified, result values wass averages.

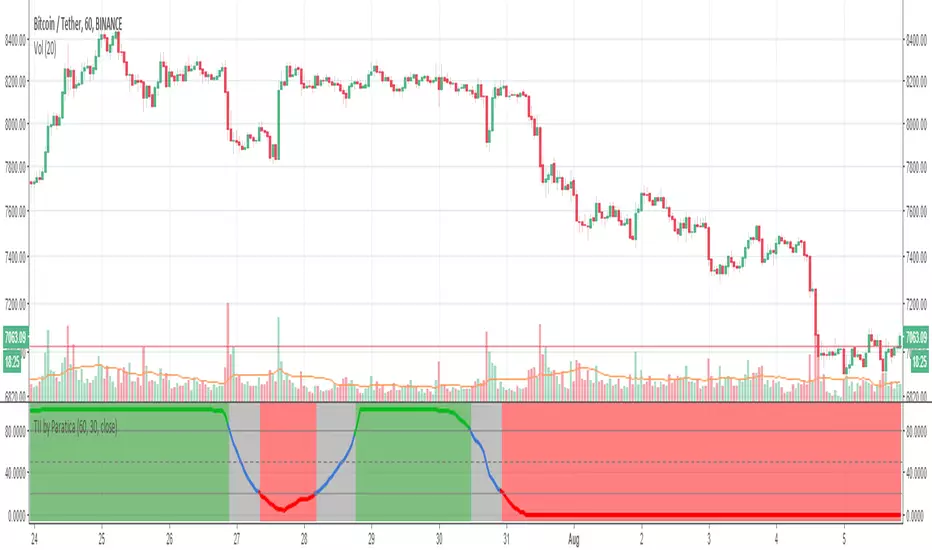
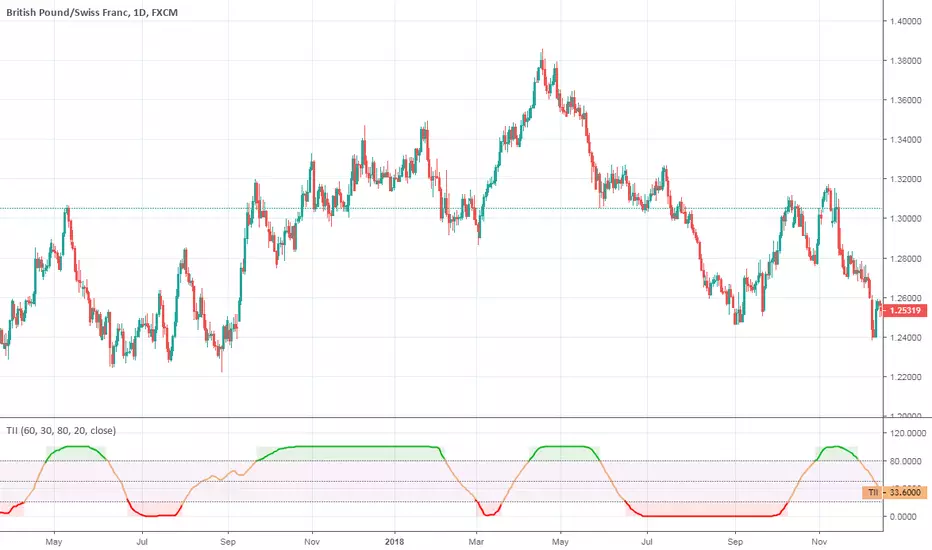
Trend Intensity Index by ParaticaTrend Intensity Index is very strong. It can see next coming trend very early
Trend Continuation FactorTrend Continuation Factor indicator script.
This indicator was originally developed by M.H. Pee (Stocks & Commodities V. 20:3 (58-64): Trend Continuation Factor).

Trend Trigger FactorTrend Trigger Factor indicator script. This indicator was originally developed by M. H. Pee (Stocks & Commodities V.22:12 (28-36): Trend Trigger Factor).

Trend Intensity IndexTrend Intensity Index indicator script. This indicator was originally developed by M. H. Pee (06/2002 issue of Stocks and Commodities Magazine)
Trend Intensity Index [DW]This study is a simple variation of M. H. Pee's Trend Intensity Index that includes two signal lines rather than one for additional trend confirmation.

Trend Volume Accumulation R1 by JustUncleLThis simple indicator shows the Accumulated Volume within the current uptrend or downtrend. The uptrend/downtrend is detected by a change in direction of the candles which works very well with Heikin Ashi and Renko charts. Alternatively you can use a Moving average direction to indicate trend direction, which should work on any candle type.
You can select between 11 different types of moving average:
SMA = Simple Moving Average.
EMA = Exponential Moving Average.
WMA = Weighted Moving Average
VWMA = Volume Weighted Moving Average
SMMA = Smoothed Simple Moving Average.
DEMA = Double Exponential Moving Average
TEMA = Triple Exponential Moving Average.
HullMA = Hull Moving Average
SSMA = Ehlers Super Smoother Moving average
ZEMA = Near Zero Lag Exponential Moving Average.
TMA = Triangular (smoothed) Simple Moving Average.
Here is a sample chart using EMA length 6 for trend Direction:

Trend, Stoch, Price Action or in short: TSPCombining the three most important factors that a trader usually needs in a single indicator.
Red = Trend
Blue = Stoch
Orange = Price Action

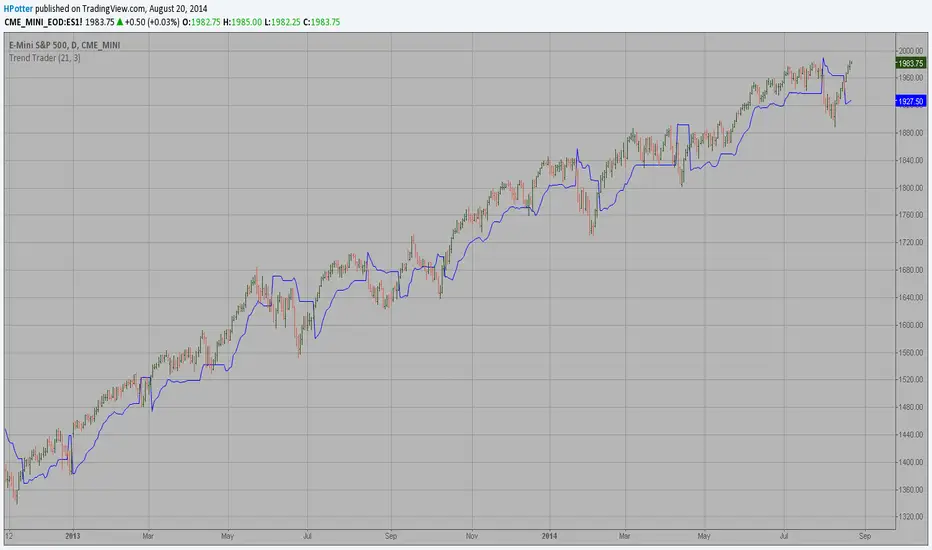
Trend Trader This is plots the indicator developed by Andrew Abraham
in the Trading the Trend article of TASC September 1998
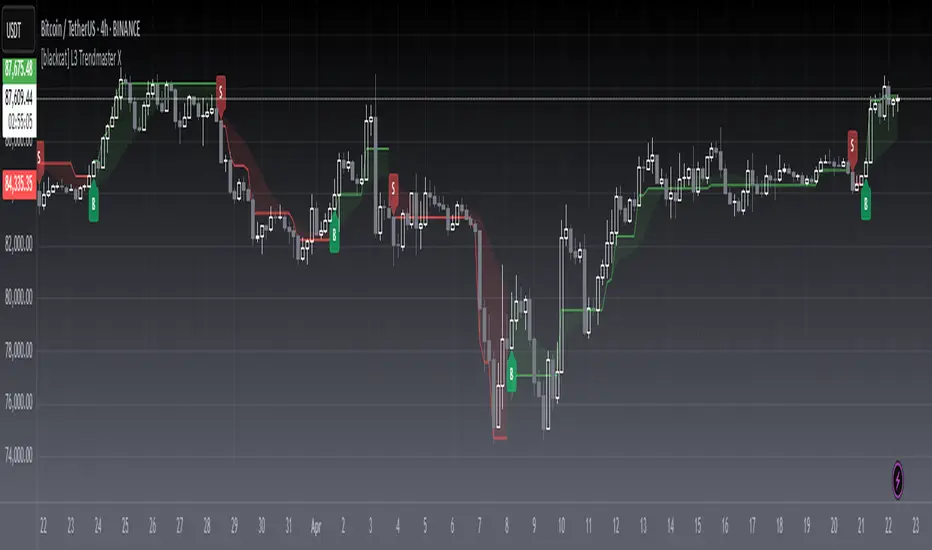
[blackcat] L3 Trendmaster XOVERVIEW
The L3 Trendmaster X is an advanced trend-following indicator meticulously crafted to assist traders in identifying and capitalizing on market trends. This sophisticated tool integrates multiple technical factors, including Average True Range (ATR), volume dynamics, and price spreads, to deliver precise buy and sell signals. By plotting dynamic trend bands directly onto the chart, it offers a comprehensive visualization of potential trend directions, enabling traders to make informed decisions swiftly and confidently 📊↗️.
FEATURES
Customizable Input Parameters: Tailor the indicator to match your specific trading needs with adjustable settings:
Trendmaster X Multiplier: Controls the sensitivity of the ATR-based levels.
Trendmaster X Period: Defines the period over which the ATR is calculated.
Window Length: Specifies the length of the moving window for standard deviation calculations.
Volume Averaging Length: Determines how many periods are considered for averaging volume.
Volatility Factor: Adjusts the impact of volatility on the trend bands.
Core Technical Metrics:
Dynamic Range: Measures the range between high and low prices within each bar.
Candle Body Size: Evaluates the difference between open and close prices.
Volume Average: Assesses the cumulative On-Balance Volume relative to the dynamic range.
Price Spread: Computes the standard deviation of the price ranges over a specified window.
Volatility Factor: Incorporates volatility into the calculation of trend bands.
Advanced Trend Bands Calculation:
Upper Level: Represents potential resistance levels derived from the ATR multiplier.
Lower Level: Indicates possible support levels using the same ATR multiplier.
High Band and Low Band: Dynamically adjust to reflect current trend directions, offering a clear view of market sentiment.
Visual Representation:
Plots distinct green and red trend lines representing bullish and bearish trends respectively.
Fills the area between these trend lines and the middle line for enhanced visibility.
Displays clear buy ('B') and sell ('S') labels on the chart for immediate recognition of trading opportunities 🏷️.
Alert System:
Generates real-time alerts when buy or sell conditions are triggered, ensuring timely action.
Allows customization of alert messages and frequencies to align with individual trading strategies 🔔.
HOW TO USE
Adding the Indicator:
Open your TradingView platform and navigate to the "Indicators" section.
Search for " L3 Trendmaster X" and add it to your chart.
Adjusting Settings:
Fine-tune the input parameters according to your preferences and trading style.
For example, increase the Trendmaster X Multiplier for higher sensitivity during volatile markets.
Decrease the Window Length for shorter-term trend analysis.
Monitoring Trends:
Observe the plotted trend bands and labels on the chart.
Look for buy ('B') labels at potential support levels and sell ('S') labels at resistance levels.
Setting Up Alerts:
Configure alerts based on the generated buy and sell signals.
Choose notification methods (e.g., email, SMS) and set alert frequencies to stay updated without constant monitoring 📲.
Combining with Other Tools:
Integrate the Trendmaster X with other technical indicators like Moving Averages or RSI for confirmation.
Utilize fundamental analysis alongside the indicator for a holistic approach to trading.
Backtesting and Optimization:
Conduct thorough backtests on historical data to evaluate performance.
Optimize parameters based on backtest results to enhance accuracy and reliability.
Real-Time Application:
Apply the optimized settings to live charts and monitor real-time signals.
Execute trades based on confirmed signals while considering risk management principles.
LIMITATIONS
Market Conditions: The indicator might produce false signals in highly volatile or sideways-trending markets due to increased noise and lack of clear direction 🌪️.
Complementary Analysis: Traders should use this indicator in conjunction with other analytical tools to validate signals and reduce the likelihood of false positives.
Asset-Specific Performance: Effectiveness can vary across different assets and timeframes; therefore, testing on diverse instruments is recommended.
NOTES
Data Requirements: Ensure adequate historical data availability for accurate calculations and reliable signal generation.
Demo Testing: Thoroughly test the indicator on demo accounts before deploying it in live trading environments to understand its behavior under various market scenarios.
Parameter Customization: Regularly review and adjust parameters based on evolving market conditions and personal trading objectives.
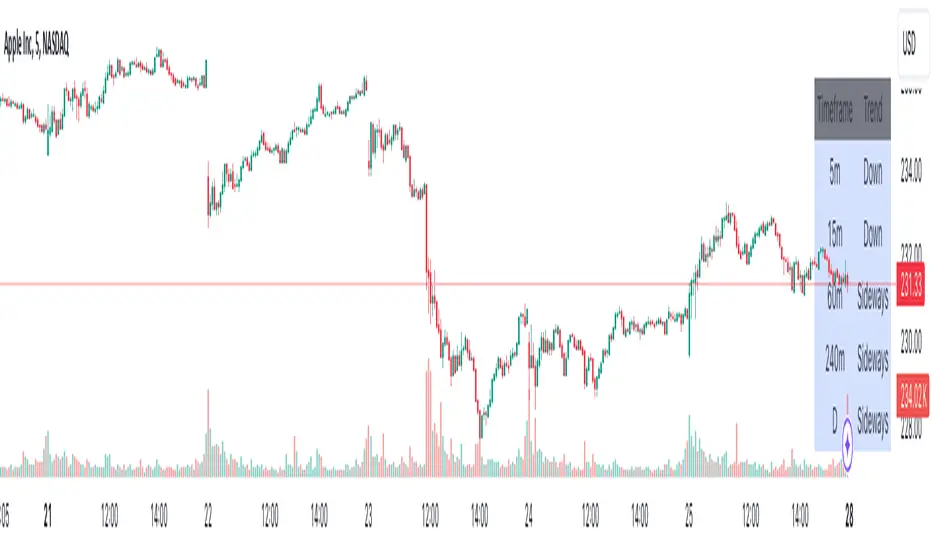
Advanced Multi-Timeframe Trend DetectorThis script is designed to provide a multi-timeframe trend analysis, combining moving averages (MAs) and the Relative Strength Index (RSI) to determine market direction across different timeframes. Here's a breakdown of what the script does:
Key Components of the Script
Inputs:
Moving Averages: Short and long moving average lengths (9 and 21 periods).
ATR and RSI Lengths: ATR (Average True Range) and RSI (Relative Strength Index) lengths set to 14 periods.
RSI Levels: Overbought and oversold levels for the RSI set to 70 and 30, respectively.
Trend Determination:
A function called trendDirection evaluates the trend based on the closing prices of the current and previous periods, as well as the RSI value.
It classifies the trend as "Up", "Down", or "Sideways" based on the conditions:
Up: Current close is higher than the previous close and RSI is below the overbought level.
Down: Current close is lower than the previous close and RSI is above the oversold level.
Sideways: If neither condition is met.
Table Creation:
A table is created at the bottom right of the chart to display the trend for different timeframes (5m, 15m, 60m, 240m, and Daily).
The table is initialized with headers and then populated with the trend results for each timeframe.
Calculating Trends for Each Timeframe:
The script fetches the current and previous close prices for each timeframe using request.security().
It calculates the RSI for each timeframe and then calls the trendDirection function to determine the trend.
Displaying Trends:
The results are displayed in a table format, with each timeframe and its corresponding trend.
Summary
Overall, this script provides a concise way to visualize market trends across multiple timeframes, using MAs and RSI to offer a more nuanced view of potential market movements. This can help traders make more informed decisions based on the prevailing trends.
Momentum Trend Bands (MTB)📌 What Is the Momentum Trend Bands (MTB) Indicator?
The Momentum Trend Bands (MTB) is a custom-built trend detection indicator that blends momentum and volatility into a dynamic, visual system. Its core goal is to help traders identify the beginning and strength of a trend earlier than traditional tools like moving averages, while filtering out market noise.
🧠 What Is It Built On?
The indicator is built on two foundational concepts:
1. Rate of Change (ROC): This measures the speed at which the price is moving. We use a fast and a slow version of ROC and then calculate their difference. This difference gives us a momentum signal — it shows whether the price is gaining upward or downward strength.
2. Standard Deviation (Volatility): This shows how much the price fluctuates. By calculating it over a certain period, we can measure market noise and filter out weak, insignificant moves that might otherwise cause false signals.
Together, momentum shows direction, and volatility shows confidence.
🛠️ How Does It Work?
• The core of the indicator is a smoothed momentum signal, representing the net difference between fast and slow momentum.
• Around this signal, we build upper and lower bands — these are dynamic boundaries that expand or contract based on volatility.
• When the momentum breaks above or below these bands, it signals a strong directional move — suggesting the start or continuation of a trend.
The bands also serve a visual filter:
• If momentum stays within the bands, it implies the market is consolidating or ranging.
• When it exits the bands decisively, it implies strength in that direction.
📈 How to Use It?
1. Trend Entry:
o When the momentum signal rises above the upper band, it suggests a strong bullish trend may be starting.
o When the signal drops below the lower band, it indicates a bearish trend.
2. Stay Out of Chop:
o If the signal moves sideways within the bands, it’s best to avoid trading — the market is likely consolidating or ranging.
3. Visual Confirmation:
o The background color changes with the trend: green for bullish, red for bearish, gray for neutral. This makes it quick to read visually.
4. Signal Arrows:
o Small up or down arrows appear when trends begin, serving as early entry points.
⚙️ What Kind of Market Does It Work Best In?
• Trending Markets: MTB shines in markets with strong directional movement — whether up or down. It's designed to pick up momentum early and hold through trend continuation.
• Volatile Instruments: The built-in volatility filter helps in markets like crypto or commodities where price action is fast and erratic.
• Avoid Flat or Low-Volume Conditions: In sideways markets, MTB may stay gray or flip often — these are not ideal times to trade using this indicator alone.
💎 Why Is It Unique?
Unlike many indicators that react slowly (like moving averages) or trigger too often (like raw momentum), MTB balances early detection with reliability. Its unique combination of:
• ROC difference for directional intent,
• Smoothing for signal clarity,
• Bands scaled by volatility for robustness,
…makes it stand apart from commonly available indicators on platforms like TradingView.

Market Structure - HH, HL, LH, LL with Trendlines & AlertsMarket Structure Script – HH, HL, LH, LL with Trendlines & Alerts
This Pine Script is designed to help identify key market structure patterns such as Higher Highs (HH), Higher Lows (HL), Lower Highs (LH), and Lower Lows (LL) on price charts. It also draws trendlines connecting the respective swing points and provides alerts when these important price patterns occur.
Key Features:
Swing High and Low Detection:
The script uses the ta.pivothigh and ta.pivotlow functions to identify significant swing highs and swing lows based on the pivot length (pivotLen). These points mark local peaks and troughs in the price action.
Dynamic Pivot Length:
The script adjusts the pivotLen (which defines the number of bars used to calculate swing points) based on the current timeframe of the chart. For example, for a 15-minute chart, it uses a pivot length of 5 bars, while for a daily chart, it uses 10 bars. This dynamic adjustment ensures that the script works across different timeframes.
Higher Highs (HH), Higher Lows (HL), Lower Highs (LH), Lower Lows (LL):
Higher High (HH): Identifies a price peak that is higher than the previous swing high, indicating an uptrend.
Higher Low (HL): Identifies a price trough that is higher than the previous swing low, supporting the idea of an ongoing uptrend.
Lower High (LH): Identifies a price peak that is lower than the previous swing high, suggesting a potential reversal or downtrend.
Lower Low (LL): Identifies a price trough that is lower than the previous swing low, indicating a downtrend.
Trendlines:
For each identified Higher High, Higher Low, Lower High, or Lower Low, the script automatically draws a trendline connecting the corresponding swing points. These trendlines provide a visual representation of the market’s price structure, showing support and resistance levels.
Labels:
The script places labels on the chart next to the respective swing points. These labels mark whether the point is a Higher High (HH), Higher Low (HL), Lower High (LH), or Lower Low (LL). This helps traders easily visualize the price pattern at a glance.
Alerts:
Alert conditions are set for when a Higher High (HH), Higher Low (HL), Lower High (LH), or Lower Low (LL) is detected. Users can set up alerts to be notified whenever one of these key market structure patterns forms. Alerts are an essential feature for traders who want to act quickly when important trend changes are happening.
EMA 50 + 200 Trend Signal TableEMA 50 + 200 Trend Signal Table (ETT)
This indicator provides a multi-timeframe trend signal table based on the 50-period and 200-period Exponential Moving Averages (EMAs). It visually plots the EMA 50 and EMA 200 on the chart, along with a customizable, compact table that indicates the trend direction across multiple timeframes. This tool is useful for traders looking to quickly identify market trends and momentum on various timeframes.
How It Works
- EMA Trend Analysis: The script compares the EMA 50 and EMA 200 values to determine the trend. When EMA 50 is above EMA 200, the trend is considered Bullish; if EMA 50 is below EMA 200, the trend is Bearish. If EMA 200 data is unavailable (e.g., on very short timeframes), the trend status will display as Neutral.
- Multi-Timeframe Trend Signals: The table displays the trend signals across five user-defined timeframes, updating in real time. Each timeframe row shows either Bullish, Bearish, or Neutral, with colors customizable to your preference.
Features
- EMA 50 and EMA 200 Visualization: Plots EMA 50 and EMA 200 lines directly on the chart. Users can customize the color and line thickness for each EMA to fit their charting style.
- Trend Signal Table: A table positioned on the chart (with options for positioning in the corners) shows the trend direction for the selected timeframes.
Bullish Trend: Highlighted in green (default) with 50% opacity.
Bearish Trend: Highlighted in red (default) with 50% opacity.
Neutral Trend: Highlighted in gray (default) with 50% opacity.
- Customizable Table Appearance: Allows users to select the position of the table (top-right, top-left, bottom-right, or bottom-left) and choose between compact sizes (Extra Small, Small, Normal).
- Adjustable Colors: Users can specify custom colors for each trend status (Bullish, Bearish, Neutral) as well as for the text and table border colors.
Inputs and Customizations
- Timeframes: Choose up to five different timeframes for trend analysis.
- EMA Colors and Line Widths: Customize the color and line width of EMA 50 and EMA 200 plotted on the chart.
- Table Settings: Control the position, size, and color options of the trend signal table for improved visibility and integration with your chart layout.
Use Case This indicator is ideal for traders who employ a multi-timeframe approach to confirm trends and filter entries. By monitoring the relative positions of EMA 50 and EMA 200 across various timeframes, traders can get a quick snapshot of trend strength and direction, aiding in informed trading decisions.

TP RSITP RSI - Integrated Trend, Momentum, and Volatility Analyzer
The TP RSI indicator is an innovative 3-in-1 technical analysis tool that combines RSI, Bollinger Bands, and an EMA ribbon to provide traders with a comprehensive view of trend, momentum, and volatility in a single, easy-to-interpret visual display.
Why This Combination? This mashup addresses three critical aspects of market analysis simultaneously:
Trend identification and strength (EMA ribbon)
Momentum measurement (RSI)
Volatility assessment (Bollinger Bands)
By integrating these components, traders can make more informed decisions based on multiple factors without switching between different indicators.
How Components Work Together:
1. EMA Ribbon (Trend):
10 EMAs form 5 color-coded bands
Blue: Uptrend, Red: Downtrend
Provides a nuanced view of trend strength and potential reversals
2. RSI (Momentum):
Color-coded for quick interpretation
Blue: Upward momentum, Red: Downward momentum, White: Neutral
Position relative to the ribbon offers additional insight
3. Bollinger Bands (Volatility):
Applied to RSI for dynamic overbought/oversold levels
Narrow bands indicate low volatility, suggesting potential breakouts
Unique Aspects and Originality:
Synergistic visual cues: Color coordination between ribbon and RSI
Multi-factor confirmation: Requires alignment of trend, momentum, and volatility for strong signals
Volatility-adjusted momentum: RSI interpreted within the context of Bollinger Bands
How these components work together:
Buy Signal: Blue ribbon with blue RSI outside the ribbon.
Sell Signal: Red ribbon with red RSI outside the ribbon.
Neutral: White RSI or RSI inside the ribbon (not recommended for trading)
Increasing Momentum: RSI crossing above upper Bollinger Band (upward) or below lower Band (downward).
Trend Strength: RSI rejection by the ribbon, while all bands are colored along with the trend direction, identifies a strong trend.

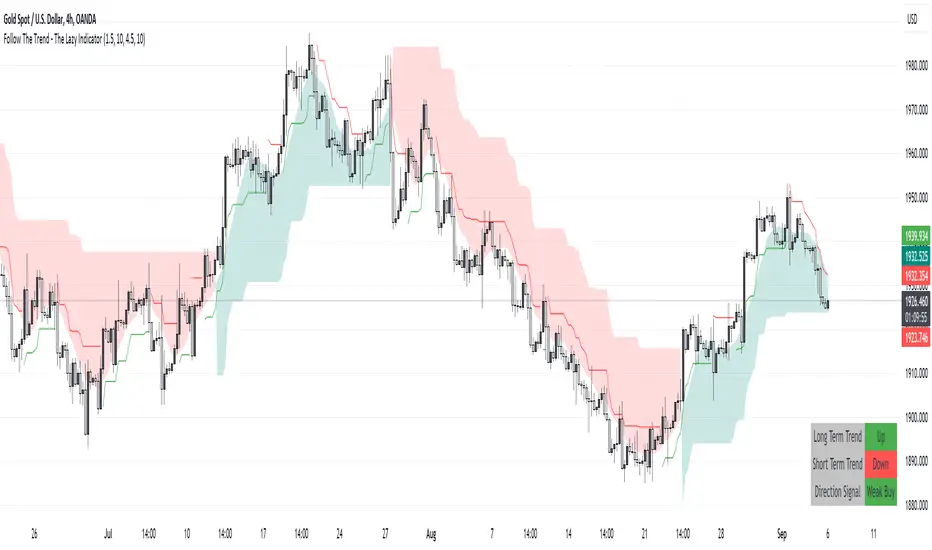
Follow The Trend - The Lazy Indicator**Understanding the 'Follow The Trend - The Lazy Indicator'**
This indicator is designed to help traders visualize the trend direction over both short-term and long-term periods. Let's dive deeper into understanding how it's designed and how it can be beneficial.
**1. How It's Designed:**
* **User Inputs:**
The first few lines ask the user for specific inputs related to the Average True Range (ATR) length and values for both short-term and long-term trends. ATR is a volatility indicator and, in this context, is used as part of the SuperTrend calculation.
* **SuperTrend Calculations:**
This indicator uses the SuperTrend, a popular trend-following indicator. Here, two SuperTrends are being calculated – one for short-term trends and another for long-term trends. The direction of the SuperTrend is also determined, signaling whether the trend is upwards or downwards.
* **Visual Representations:**
* The short-term SuperTrend is represented using green lines (for uptrend) and red lines (for downtrend).
* The indicator also provides a "cloud" between a Simple Moving Average (SMA) of the closing price (over the past 10 periods) and the long-term SuperTrend. This cloud changes color based on the direction of the long-term trend, providing another visual cue about market direction.
* **Signal Evaluation:**
This part of the code interprets the combination of short-term and long-term trends and assigns trading signals like "Strong Buy," "Weak Buy," "Strong Sell," "Weak Sell," and so on. This can act as a guide for traders, suggesting potential trading actions based on the prevailing trends.
* **Signal Coloration:**
The indicator also assigns colors to each signal. For instance, "Strong Buy" is green, "Strong Sell" is red, and there are transparency adjustments for weak signals to differentiate them from strong ones.
* **Tabular Presentation:**
At the end of the script, there’s a table displayed on the chart, summarizing the direction of both the long-term and short-term trends, as well as the overall trading signal. It provides a quick snapshot for traders to understand the current market scenario.
**2. How It May Be Helpful:**
* **Simplicity:**
The "Follow The Trend" indicator, despite its underlying complexity, is presented in a very user-friendly way. By just looking at the color cues and the table, traders can quickly understand the market's trend and potential direction.
* **Dual Trend Analysis:**
By analyzing both short-term and long-term trends, traders get a comprehensive view. This helps in understanding if the market is just having a short-term retracement (temporary reverse in direction) or if there's a genuine change in the long-term trend.
* **Adaptability:**
Traders can adjust the ATR values and lengths to customize the sensitivity of the indicator. This means it can be adapted to different assets or varying market conditions.
* **Actionable Signals:**
The signals like "Strong Buy" or "Weak Sell" are direct suggestions that can help in decision-making. Especially for beginners or those who might be overwhelmed by complex charts, such signals can be very beneficial.
* **Visual Appeal:**
The combination of trend lines, cloud coloring, and tabulated information provides a visually pleasing and easy-to-understand representation of market data. This can help reduce analysis fatigue and make chart reading more enjoyable.
In conclusion, the "Follow The Trend - The Lazy Indicator" is designed to make trend-following more accessible and actionable. By providing clear visual cues and combining short-term and long-term trend analysis, it offers traders a tool that's both comprehensive and user-friendly. Whether you're a beginner looking for clear signals or an experienced trader wanting an overview of the market trend, this indicator might be a useful addition to your toolkit.
Chatterjee CorrelationThis is my first attempt on implementing a statistical method. This problem was given to me by @lejmer (who also helped me later on building more efficient code to achieve this) when we were debating on the need for higher resource allocation to run scripts so it can run longer and faster. The major problem faced by those who want to implement statistics based methods is that they run out of processing time or need to limit the data samples. My point was that such things need be implemented with an algorithm which suits pine instead of trying to port a python code directly. And yes, I am able to demonstrate that by using this implementation of Chatterjee Correlation.
🎲 What is Chatterjee Correlation?
The Chatterjee rank Correlation Coefficient (CCC) is a method developed by Sourav Chatterjee which can be used to study non linear correlation between two series.
Full documentation on the method can be found here:
arxiv.org
In short, the formula which we are implementing here is:
Algorithm can be simplified as follows:
1. Get the ranks of X
2. Get the ranks of Y
3. Sort ranks of Y in the order of X (Lets call this SortedYIndices)
4. Calculate the sum of adjacent Y ranks in SortedYIndices (Lets call it as SumOfAdjacentSortedIndices)
5. And finally the correlation coefficient can be calculated by using simple formula
CCC = 1 - (3*SumOfAdjacentSortedIndices)/(n^2 - 1)
🎲 Looks simple? What is the catch?
Mistake many people do here is that they think in Python/Java/C etc while coding in Pine. This makes code less efficient if it involves arrays and loops. And the simple code may look something like this.
var xArray = array.new()
var yArray = array.new()
array.push(xArray, x)
array.push(yArray, y)
sortX = array.sort_indices(xArray)
sortY = array.sort_indices(yArray)
SumOfAdjacentSortedIndices = 0.0
index = array.get(xSortIndices, 0)
for i=1 to n > 1? n -1 : na
indexNext = array.get(sortX, i)
SumOfAdjacentSortedIndices += math.abs(array.get(sortY, indexNext)-array.get(sortY, index))
index := indexNext
correlation := 1 - 3*SumOfAdjacentSortedIndices/(math.pow(n,2)-1)
But, problem here is the number of loops run. Remember pine executes the code on every bar. There are loops run in array.sort_indices and another loop we are running to calculate SumOfAdjacentSortedIndices. Due to this, chances of program throwing runtime errors due to script running for too long are pretty high. This limits greatly the number of samples against which we can run the study. The options to overcome are
Limit the sample size and calculate only between certain bars - this is not ideal as smaller sets are more likely to yield false or inconsistent results.
Start thinking in pine instead of python and code in such a way that it is optimised for pine. - This is exactly what we have done in the published code.
🎲 How to think in Pine?
In order to think in pine, you should try to eliminate the loops as much as possible. Specially on the data which is continuously growing.
My first thought was that sorting takes lots of time and need to find a better way to sort series - specially when it is a growing data set. Hence, I came up with this library which implements Binary Insertion Sort.
Replacing array.sort_indices with binary insertion sort will greatly reduce the number of loops run on each bar. In binary insertion sort, the array will remain sorted and any item we add, it will keep adding it in the existing sort order so that there is no need to run separate sort. This allows us to work with bigger data sets and can utilise full 20,000 bars for calculation instead of few 100s.
However, last loop where we calculate SumOfAdjacentSortedIndices is not replaceable easily. Hence, we only limit these iterations to certain bars (Even though we use complete sample size). Plots are made for only those bars where the results need to be printed.
🎲 Implementation
Current implementation is limited to few combinations of x and fixed y. But, will be converting this into library soon - which means, programmers can plug any x and y and get the correlation.
Our X here can be
Average volume
ATR
And our Y is distance of price from moving average - which identifies trend.
Thus, the indicator here helps to understand the correlation coefficient between volume and trend OR volatility and trend for given ticker and timeframe. Value closer to 1 means highly correlated and value closer to 0 means least correlated. Please note that this method will not tell how these values are correlated. That is, we will not be able to know if higher volume leads to higher trend or lower trend. But, we can say whether volume impacts trend or not.
Please note that values can differ by great extent for different timeframes. For example, if you look at 1D timeframe, you may get higher value of correlation coefficient whereas lower value for 1m timeframe. This means, volume to trend correlation is higher in 1D timeframe and lower in lower timeframes.

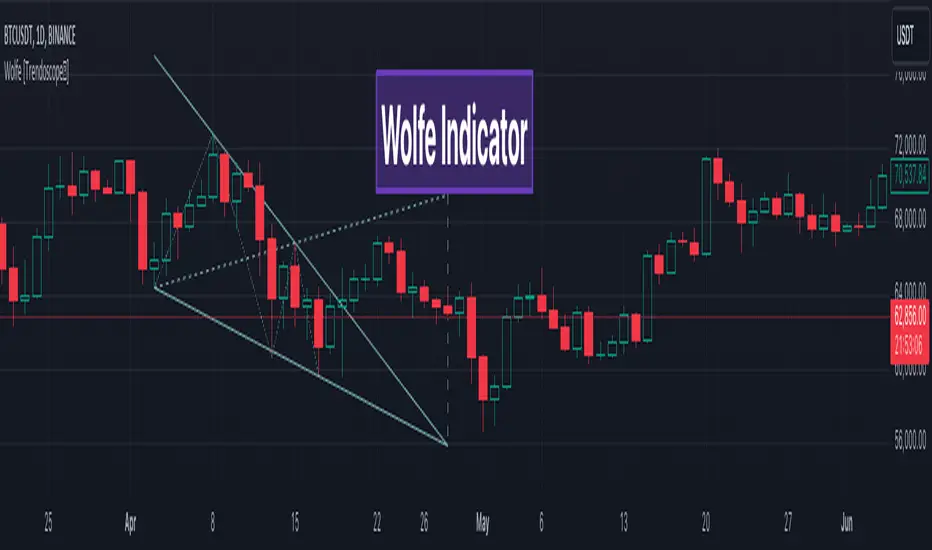
Wolfe Scanner (Multi - zigzag) [HeWhoMustNotBeNamed]Before getting into the script, I would like to explain bit of history around this project. Wolfe was in the back of my mind for some time and I had several attempts so far.
🎯Initial Attempt
When I first developed harmonic patterns, I got many requests from users to develop script to automatically detect Wolfe formation. I thought it would be easy and started boasting everywhere that I am going to attempt this next. However I miserably failed that time and started realising it is not as simple as I thought it would be. I started with Wolfe in mind. But, ran into issues with loops. Soon figured out that finding and drawing wedge is more trickier. I decided will explore trendline first so that it can help find wedge better. Soon, the project turned into something else and resulted in Auto-TrendLines-HeWhoMustNotBeNamed and Wolfe left forgotten.
🎯Using predefined ratios
Wolfe also has predefined fib ratios which we can use to calculate the formation. But, upon initial development, it did not convince me that it matches visual inspection of Wolfe all the time. Hence, I decided to fall back on finding wedge first.
🎯 Further exploration in finding wedge
This attempt was not too bad. I did not try to jump into Wolfe and nor I bragged anywhere about attempting anything of this sort. My target this time was to find how to derive wedge. I knew then that if I manage to calculate wedge in efficient way, it can help further in finding Wolfe. While doing that, ended up deriving Wedge-and-Flag-Finder-Multi-zigzag - which is not a bad outcome. I got few reminders on Wolfe after this both in comments and in PM.
🎯You never fail until you stop trying!!
After 2 back to back hectic 50hr work weeks + other commitments, I thought I will spend some time on this. Took less than half weekend and here we are. I was surprised how much little time it took in this attempt. But, the plan was running in my subconscious for several weeks or even months. Last two days were just putting these plans into an action.
Now, let's discuss about the script.
🎲 Wolfe Concept
Wolfe concept is simple. Whenever a wedge is formed, draw a line joining pivot 1 and 4 as shown in the chart below:
Converging trendline forms the stop loss whereas line joining pivots 1 and 4 form the profit taking points.
🎲 Settings
Settings are pretty straightforward. Explained in the chart below.
Renko Trend Indicator with High/LowRenko Trend Indicator with High/Low
Version: 1.0
Pine Script Version: 5
Type: Indicator
Overlay: Yes
Description
The Renko Trend Indicator with High/Low provides a visual representation of market trends using Renko-style calculations based on either a fixed brick size or ATR (Average True Range). It helps traders identify trend direction, potential reversals, and key support/resistance levels.
The indicator plots Renko-based trend signals directly on your chart and provides a colored Renko close line, making trend analysis simpler and clearer.
Features
Customizable Renko Brick Size
Fixed brick size or dynamic ATR-based bricks.
Step input for precise control over brick size.
Trend Identification
Detects uptrend and downtrend based on Renko logic.
Plots visual signals for trend direction:
Green triangle below bars → Uptrend
Red triangle above bars → Downtrend
Renko Close Line
Shows the Renko-adjusted closing price as a line.
Line color changes with trend (green for uptrend, red for downtrend).
Inputs
Name Type Default Description
Brick Size float 50 Size of Renko bricks (price units)
Use ATR for Brick Size? bool false Enable ATR-based dynamic brick sizing
ATR Period int 14 Number of periods for ATR calculation if enabled
How It Works
The indicator calculates Renko bricks using either a fixed size or ATR.
It maintains internal variables:
renko_close → Current Renko price
renko_high → Highest point of the current trend
renko_low → Lowest point of the current trend
trend → Current trend direction (1 for uptrend, -1 for downtrend)
last_extreme → Last extreme point to detect trend reversal
When price moves above or below the Renko threshold, the trend is updated.
Trend signals are plotted on the chart for easy visualization.
Plots
Plot Name Description Color
Up Trend Triangle below bar when trend is up Green
Down Trend Triangle above bar when trend is down Red
Renko Close Line connecting Renko-adjusted close prices Green (up) / Red (down)
Usage
Add the indicator to any chart with your preferred timeframe.
Configure the brick size or enable ATR-based bricks for dynamic calculation.
Observe the trend triangles and Renko line to identify trend direction and potential reversals.
Can be used in combination with other indicators or strategies for trading decisions.
Notes
This indicator is for analysis purposes only and does not place trades automatically.
ATR-based bricks adapt to market volatility, while fixed bricks provide a static reference.
Works best on liquid markets with regular price movements.
Example Chart
Green triangles below bars signal a buying trend.
Red triangles above bars signal a selling trend.
The colored Renko line shows the trend progression visually.
Author
DB
Pine Script Version: 5
License: MIT

Range Trends Enhanced (eleven11)This indicator automatically draws your Range Trend lines based upon your timeframe. When you select a timeframe, in the options, those lines will be locked in, whenever you switch timeframes on the chart. This allows you to "lock in" a timeframe's trendlines and then view it on different timeframes. But if you want to view the current trendlines for a timeframe then you need to select that "lockdown" timeframe in the settings. The original code was created by eleven11
