Lumiere’s Indicator BundleThe Lumiere’s Indicator Bundle combines three of Lumiere’s most used tools into one script:
🔹 BOS Mark-out – Marks Breaks of Structure with clear bullish/bearish levels and optional alerts.
🔹 Liquidity Mark-ou t – Draws significant swing highs/lows and automatically removes them once swept.
🔹 Trading Session High/Low – Tracks Asia, London, and New York session ranges with customizable timezone.
Why this bundle?
I made this bundle so everyone can run all my indicators at once without having to pick and choose between them or worry about chart space limits.
Instead of loading 3 separate indicators, this package gives you everything in one place. You can toggle each module (BOS, Liquidity, Sessions) on or off from the settings. All inputs are kept clean and organized in their own sections for easy adjustments.
What to expect
BOS lines always plotted on top for maximum clarity.
Liquidity highs/lows update in real time and get removed when taken out.
Session ranges show the active session’s high/low and can mark sweeps after the session closes.
Default timezone is New York (UTC-4), but you can switch to any TradingView-supported timezone.
BOS alerts are included, so you’ll never miss a structural break.
Sessions

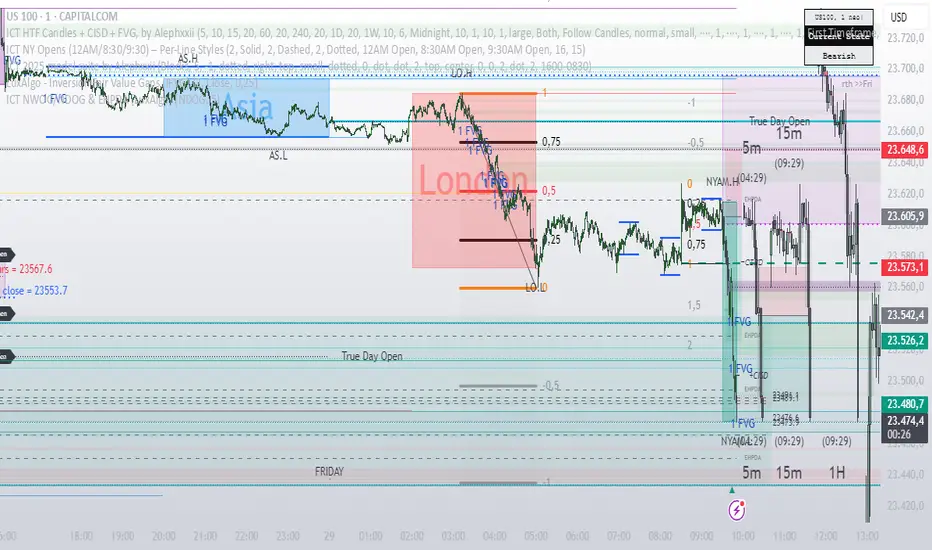
ICT HTF Candles + CISD + FVG, by AlephxxiiICT HTF Candles + CISD + FVG
A practical, friendly overlay for ICT-style trading
This indicator gives you three things at once—right on your chart:
HTF Candles Panel (context):
Compact candles from higher timeframes (e.g., 5m, 15m, 1H, 4H, 1D, 1W) appear to the right of price so you always see the higher-timeframe story without switching charts. It includes labels, remaining time for the current HTF candle, and optional open/high/low/close reference lines.
CISD Levels (bias flips):
Automatically plots +CISD and -CISD lines. When price closes above +CISD, the indicator considers bullish delivery. When price closes below -CISD, it considers bearish delivery. An on-chart table (optional) shows the current bias at a glance.
FVG (Fair Value Gaps):
Highlights inefficiency zones (gaps) on your current timeframe and/or a selected higher timeframe. You can choose to mark a gap “filled” when price hits the midpoint (optional).
Quick start (2 minutes)
Add to chart and keep your normal trading timeframe (e.g., 1–5m).
In settings → HTF 1..6, pick the higher timeframes you want to see (e.g., 5m, 15m, 1H, 4H, 1D, 1W).
Turn on FVG (current, HTF or both).
Watch +CISD / -CISD lines and the Current State table.
Close above +CISD → Bullish bias
Close below -CISD → Bearish bias
Trade with the bias and use FVGs as areas to refine entries or targets.
How to read it (the simple way)
Bias (CISD):
Bullish once price closes above the active +CISD level.
Bearish once price closes below the active -CISD level.
The small table (if enabled) says Bullish or Bearish right now.
HTF panel:
Shows higher-timeframe candles next to your current chart.
Labels show the timeframe (e.g., 1H) and a countdown for the current candle.
Optional traces draw HTF Open/High/Low/Close levels—great “magnets” for price.
FVGs:
Shaded boxes = potential inefficiency areas.
If Midpoint Fill is on, a touch of the midline counts as filled.
You can display current TF, HTF, or both.
Suggested workflow (popular ICT-style intraday)
Define bias with CISD
Only look for longs if Bullish, shorts if Bearish.
Check HTF context
Are you trading into a large HTF FVG or key HTF O/H/L/C level? That can be a target or a headwind.
Refine entries with FVGs
On your entry TF (1–5m), use fresh FVGs in the direction of the bias. Avoid fading straight into big HTF imbalances.
Key settings you’ll actually use
HTF 1..6: toggle each strip, select timeframe, and how many candles to show.
Style & layout: adjust offset, spacing, and width of the right-side panels.
Labels & timers: show/hide HTF name and remaining time; place labels at Top/Bottom/Both.
Custom daily open (NY): set the 1D candle to start at Midnight, 08:30, or 09:30 (America/New_York).
Trace lines: optional HTF O/H/L/C lines (style, width, anchor TF).
FVG module (extra): choose Current TF / HTF / Both, enable Midpoint Fill, auto-delete on fill, and show timeframe labels.
CISD lines: customize color, style (solid/dotted/dashed), thickness, and forward extension.
Table: enable/disable and choose its position.
Alerts
When a CISD completes, the script fires an alert (e.g., “Bullish CISD Formed” or “Bearish CISD Formed”).
Tip: Set your TradingView alert once on the indicator, then choose the alert message you want to receive.
Notes & limitations (read me)
“VI” label: The “Volume Imbalance” option marks price imbalances (body non-overlap). It does not read volume data.
Timezone: Daily logic and timers use America/New_York, which aligns with US indices/equities and common ICT practice.
Performance: This tool draws many boxes/lines/labels. If your chart feels heavy, reduce the number of HTFs or candles shown, or narrow panel width.
Repainting: HTF panels are designed to avoid future leakage; FVG logic follows standard 3-bar checks. As usual, wait for candle closes for confirmations.
Level cleanup: If Keep old CISD levels is OFF (default), the script keeps only the current active CISD to reduce clutter.
ICT Multi-Session Hi/L/EQ
Indicator Overview: The "ICT Multi-Session Hi/L/EQ" indicator is a versatile tool designed for traders utilizing Inner Circle Trader (ICT) strategies, enabling the visualization of key price levels—High (H), Low (L), Equilibrium (EQ, the midpoint between high and low), and Optimal Trade Entry (OTE) levels at 61.8%, 70%, and 79% of the session range—across up to 6 customizable market sessions on a single chart.
Core Functionality: It dynamically tracks and plots session-specific highs, lows, and EQ, updating in real-time as price action evolves, providing traders with immediate insights into potential support, resistance, and balance zones during defined periods like the Asian, London, or New York sessions. This multi-session capability allows for comprehensive market analysis without the need for multiple indicators.
Unique OTE Auto Detection: A standout feature is the automatic detection and directional calculation of OTE levels. When a session forms a new high, OTE levels are recalculated downward from the high to the low (bearish bias), highlighting potential short entry zones. Conversely, a new low triggers upward OTE levels from the low to the high (bullish bias), signaling long opportunities. This auto-detection adapts to market momentum without manual input, making it highly unique for ICT traders seeking efficient entry signals based on range retracements. No other indicator combines this session-based auto-directionality with OTE percentages tailored for ICT methodologies.
Left-Side Trimming Innovation: Another innovative aspect is the left-side trimming option, which allows users to limit the historical extension of lines to a user-defined number of bars (e.g., the last 8 bars), reducing chart clutter and focusing attention on recent price action. This feature is particularly unique as it addresses a common issue in multi-session indicators where full historical lines can overwhelm the chart, making it ideal for scalpers or day traders who prioritize clarity.
Without trimming the left side:
And when left side trimming is enabled:
Multi-Session Customization: Support for up to 6 independent sessions, each with individual time ranges (HHMM-HHMM format), timezones, and enable/disable toggles, offers unparalleled flexibility. Traders can configure sessions for specific market phases (e.g., Asia: 2000-0000 UTC) and customize colors, line styles (solid, dashed, dotted), and label properties separately, ensuring a personalized setup for global trading environments.
Auto-Deletion at Market Close: Levels can be automatically deleted at the session's calculated market close (17:00 NY timestamp), keeping the chart clean for the next session or day, a useful feature for avoiding accumulation of outdated levels.
Label and Visual Controls: Users can toggle labels on/off, adjust text color, background color, transparency, and size (tiny, small, normal, large), with options to stick labels to the right for better visibility. This level of customization ensures the indicator integrates seamlessly with any chart style.
No External Dependencies: All calculations are performed using built-in Pine Script functions on the chart's price data, making it self-contained and reliable without needing external libraries or data sources.
Professional and Compliant Design: Developed to comply with TradingView House Rules, this indicator is original in its combination of multi-session plotting, directional OTE auto-detection, and left-side trimming, providing traders with a robust tool for ICT-based analysis.
How It Works
Session Setup: Define session times and timezones in settings; the script tracks high/low from session start.
Level Calculation: High/low update on every bar; EQ is the midpoint. OTE levels recalculate directionally upon new extremes.
Drawing Mechanism: Lines extend with user-defined padding; trimming cuts left side for cleanliness.
Update Logic: OTE direction shifts based on new high/low detection, with levels refreshed accordingly.
Deletion: Auto-deletes at session end if enabled, resetting for new sessions.
Uniqueness and Innovation
Session OTE Auto Detection: Automatically adjusts OTE direction based on new highs/lows, a feature not commonly available in other indicators, enabling hands-free bias identification.
Left-Side Trimming: Unique clutter-reduction tool that trims historical lines, improving chart readability—a rare capability in session-based indicators.
Multi-Session Support: Handles 6 sessions independently, with per-session OTE, making it a one-stop tool for global market analysis.
Directional OTE: Adapts to market bias, offering dynamic entry zones tailored to ICT strategies.
Full Customization: Extensive controls for visuals and behavior, ensuring adaptability to individual trading styles.
User Guide: How to Use the "ICT Multi-Session Hi/L/EQ" Indicator
This guide provides a comprehensive, step-by-step explanation of how to use the "ICT Multi-Session Hi/L/EQ" indicator on TradingView. The indicator is designed to help Inner Circle Trader (ICT) enthusiasts plot key price levels—High (H), Low (L), Equilibrium (EQ, the midpoint), and Optimal Trade Entry (OTE) levels at 61.8%, 70%, and 79% of the session range—across up to 6 customizable sessions. It also includes a Candle Open line for midnight or custom times. I'll break it down by settings groups, explaining each option, its purpose, how to tweak it, and tips for optimal use. All settings are accessible via the indicator's settings panel (cog icon next to the indicator name on your chart).
General Settings
These control global behaviors that apply to all sessions and levels. They allow you to customize the overall appearance and functionality of the indicator on your chart.
Line Padding (Bars Beyond Current): This integer input (default: 2, minimum: 0) extends the plotted lines beyond the current bar by the specified number of bars.
How to Use/Tweak: Increase this value (e.g., to 5) for longer forward projections of levels, useful for anticipating future price action. Decrease to 0 for no extension. It's ideal for traders who like to see levels projected ahead in volatile markets.
Tip: On lower timeframes (e.g., 5M), higher padding (4-6) helps visualize potential targets; on higher timeframes (1H), keep it low to avoid clutter.
Label Padding (Bars from Line End): An integer (default: 3, minimum: 0) that positions labels away from the end of the lines by the specified bars.
How to Use/Tweak: Adjust to move labels further right (higher value) or closer to the line end (lower value). This prevents label overlap with price action or other indicators.
Tip: If your chart has many labels, set to 5+ for better readability; use 1-2 for minimalistic setups.
Enable Left-Side Trimming: A boolean toggle (default: true) to trim lines from the left, limiting their historical extension.
How to Use/Tweak: Turn on to reduce chart clutter by showing only recent bars of the lines; turn off for full historical view. Pairs with "Left Trim Bars" for fine-tuning.
Tip: Enable for clean charts during live trading; disable for backtesting to see long-term patterns.
Left Trim Bars: An integer (default: 8, minimum: 1) specifying how many bars back from the current bar to trim lines when left trimming is enabled.
How to Use/Tweak: Set higher (e.g., 20) for more historical visibility while trimmed; lower (e.g., 4) for ultra-clean charts focusing on immediate action.
Tip: Use 8-12 for intraday trading on 15M charts; adjust based on timeframe to balance context and clarity.
Stick Labels to Right of Current Bar: A boolean toggle (default: true) to position labels at the right end of the lines.
How to Use/Tweak: Enable for labels to "stick" right, keeping them visible as the chart updates; disable for labels at the current bar position.
Tip: Keep enabled for real-time trading to avoid labels shifting left; disable for static analysis.
Delete Previous Session Lines/Labels on Market Close: A boolean toggle (default: true) to automatically delete session lines and labels at the calculated market close (17:00 NY time).
How to Use/Tweak: Enable to keep the chart clean by clearing old sessions; disable to retain historical levels for reference.
Tip: Enable for live trading to focus on active sessions; disable for educational reviews or backtesting.
Session 1 to 6 Settings
Each session has identical options, allowing independent configuration. I'll describe Session 1; replicate for others by changing the number (e.g., Session 2 uses "Session 2 Name", etc.).
Session Name: String input (default: "Asia" for Session 1) to label the session (e.g., "Asia" or "London").
How to Use/Tweak: Enter a descriptive name like "NY Open" for clarity in labels (e.g., "NY Open High").
Tip: Use short names to avoid long labels; this appears in all session labels for easy identification.
Session Time (HHMM-HHMM): Session input (default: "2000-0000" for Session 1) to define the start and end time.
How to Use/Tweak: Set the time range (e.g., "0930-1600" for NY session). Ensure start < end in 24-hour format.
Tip: Use for custom sessions like "London Kill Zone" (0800-1100); validate with the timezone setting.
Session Timezone: String selection (default: "America/New_York") from a list of options.
How to Use/Tweak: Choose the timezone matching your session (e.g., "Europe/London" for UK times).
Tip: Align with session name for accuracy; "Etc/UTC" for universal times.
Enable Session Drawings: Boolean toggle (default: true for Session 1, false for others) to activate the session's lines and labels.
How to Use/Tweak: Enable to show the session; disable to hide it without removing settings.
Tip: Enable one session at a time for focused analysis; use for multi-session overlays.
Enable EQ Line/Label: Boolean toggle (default: true) to show the EQ line and label.
How to Use/Tweak: Enable for midpoint plotting; disable to hide EQ while keeping high/low.
Tip: Useful for ICT fair value gaps; toggle off if focusing on extremes only.
Enable Labels: Boolean toggle (default: true) to show labels for high, low, EQ, and OTE levels.
How to Use/Tweak: Enable for annotated levels; disable for lines-only view.
Tip: Disable on crowded charts; customize label size for better readability.
Enable OTE Levels: Boolean toggle (default: false) to activate OTE levels (61.8%, 70%, 79%).
How to Use/Tweak: Enable for OTE plotting; disable to hide while keeping high/low/EQ.
Tip: Toggle on for entry zone identification; adjust colors for visual distinction.
Line Color: Color input (default varies by session, e.g., blue for Session 1) for lines.
How to Use/Tweak: Choose a color to differentiate sessions (e.g., green for bullish).
Tip: Use contrasting colors for multiple sessions; match your chart theme.
Line Style: String selection (default: "Dashed") from "Solid", "Dashed", "Dotted".
How to Use/Tweak: Select style for line appearance (e.g., dotted for OTE).
Tip: Use dashed for OTE to distinguish from solid high/low lines.
Label Text Color: Color input (default: white) for label text.
How to Use/Tweak: Set to contrast with background (e.g., black on white charts).
Tip: Use bright colors for visibility; match line color for cohesion.
Label Background Color: Color input (default: black) for label background.
How to Use/Tweak: Choose a semi-transparent background for readability.
Tip: Set to chart background color for subtle labels.
Label Transparency (0=opaque, 100=transparent): Integer input (default: 70) for label opacity.
How to Use/Tweak: Lower for solid labels (e.g., 0); higher for see-through (e.g., 90).
Tip: Use 50-80 for balance; 100 hides background entirely.
Label Text Size: String selection (default: "Small") from "Tiny", "Small", "Normal", "Large".
How to Use/Tweak: Choose size for label visibility (e.g., "Large" for emphasis).
Tip: "Small" for crowded charts; "Large" for main levels.
OTE 61.8% Color: Color input (default: purple) for 61.8% OTE line.
How to Use/Tweak: Customize to highlight the 61.8% level (e.g., gold for key entry).
Tip: Use distinct colors for each OTE level to differentiate (e.g., purple, orange, teal).
OTE 70% Color: Color input (default: orange) for 70% OTE line.
How to Use/Tweak: Set to a secondary color for mid-range OTE.
Tip: Coordinate with overall theme; use faded shades for less prominence.
OTE 79% Color: Color input (default: teal) for 79% OTE line.
How to Use/Tweak: Choose for the deepest OTE level (e.g., red for aggressive entries).
Tip: Make it stand out if 79% is your preferred entry zone.
Candle Open Settings
This section adds a custom open line (e.g., midnight open) with similar customization.
Use Time 1: Boolean toggle (default: true) to enable the first time setting.
How to Use/Tweak: Enable for the open line; disable to hide.
Tip: Use for midnight open in ICT setups; toggle off if not needed.
Name: String input (default: "Midnight Open") for the open line label.
How to Use/Tweak: Change to "Daily Open" or similar for context.
Tip: Keep short for clean labels.
Start Time: String input (default: "0000") for open range start.
How to Use/Tweak: Set in HHMM format (e.g., "0000" for midnight).
Tip: Ensure valid (0000-2359); pair with end time for narrow ranges.
End Time: String input (default: "0001") for open range end.
How to Use/Tweak: Set slightly after start (e.g., "0001") for precise open capture.
Tip: Use for quick ranges; start < end always.
Color: Color input (default: teal) for the open line.
How to Use/Tweak: Customize to distinguish from session lines.
Tip: Use gray for subtle open lines.
Timezone: String selection (default: "America/New_York") for the open line.
How to Use/Tweak: Choose matching your chart or session.
Tip: "Etc/UTC" for universal opens.
Enable Line/Label: Boolean toggle (default: true) for the open line/label.
How to Use/Tweak: Enable to show; disable to hide.
Tip: Use for daily opens in ICT; toggle off for session-only focus.
Enable Label: Boolean toggle (default: true) for the open label.
How to Use/Tweak: Enable for named label; disable for line-only.
Tip: Disable if labels clutter the chart.
Auto Delete at 18:00 NY: Boolean toggle (default: true) to delete at 18:00 NY.
How to Use/Tweak: Enable for cleanup; disable to retain.
Tip: Align with new day start; useful for resetting.
Stick Label to Right: Boolean toggle (default: true) for label positioning.
How to Use/Tweak: Enable for right-side labels; disable for current bar.
Tip: Keep enabled for visibility as chart updates.
Enable Left-Side Trimming: Boolean toggle (default: true) for open line trimming.
How to Use/Tweak: Enable to trim historical open line; disable for full view.
Tip: Similar to session trimming; use for clean charts.
Left Trim Bars: Integer input (default: 8) for open line trim bars.
How to Use/Tweak: Set the number of bars back to show when trimming.
Tip: Lower for more focus; higher for context.
Line Padding (Bars Beyond Current): Integer input (default: 2) for open line extension.
How to Use/Tweak: Increase for forward projection; decrease for no extension.
Tip: Match general padding for consistency.
Label Padding (Bars from Line End): Integer input (default: 3) for open label position.
How to Use/Tweak: Adjust to move label away from line end.
Tip: Higher for spaced labels; lower for compactness.
Line Style: String selection (default: "Solid") for open line style.
How to Use/Tweak: Choose "Dashed" or "Dotted" for distinction.
Tip: Use dotted for subtle opens.
Label Text Color: Color input (default: white) for open label text.
How to Use/Tweak: Set to contrast with background.
Tip: Black for light charts.
Label Background Color: Color input (default: black) for open label background.
How to Use/Tweak: Customize for visibility.
Tip: Semi-transparent for blend.
Label Transparency: Integer input (default: 70) for open label opacity.
How to Use/Tweak: 0 for opaque; 100 for transparent.
Tip: 50-80 for balance.
Label Text Size: String selection (default: "Small") for open label size.
How to Use/Tweak: "Large" for emphasis; "Tiny" for minimalism.
Tip: "Normal" for standard use.

samc's FX SESSIONS - on candles So, based on my 8 yrs of experience and over a 2 decade worth of back testing on FX majors pairs one thing i can univocally affirm to the fact that Timing is everything especially in the currency markets.
so i made this indicator to help reduce the noise and focus on signals which is coded by time,
now i made this as GMT+8 in focus but you can adjust based on your requirements.
I classified my indicator colors according to the inter-SESSION High Impact areas only as following :
Primary session colors:
ASIAN - YELLOW
EU - BLUE
US - Magenta (light)
and every first 10 mins of the hour (Great for scalping)
i marked them in a shade of grey.
secondary sessions i marked them as minor sessions.
PRE-EU 1hr of expected trend i marked in color green
and
after hours in a shade of color violet.
so i usually make my candles into light grey by default and remove the body and wicks to minimize the visual stimulus so that this indicator will work great with both dark and light themes and does not obstruct other indicators.
also i made an option to uncheck my naming scheme of session on the top right.

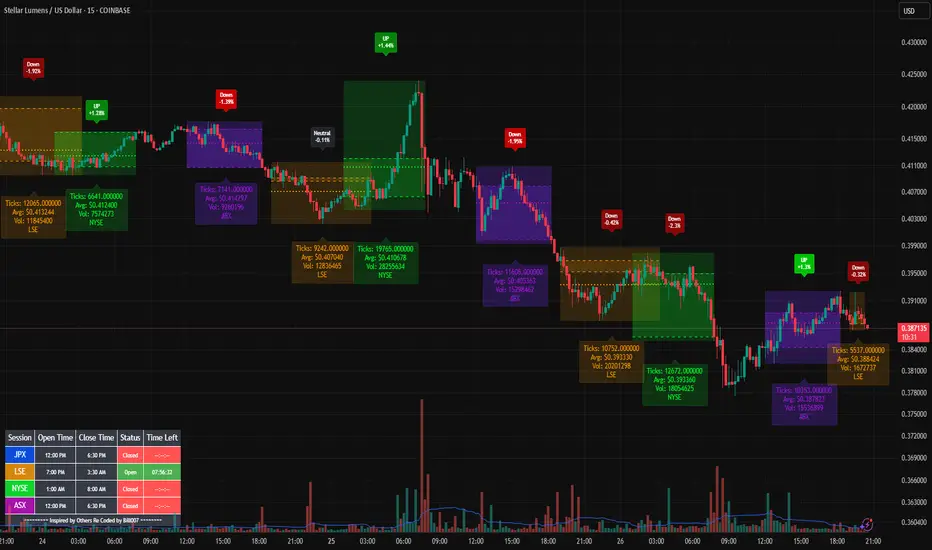
Bills Advanced Market Sessions V5Bill007 Advanced Enhanced Market Sessions & Table V5 is a TradingView Pine Script indicator that
visualizes major stock market sessions and data for (Tokyo, London, New York, Sydney, Frankfurt) on charts.
**Purpose and Logic:**
- Visual Displays include session boxes, open/close/average lines, labels for session
names/metrics (ticks, avg price, volume), and trend labels (UP/Down/Neutral with % change)
and a Debug table.
- Uses custom types (SessionDisplay, SessionInfo) and methods to create/update sessions
dynamically, handling multi-part sessions (e.g., Tokyo breaks).
- Batch updates sessions for efficiency, checks timezones, weekdays, and daily changes to avoid
duplicates.
- Includes tables for session times/status/countdowns and debug metrics (tick range, average
price, volume, trend %, open, close).
- Supports 25 timezones for accurate global session timing.
- All labels have dynamaic tooltips that provide extra outputs which saves chart clutter
- Realtime lastbar session updates for current session
**Settings:**
- Select Market Sessions to suit
- Toggles for lines, ranges, averages, volumes, labels, boxes, weekends.
- Customizable colors, timezones, session times, thresholds for neutral trends, label offsets to
move labels around for clearer visuals.
- Table position/timezone, debug options.
- Timezone select to update Session times open close according to what time zone you're in
**Benefits:**
- Enhanced session data at a glance
- Enhances multi-market awareness, highlights session overlaps, trends, and key metrics.
- Aids timing entries/exits, volume analysis, reduces clutter with toggles.
- Supports global trading strategies with accurate timezone handling and visuals.
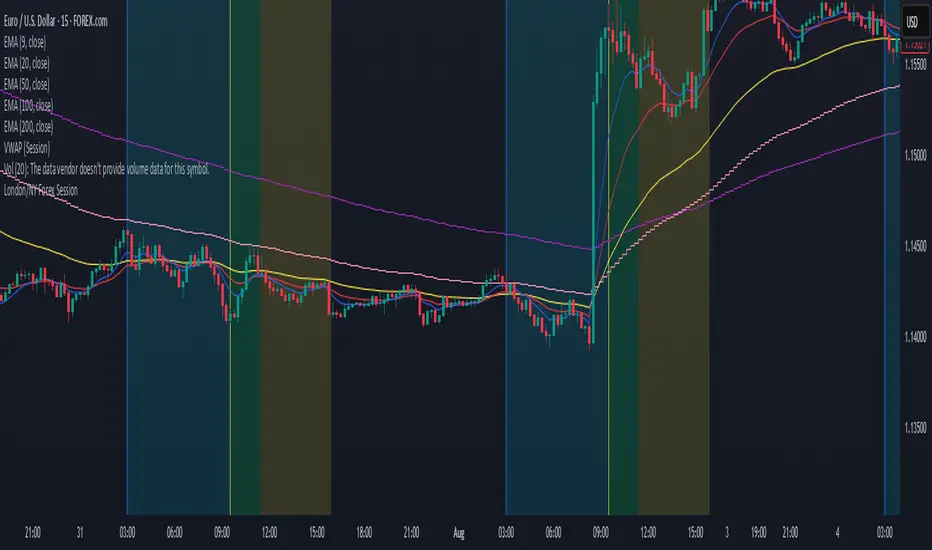
London/NY Forex SessionDesigned for Forex traders who want a clear view of market dynamics.
This tool highlights the most active trading windows of the day, helping you align with institutional moves and avoid low-liquidity periods.
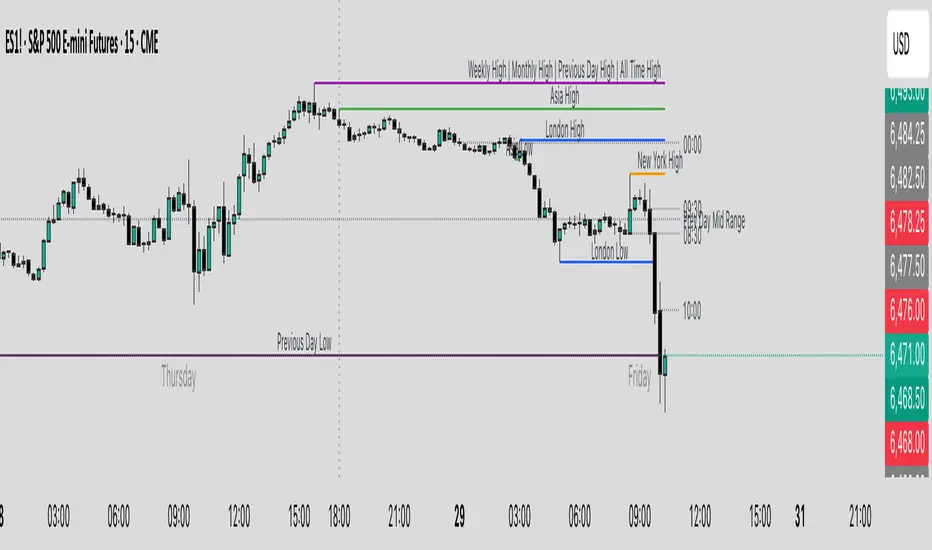
Key Levels & Session Highs/Lows by OdegosProfessional multi-timeframe support and resistance level indicator that automatically tracks and displays key price levels across different trading sessions and timeframes.
🎯 What it shows:
Session Open - Daily market open reference line
Asia & London Sessions - High/low levels from major trading sessions
Previous Day - Yesterday's actual high and low levels
Weekly & Monthly - Higher timeframe support/resistance levels
⚡ Smart Features:
Auto-combines overlapping levels with merged labels
Break detection - Lines stop when price breaks through (optional)
Timezone support - Works with any global timezone
Universal colors - Optimized for both light and dark chart themes
Clean interface - Organized settings with intuitive dropdowns
🛠️ Fully Customizable:
Individual show/hide toggles for each level type
Custom colors, line styles, and widths
Adjustable label text and positioning
Global text color override option
Perfect for day traders, swing traders, and anyone who relies on key support/resistance levels for market analysis.
Session High/Low/PD Selector with Realtime AlertsThis indicator displays key intraday and multi-day price levels directly on the chart for short-term traders. It includes:
Session Highs and Lows for Asia, London, and New York sessions
→ Automatically plots each completed session’s high and low, with lines extended to the right and labeled.
Previous Day High, Low, and Close
→ Draws levels from the prior daily candle with adjustable colors and labels.
Previous Week High and Low
→ Weekly key levels are plotted just like daily ones.
Real-time Alerts
→ Optional alerts trigger immediately when price touches or breaks any session, PDH/PDL, or PWH/PWL levels.
Fully Customizable
→ Toggle sessions, previous day/week levels, label positions, and colors per user preference.

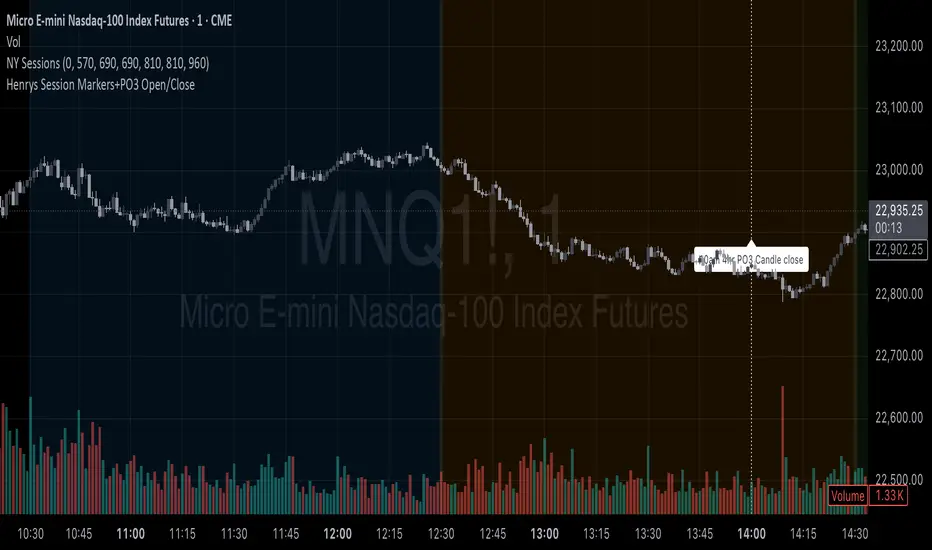
Henrys Session Markers+PO3 Open/Close v.2This indicator automatically marks out Asia Session, London Session, New York Session, and the 10am 4hr PO3 Candle Open and Close. This indicator can help out traders who dont want to mark out their sessions everyday while trading or backtesting.

Henrys Session Markers+PO3 Open/CloseThis indicator marks out New Day, Asia, London, and New York Sessions. It also marks out when the 10am PO3 Candle opens and closes. I hope this helps out other traders who trade ICT/SMC who dont want to mark out session start/close each day and while backtesting.
Time Intervals [signBTC]This script is designed to visualize 6 auxiliary time intervals on the chart near the time axis. Each of these intervals can be configured by the user with the following options:
Interval duration: Any duration can be set (for example, 1 hour, 2 hours, 4 hours, etc.).
Interval color: Each time block can have its own color for better visual distinction.
Label: Users can add a custom label for each of the 6 intervals to indicate its purpose or highlight important features.
In the default configuration, the script automatically draws 6 equal four-hour intervals for each trading day, dividing each daily trading session into six parts—two for each of the three standard market sessions, or three per each of two major sessions (if considering only regular daytime and extended overnight trading).
This tool is particularly useful for traders who want to quickly navigate different time areas of the trading day, monitor individual parts of a session, or highlight specific time windows for strategy analysis. All script parameters (interval, color, and label for each block) are easily adjustable in the indicator's settings.

ICT x Vihapa 4 in 1Indicator Description:
This indicator is designed to provide comprehensive market structure and session-based insights. It includes:
NWoG / NDoG Levels: Displays New Week Opening Gap (NWoG) and New Day Opening Gap (NDoG) for market context.
Key Opening Price Levels: Highlights significant time-based price levels, including 00:00, 08:30, 09:30, and 13:00.
Previous Key Levels: Marks critical historical levels such as the previous week's high and low, previous day’s high and low, and 4-hour highs and lows.
Trading Sessions: Clearly distinguishes major market sessions including the Asian, London, and New York sessions.
This indicator serves as a valuable tool for traders seeking to align their strategies with institutional price behavior and time-based market dynamics.

Essa's Sessions IndicatorOverview
This powerful tool is designed to visually map out the key trading sessions: Asia, London, and New York directly on your chart. By highlighting these periods and plotting their respective highs and lows, it helps you identify critical price levels, gauge market sentiment, and pinpoint potential breakout opportunities with ease.
What It Does
Visualizes Key Trading Sessions: Automatically draws colored backgrounds for the Asia, London, and New York sessions to show you exactly when the most important market activity is happening.
Plots Session Highs & Lows: Displays precise horizontal lines for the highest and lowest prices reached during each session, acting as key support and resistance levels.
Dual Timezone Mode: Easily switch between London (GMT/BST) and New York (EST/EDT) timezones with a single click. The indicator automatically adjusts all session times for you, ensuring accuracy no matter where you are.
Interactive & Informative Labels: Hover over any session high or low label to see a detailed tooltip containing:
The exact price level.
The session's price range (calculated in pips or points).
The total daily price range for broader context.
A simple volatility gauge (from "Low Vol 😴" to "High Vol 🔥").
Customizable Alerts: Enable breakout alerts to receive instant notifications the moment the price closes above a session high or below a session low.
Simple, powerful, and highly informative, this indicator is an essential tool for traders looking to build strategies around session-based price action.

Institutional Sessions Overlay (Asia/London/NY)Institutional Sessions Overlay is a professional TradingView indicator that visually highlights the main trading sessions (Asia, London, and New York) directly on your chart.
Customizable: Easily adjust session start and end times (including minutes) for each market.
Timezone Alignment: Shift session boxes using the timezone offset parameter so sessions match your chart’s timezone exactly.
Clear Visuals: Colored boxes and optional labels display session opens and closes for fast institutional market structure reference.
Toggle Labels: Show or hide session open/close labels with a single click for a clean or detailed look.
Intuitive UI: User-friendly grouped settings for efficient configuration.
This tool is designed for day traders, institutional traders, and anyone who wants to instantly recognize global session timing and ranges for SMC, ICT, and other session-based strategies.
How to use:
Set your chart to your local timezone.
Use the "Session timezone offset" setting if session boxes do not match actual session opens on your chart.
Adjust the hours and minutes for each session as needed.
Enable or disable labels in the “Display” settings group.
Tip: Use the overlay to spot session highs and lows, volatility windows, and institutional liquidity sweeps.

Session Visualizer by Timezone (Fixed)Session Visualizer by Timezone (Asia, London, New York)
This indicator highlights the Asian, London, and New York trading sessions directly on your chart — adjusted to your local timezone (via UTC offset).
🔧 Key Features:
Session times automatically adjust based on your chosen UTC offset
Toggle each session on/off individually
Custom background colors for each session
Designed for all intraday timeframes (1m – 4H)
📍 Sessions Covered:
Asian Session – Generally lower volatility and slower price movement; ideal for range traders and pre-positioning
London Session – Marked increase in volatility as European markets open
New York Session – Highest volume and volatility, especially during the London-New York overlap
🕓 Time Offset Setting:
Input your local UTC offset (e.g., UTC+10 for Sydney, UTC+1 for Berlin, UTC-5 for New York). The indicator adjusts session display accordingly.

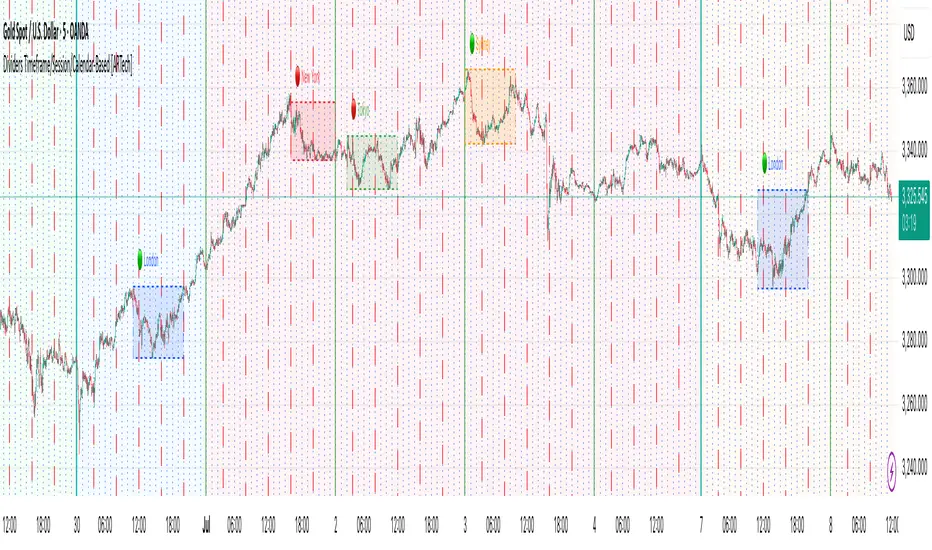
Dividers Timeframe/Session/Calendar-Based [ARTech]Dividers Timeframe/Session/Calendar-Based
This indicator provides customizable visual dividers for multiple timeframes, trading sessions, and calendar-based periods (daily, weekly, monthly). It helps traders visually separate chart areas by key time boundaries without cluttering the chart with price lines.
Key Features:
Multi-Timeframe Dividers: Select up to 4 timeframes (e.g., 60 min, 4 hours, daily, weekly) to display customizable lines marking the start of each timeframe’s candle.
Session Dividers: Define up to 4 trading sessions with user-defined time zones, colors, and active weekdays. The indicator highlights the session’s highest and lowest price range using a box, and compares the session’s opening and closing prices. Based on this comparison, it displays a green or red emoji to indicate bullish or bearish sessions, making it easy to identify session momentum visually.
Calendar-Based Dividers: Enable daily, weekly, or monthly background color zones, with individual toggles and color settings for each day, week, or month. Perfect for visually distinguishing trading periods.
Why use this indicator?
Divider Indicator helps keep your chart organized by visually segmenting timeframes, sessions, and calendar periods, aiding in better analysis of price action relative to important time boundaries.
How to Use
███████ Timezone ███████
A valid timezone name exactly as it appears in the chart’s lower-right corner (e.g. New York, London).
A valid UTC offset in ±H:MM or ±HH:MM format. Hours: 0–14 (zero-padded or not, e.g. +1:30, +01:30, -0:00). Minutes: Must be 00, 15, 30, or 45.
Examples;
UTC → ✅ Valid
Exchange → ✅ Valid
New York → ✅ Valid
London → ✅ Valid
Berlin → ✅ Valid
America/New York → ❌ Invalid. (Use "New York" instead)
+1:30 → ✅ Valid offset with single-digit hour
+01:30 → ✅ Valid offset with zero-padded hour
-05:00 → ✅ Valid negative offset
-0:00 → ✅ Valid zero offset
+1:1 → ❌ Invalid (minute must be 00, 15, 30, or 45)
+2:50 → ❌ Invalid (minute must be 00, 15, 30, or 45)
+15:00 → ❌ Invalid (hour must be 14 or below)
███████ Timeframe ███████
Use this section to display vertical divider lines at the opening of higher timeframe candles (e.g., 1H, 4H, Daily, Weekly). This helps visually separate price action according to larger market structures.
1. Enable a Timeframe:
Turn on one or more timeframes (e.g., 60, 240, D, W) by checking their respective toggle boxes.
2. Lines Mark Candle Opens:
Each active timeframe will draw a vertical line at the start of its candle , making it easier to align intraday moves with larger timeframe shifts.
3. Customize Line Style:
For each timeframe, you can individually set:
Line Style: Solid, dashed, or dotted.
Line Width: From 1 to 10 pixels.
Line Color: Pick any color to match your chart theme.
Opacity: Use transparent colors to avoid overwhelming the chart.
4. Use Multiple Timeframes Together:
You can enable multiple timeframe dividers simultaneously. To maintain clarity:
Use distinct colors for each timeframe.
Use thinner or dotted lines for lower timeframes and bolder lines for higher ones.
Match line style and color intensity to reflect timeframe importance. (e.g., a thick green solid line for Weekly, a thin gray dotted line for 1H)
5. Visual Tip:
These dividers are especially useful for identifying higher timeframe candle opens during intraday trading, spotting breaks above/below previous candle ranges, or aligning session-based strategies with higher timeframe trends.
███████ Session ███████
Use this section to visually highlight specific trading sessions (e.g., London, New York, Tokyo, Sydney) on your chart using time zones, session ranges, and optional weekday filters. This helps focus your analysis on active market hours.
1. Enable a Session:
Activate up to 4 separate trading sessions. Each session can be named (e.g., "London") and customized independently.
2. Set Session Time and Days:
Define session time using the hhmm-hhmm format. (e.g., 0800-1700)
Select which days of the week the session applies to (Sunday through Saturday)
Set your preferred time zone (UTC, Exchange, etc.) from the global settings.
3. Session Box Drawing:
For each active session, the indicator will:
Draw a background-colored box from the session’s start to end time.
Stretch the box to fit the highest and lowest price within that time window.
Draw an outline using customizable border style and width.
4. Session Labels and Directional Hints:
Optionally display the session’s name as a label.
The indicator compares the session’s opening and closing prices . Based on the result:
📈 Green emoji shows a bullish session (close >= open)
📉 Red emoji shows a bearish session (close < open)
5. Display Options:
Show all sessions, only the last session, or a specific number of previous sessions.
Customize label size, location (top/bottom), and whether it appears inside or outside the box.
Adjust background opacity to blend the sessions neatly into your chart.
6. Visual Tip:
Session boxes are particularly useful for:
Spotting repeated highs/lows during active trading hours.
Recognizing session-based breakouts or consolidations.
Comparing performance across different markets and time zones.
███████ Calendar-Based ███████
This section helps you visually segment your chart based on calendar periods: daily, weekly, and monthly. You can enable background color highlighting for individual days, weeks, or months to better track price movements within these time frames.
1. Enable Daily, Weekly, or Monthly Highlighting:
Toggle on the options for Daily, Weekly, and/or Monthly highlighting according to your needs.
2. Select Specific Days, Weeks, or Months:
For Daily, enable any combination of days (up to 7) to color-code.
For Weekly, enable up to 5 weeks per month to cover partial weeks.
For Monthly, enable up to 12 months with individual toggles and colors.
3. Customize Colors for Each Period:
Assign distinct colors to each day, week, or month for easy differentiation. Choose hues that stand out but avoid colors that are too close in tone for adjacent periods.
4. Background Opacity:
Adjust the opacity level of the background coloring to ensure it complements your chart without obscuring price data.
5. Handling Partial Weeks and Overlaps:
The weekly highlighting accounts for months that span 4 to 6 weeks by allowing toggles up to 5 weeks, including weeks that may partially overlap with previous or next months.
6. Visual Tip:
Calendar-based backgrounds are excellent for:
Quickly identifying price behavior within specific calendar units.
Comparing price action across days, weeks, or months.
Spotting seasonal trends or recurring patterns tied to calendar cycles.
IDKFAIDKFA - Advanced Order Blocks & Volume Profile with Market Structure Analysis
Why IDKFA?
Named after the legendary DOOM cheat code that gives players "all weapons and full ammo," IDKFA provides traders with a comprehensive arsenal of market analysis tools. Just as the cheat code arms players with everything needed for combat, this indicator equips traders with essential market structure tools: Order Blocks, Volume Profile, LVN/HVN areas, Fibonacci retracements, and intelligent buy/sell signals - all in one unified system.
Core Features
Order Blocks Detection
Automatically identifies institutional order blocks using pivot high/low analysis
Extends blocks dynamically until price interaction occurs
Bullish blocks (demand zones) and bearish blocks (supply zones)
Customizable opacity and extend functionality
Advanced Volume Profile
Real-time volume profile calculation for multiple session types
Point of Control (POC), Value Area High (VAH), and Value Area Low (VAL)
Mode 1: Side-by-side bull/bear volume display
Mode 2: Overlapped volume display with percentage analysis
Shows buying vs selling pressure at each price level
LVN/HVN Area Detection
Low Volume Nodes (LVN): Areas below VAL where price moves quickly
High Volume Nodes (HVN): Areas above VAH with strong resistance
NPOC (Naked Point of Control): Single print areas within Value Area
Volume-based gradient coloring shows relative activity levels
Smart Fibonacci Retracements
Auto-detects trend direction for proper fibonacci orientation
Dynamic color coding: Red levels in uptrends, Gold in downtrends
Special 88.6% level turns lime green in downtrends
Key levels: 23.6%, 38.2%, 50%, 61.8%, 65%, 78.6%, 88.6%
Intelligent Signal System
Works best on higher timeframes
Identifies high-probability reversal setups at key levels
Buy signals: Large bearish rejection followed by bullish reclaim
Sell signals: Large bullish rejection followed by bearish breakdown
Signals only trigger near significant support/resistance areas
Signal Analysis & Usage Guidelines
Buy Signal Mechanics
The buy signal triggers when:
Previous candle shows significant bearish movement (minimum ATR multiplier)
Current candle reclaims a configurable percentage of the previous candle's range
Price is near a key support level (order blocks, fibonacci, volume levels)
Sell Signal Mechanics
The sell signal triggers when:
Previous candle shows significant bullish movement (minimum ATR multiplier)
Current candle rejects below a configurable percentage of the previous candle's range
Price is near a key resistance level (order blocks, fibonacci, volume levels)
When to TAKE Signals
High Probability Buy Signals:
Signal appears AT or BELOW the VAL (Value Area Low)
Signal occurs at bullish order block confluence
Price is in LVN area below VAL (momentum acceleration zone)
Signal aligns with fibonacci 61.8% or 78.6% support
Multiple session POC levels provide support confluence
Previous session's VAL acting as current support
High Probability Sell Signals:
Signal appears AT or ABOVE the VAH (Value Area High)
Signal occurs at bearish order block confluence
Price is in HVN area above VAH (heavy resistance zone)
Signal aligns with fibonacci 61.8% or 78.6% resistance
Multiple session POC levels provide resistance confluence
Previous session's VAH acting as current resistance
When to AVOID Signals
Avoid Buy Signals When:
Signal appears ABOVE the VAH (buying into resistance)
Price is in HVN red zones (high volume resistance areas)
No clear support structure below current price
Volume profile shows heavy selling pressure (high bear percentages)
Signal occurs during low-volume periods between major sessions
Multiple bearish order blocks exist below current price
Avoid Sell Signals When:
Signal appears BELOW the VAL (selling into support)
Price is in LVN green zones (momentum could continue)
No clear resistance structure above current price
Volume profile shows heavy buying pressure (high bull percentages)
Signal occurs during Asian session ranges without clear direction
Multiple bullish order blocks exist above current price
Volume Profile Context for Signals
Understanding Bull/Bear Percentages:
70%+ Bull dominance at a level = Strong support expected
70%+ Bear dominance at a level = Strong resistance expected
50/50 Split = Neutral zone, less predictable
Use percentages to gauge conviction behind moves
POC (Point of Control) Interactions:
Signals above POC in uptrend = Higher probability
Signals below POC in downtrend = Higher probability
Signals against POC bias require extra confirmation
POC often acts as magnetic level for price return
Trading Strategies
Strategy 1: VAL/VAH Bounce Strategy
Wait for price to approach VAL (support) or VAH (resistance)
Look for signal confirmation at these critical levels
Enter with tight stops beyond the Value Area
Target opposite boundary or next session's levels
Strategy 2: Order Block + Volume Confluence
Identify order block alignment with VAL/VAH
Wait for signal within the confluence zone
Enter on signal with stop beyond order block
Use LVN areas as acceleration zones for targets
Strategy 3: LVN/HVN Strategy
LVN (Green) Areas: "Go Zones" - expect quick price movement through low volume
HVN (Red) Areas: "Stop Zones" - expect resistance and potential reversals
NPOC Areas: "Fill Zones" - price often returns to fill single print gaps
Strategy 4: Multi-Session Analysis
Use Daily/Weekly for major structure context
Use 4H for intermediate levels
Use 1H for precise entry timing
Ensure all timeframes align before taking signals
Strategy 5: Fibonacci + Volume Profile
Buy signals at 61.8% or 78.6% fibonacci near VAL
Sell signals at 61.8% or 78.6% fibonacci near VAH
Use 88.6% level as final support/resistance before major moves
50% level often aligns with POC for confluence
Signal Quality Assessment
Grade A Signals (Highest Probability):
Signal at VAL/VAH with order block confluence
Fibonacci level alignment (61.8%, 78.6%)
Volume profile shows 70%+ dominance in signal direction
Multiple timeframe structure alignment
Signal occurs during high-volume sessions (London/NY)
Grade B Signals (Moderate Probability):
Signal near POC with some confluence
Fibonacci 50% or 38.2% alignment
Mixed volume profile readings (50-70% dominance)
Some timeframe alignment present
Signal during overlap sessions
Grade C Signals (Lower Probability):
Signal with minimal confluence
Weak fibonacci alignment or none
Volume profile neutral or against signal
Conflicting timeframe signals
Signal during low-volume periods
Risk Management Guidelines
Position Sizing Based on Signal Quality:
Grade A: Standard position size
Grade B: Reduced position size (50-75%)
Grade C: Minimal position size (25%) or skip entirely
Stop Loss Placement:
Beyond order block boundaries
Outside Value Area (VAL/VAH)
Below/above fibonacci confluence levels
Account for session volatility ranges
Profit Targets:
First target: Opposite VAL/VAH boundary
Second target: Next session's key levels
Final target: Major order blocks or fibonacci extensions
Credits & Attribution
Original components derived from:
Market Sessions & Volume Profile by © Leviathan (Mozilla Public License 2.0)
Volume Profile elements inspired by @LonesomeTheBlue's volume profile script
Pivot Order Blocks by TradingWolf / © MensaTrader (Mozilla Public License 2.0)
Auto Fibonacci Retracement code (public domain)
Significant enhancements and modifications include:
Advanced LVN/HVN detection and visualization
Bull/Bear percentage analysis for Mode 2/3
Comprehensive alert system with market context
Integrated buy/sell signals at key levels
Performance optimizations and extended session support
Enhanced Mode 2/3 with percentage pressure analysis
Important Disclaimers
This indicator is a technical analysis tool designed for educational purposes. It does not provide financial advice, investment recommendations, or trading signals that guarantee profits. All trading involves substantial risk of loss, and past performance does not guarantee future results. Users should conduct their own research, understand the risks involved, and consider consulting with qualified financial advisors before making trading decisions. The signals and analysis provided are based on historical price patterns and volume data, which may not predict future market movements accurately.
Best Practices
Never trade signals blindly - always consider volume profile context
Wait for confluence between multiple tools before entering
Respect the Value Area - avoid buying above VAH or selling below VAL
Use session context - Asian ranges vs London/NY breakouts
Practice proper risk management - position size based on signal quality
Understand the bigger picture - use multiple timeframes for context
Remember: Like the IDKFA cheat code, having all the tools doesn't guarantee success. The key is learning to use them together effectively and understanding when NOT to take a signal is often more important than knowing when to take one.

True Close – Institutional Trading Sessions (Zeiierman)█ Overview
True Close – Institutional Trading Sessions (Zeiierman) is a professional-grade session mapping tool designed to help traders align with how institutions perceive the market’s true close. Unlike the textbook “daily close” used by retail traders, institutional desks often anchor their risk management, execution benchmarks, and exposure metrics to the first hour of the next session.
This indicator visualizes that logic directly on your chart — drawing session boxes, true close levels, and time-aligned labels across Sydney, Tokyo, London, and New York. It highlights the first hour of each session, projects the institutional closing price, and builds a live dashboard that tells you which sessions are active, which are in the critical opening phase, and what levels matter most right now.
More than just a visual tool, this indicator embeds institutional rhythm directly into your workflow — giving you a window into where big players finalize yesterday’s business, rebalance exposure, and execute delayed orders. It’s not just about painting sessions on your chart — it’s about adopting the mindset of those who truly move the market. Institutions don’t settle risk at the bell; they complete it in the next session. This tool lets you see that transition in real time, giving you an edge that goes beyond candles and indicators.
█ How It Works
⚪ Session Detection Engine
Each session is identified by its own time block (e.g., 09:00–17:30 for London). Once a session opens:
A full-session box is drawn to track its range.
The first hour is highlighted separately.
Once the first hour completes, the true close line is plotted, representing the price institutions often treat as the "real" close of the prior day.
⚪ Institutional True Close Logic
The script captures the close of the first hour, not the end of the day.
This line becomes a static reference across your chart, letting you visualize how price interacts with that institutional anchor:
Rejections from it show where yesterday's flow is respected.
Breaks through it may indicate that today's flows are rewriting the narrative.
⚪ Dynamic Dashboard Table
A live table appears in the corner of your screen, showing:
Each session's active status
Whether we’re inside the first hour
The current “true close” price if available
Each cell comes with advanced tooltips giving institutional context, flow dynamics, and market microstructure insights — from rebalancing spillovers to VWAP/TWAP lag effects.
█ How to Use
⚪ Use the First-Hour Line as Your Institutional Anchor
Treat it like the price level that big funds care about. Watch how the price behaves around level. Fades, re-tests, or continuation moves often occur as the market finishes recapping yesterday’s leftover orders.
⚪ Structure Entries Around the Session Context
Are you inside the first hour? Expect more volatility, more decisive flow. After the first session hour, expect fading liquidity as the market slows down and awaits the next session to open.
█ Settings
UTC Offset – Select your preferred time zone; all sessions adjust accordingly.
Session Toggles – Enable/disable Sydney, Tokyo, London, or NY.
Box Display Options – Show/hide session background, first-hour fill, borders.
True Close Line Controls – Enable line, label, and customize width & color.
Execution Hour Labels – Optional toggle for first-hour label placement.
-----------------
Disclaimer
The content provided in my scripts, indicators, ideas, algorithms, and systems is for educational and informational purposes only. It does not constitute financial advice, investment recommendations, or a solicitation to buy or sell any financial instruments. I will not accept liability for any loss or damage, including without limitation any loss of profit, which may arise directly or indirectly from the use of or reliance on such information.
All investments involve risk, and the past performance of a security, industry, sector, market, financial product, trading strategy, backtest, or individual's trading does not guarantee future results or returns. Investors are fully responsible for any investment decisions they make. Such decisions should be based solely on an evaluation of their financial circumstances, investment objectives, risk tolerance, and liquidity needs.

Timeshifter Triple Timeframe Strategy w/ SessionsOverview
The "Enhanced Timeshifter Triple Timeframe Strategy with Session Filtering" is a sophisticated trading strategy designed for the TradingView platform. It integrates multiple technical indicators across three different timeframes and allows traders to customize their trading Sessions. This strategy is ideal for traders who wish to leverage multi-timeframe analysis and session-based trading to enhance their trading decisions.
Features
Multi-Timeframe Analysis and direction:
Higher Timeframe: Set to a daily timeframe by default, providing a broader view of market trends.
Trading Timeframe: Automatically set to the current chart timeframe, ensuring alignment with the trader's primary analysis period.
Lower Timeframe: Set to a 15-minute timeframe by default, offering a granular view for precise entry and exit points.
Indicator Selection:
RMI (Relative Momentum Index): Combines RSI and MFI to gauge market momentum.
TWAP (Time Weighted Average Price): Provides an average price over a specified period, useful for identifying trends.
TEMA (Triple Exponential Moving Average): Reduces lag and smooths price data for trend identification.
DEMA (Double Exponential Moving Average): Similar to TEMA, it reduces lag and provides a smoother trend line.
MA (Moving Average): A simple moving average for basic trend analysis.
MFI (Money Flow Index): Measures the flow of money into and out of a security, useful for identifying overbought or oversold conditions.
VWMA (Volume Weighted Moving Average): Incorporates volume data into the moving average calculation.
PSAR (Parabolic SAR): Identifies potential reversals in price movement.
Session Filtering:
London Session: Trade during the London market hours (0800-1700 GMT+1).
New York Session: Trade during the New York market hours (0800-1700 GMT-5).
Tokyo Session: Trade during the Tokyo market hours (0900-1800 GMT+9).
Users can select one or multiple sessions to align trading with specific market hours.
Trade Direction:
Long: Only long trades are permitted.
Short: Only short trades are permitted.
Both: Both long and short trades are permitted, providing flexibility based on market conditions.
ADX Confirmation:
ADX (Average Directional Index): An optional filter to confirm the strength of a trend before entering a trade.
How to Use the Script
Setup:
Add the script to your TradingView chart.
Customize the input parameters according to your trading preferences and strategy requirements.
Indicator Selection:
Choose the primary indicator you wish to use for generating trading signals from the dropdown menu.
Enable or disable the ADX confirmation based on your preference for trend strength analysis.
Session Filtering:
Select the trading sessions you wish to trade in. You can choose one or multiple Sessions based on your trading strategy and market focus.
Trade Direction:
Set your preferred trade direction (Long, Short, or Both) to align with your market outlook and risk tolerance. You can use this feature to gauge the market and understand the possible directions.
Tips for Profitable and Safe Trading:
Recommended Timeframes Combination:
LT: 1m , CT: 5m, HT: 1H
LT: 1-5m , CT: 15m, HT: 4H
LT: 5-15m , CT: 4H, HT: 1W
Backtesting:
Always backtest the strategy on historical data to understand its performance under various market conditions.
Adjust the parameters based on backtesting results to optimize the strategy for your specific trading style.
Risk Management:
Use appropriate risk management techniques, such as setting stop-loss and take-profit levels, to protect your capital.
Avoid over-leveraging and ensure that you are trading within your risk tolerance.
Market Analysis:
Combine the script with other forms of market analysis, such as fundamental analysis or market sentiment, to make well-rounded trading decisions.
Stay informed about major economic events and news that could impact market volatility and trading sessions.
Continuous Monitoring:
Regularly monitor the strategy's performance and make adjustments as necessary.
Keep an eye on the results and settings for real-time statistics and ensure that the strategy aligns with current market conditions.
Education and Practice:
Continuously educate yourself on trading strategies and market dynamics.
Practice using the strategy in a demo account before applying it to live trading to gain confidence and understanding.

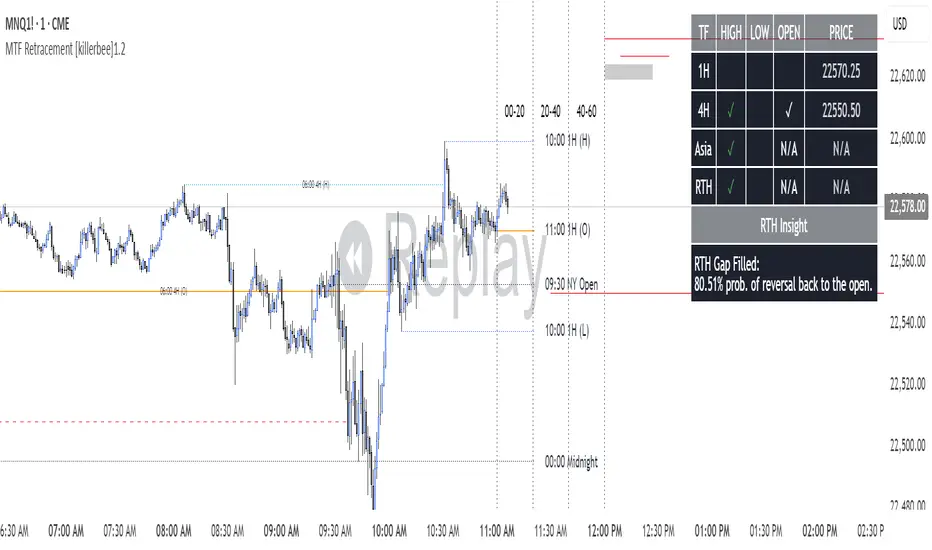
[killerbee] MTF RetracementKey Features
Multi-Timeframe (MTF) Analysis: Plot the high, low, and open from up to four user-defined higher timeframes. This allows you to see the bigger picture and identify key levels that institutional traders are watching.
Dynamic Support & Resistance: Lines are drawn at these key MTF levels and extend until price breaks through them, providing a clean and dynamic view of support and resistance.
Session Highlighting: Automatically draw boxes and high/low lines for the Asia, London, and RTH (Regular Trading Hours) sessions. This helps you understand the context of price action throughout the trading day.
Customizable Opening Price Lines: Pinpoint significant opening prices with dedicated lines for events like the "Midnight Open," "8:30 Open," and "9:30 Open."
"NQ STATS TABLE": A powerful statistical table that provides real-time insights:
Break/Hit Confirmation: Instantly see when a key MTF high/low has been broken or when an opening price has been retraced to.
9 AM Directional Bias: A bullish or bearish bias based on the close of the 9 AM (New York time) hourly candle.
Historical Probabilities: The table displays historical probabilities for price to either break a previous high/low or retrace to the open, based on the current hour of the trading session.
Extensive Customization: Nearly every visual aspect of the indicator can be customized to your preference, including colors, line styles, visibility of each component, and the position of the stats table.
How to Use
Identify Key Levels: The lines from the higher timeframes (HTF1, HTF2, etc.) represent significant support and resistance. Pay close attention to these levels as price approaches them.
Look for Breaks and Retracements:
When a high or low line is broken, the line will stop extending. This can signal a shift in market structure and a potential continuation in the direction of the break.
The "Open Line" for each timeframe represents the opening price. When the line stops extending, it means price has retraced back to that open, a common occurrence in the market.
Utilize the Sessions:
The Asia, London, and RTH boxes help you frame your trading day. The highs and lows of these sessions are often critical levels of support and resistance.
Breakouts from these session ranges can lead to strong directional moves.
Leverage the STATS TABLE:
Use the "Break" and "Hit" columns to quickly confirm when key levels have been breached or revisited.
The "Direction" row gives you a quick sentiment reading based on the 9 AM candle.
The "Trades Back %" and "High/Low Forms" provide a statistical edge by showing you the historical likelihood of certain price behaviors based on the time of day. This can help you decide whether to play for a breakout or a retracement.
TradeJorno - Time + Price Levels
Tired of manually drawing and updating important ICT or SMC time and price levels on your charts every day?
Here’s an indicator to draw important TIME and PRICE levels automatically.
Here’s what you can highlight in realtime on your charts:
1. Previous major highs and lows
⁃ Previous daily and weekly highs and low
- Weekly dividing lines
2. Session highs/lows
⁃ Plot the high and low of Asia and London sessions.
⁃ Customise the timeframe and appearance on the chart.
- Previous session settlement price.
3. Various price levels
⁃ Pre-market opening prices : midnight, 7:30 and 8:30
⁃ Regular market opening prices: 9:30, 10:00, 14:00
- end of session settlement prices
4. Market opening range high and low
⁃ Lines extending throughout the current session
⁃ Customise the timeframe and appearance on the chart.
5. ICT Macro times
- Draw customisable vertical lines and labels to indicate the start of each ICT macro
period.
Let us know in the comments below if there’s anything else we need to add!

Session Status Table📌 Session Status Table
Session Status Table is an indicator that displays the real-time status of the four major trading sessions:
* 🇯🇵 Asia (Tokyo)
* 🇬🇧 London
* 🇺🇸 New York AM
* 🇺🇸 New York PM
It shows which sessions are currently open, how much time remains until they open or close, and optionally sends alerts in advance.
🧩 Features:
* Real-time session table — shows the status of each session on the chart.
* Color-coded statuses:
* 🟢 Green – Session is open
* 🔴 Red – Session is closed
* ⚪ Gray – Weekend
* Countdown timers until session open or close.
* User alerts — receive a notification a custom number of minutes before a session starts.
⚙️ Customization:
* Table position — fully configurable.
* Session colors — customizable for open, closed, and weekend states.
* Session labels — customizable with icons.
* Notifications:
* Enabled through TradingView's Alerts panel.
* User-defined lead time before session opens.
🕒 Time Zones:
All times are calculated in UTC to ensure consistency across different markets and regions, avoiding discrepancies from time zones and daylight saving time.
🚨 How to enable alerts:
1. Open the "Alerts" panel in TradingView.
2. Click "Create Alert".
3. In the condition dropdown, choose "Session Status Table".
4. Set to any alert() trigger.
5. Save — you'll be notified a set number of minutes before each session begins.
ℹ️ Technical Notes:
* Built with Pine Script version 6.
* Logically divided into clear sections: inputs, session calculations, table rendering, and alerts.
* Optimized for performance and reliability on all timeframes.
Ideal for traders who use session activity in their strategies — especially in Forex, crypto, and futures markets.

Session-Based Sentiment Oscillator [TradeDots]Track, analyze, and monitor market sentiment across global trading sessions with this advanced multi-session sentiment analysis tool. This script provides session-specific sentiment readings for Asian (Tokyo), European (London), and US (New York) markets, combining price action, volume analysis, and volatility factors into a comprehensive sentiment oscillator. It is an original indicator designed to help traders understand regional market psychology and capitalize on cross-session sentiment shifts directly on TradingView.
📝 HOW IT WORKS
1. Multi-Component Sentiment Engine
Price Action Momentum : Calculates normalized price movement relative to recent trading ranges, providing directional sentiment readings.
Volume-Weighted Analysis : When volume data is available, incorporates volume flow direction to validate price-based sentiment signals.
Volatility-Adjusted Factors : Accounts for changing market volatility conditions by comparing current ATR against historical averages.
Weighted Combination : Merges all components using optimized weightings (Price: 1.0, Volume: 0.3, Volatility: 0.2) for balanced sentiment readings.
2. Session-Segregated Tracking
Automatic Session Detection : Precisely identifies active trading sessions based on user-configured time parameters.
Independent Calculations : Maintains separate sentiment accumulation for each major session, updated only during respective active hours.
Historical Preservation : Stores session-specific sentiment values even when sessions are closed, enabling cross-session comparison.
Real-Time Updates : Continuously processes sentiment during active sessions while preserving inactive session data.
3. Cross-Session Transition Analysis
Sentiment Differential Detection : Monitors sentiment changes when transitioning between trading sessions.
Configurable Thresholds : Generates signals only when sentiment shifts exceed user-defined minimum thresholds.
Directional Signals : Provides distinct bullish and bearish transition alerts with visual markers.
Smart Filtering : Applies smoothing algorithms to reduce false signals from minor sentiment variations.
⚙️ KEY FEATURES
1. Session-Specific Dashboard
Real-Time Status Display : Shows current session activity (ACTIVE/CLOSED) for all three major sessions.
Sentiment Percentages : Displays precise sentiment readings as percentages for easy interpretation.
Strength Classification : Automatically categorizes sentiment as HIGH (>50%), MEDIUM (20-50%), or LOW (<20%).
Customizable Positioning : Place dashboard in any corner with adjustable size options.
2. Advanced Signal Generation
Transition Alerts : Triangle markers indicate significant sentiment shifts between sessions.
Extreme Conditions : Diamond markers highlight overbought/oversold threshold breaches.
Configurable Sensitivity : Adjust signal thresholds from 0.05 to 0.50 based on trading style.
Alert Integration : Built-in TradingView alert conditions for automated notifications.
3. Forex Currency Strength Analysis
Base/Quote Decomposition : For forex pairs, separates sentiment into individual currency strength components.
Major Currency Support : Analyzes USD, EUR, GBP, JPY, CHF, CAD, AUD, NZD strength relationships.
Relative Strength Display : Shows which currency is driving pair movement during active sessions.
4. Visual Enhancement System
Session Background Colors : Distinct background shading for each active trading session.
Overbought/Oversold Zones : Configurable extreme sentiment level visualization with colored zones.
Multi-Timeframe Compatibility : Works across all timeframes while maintaining session accuracy.
Customizable Color Schemes : Full color customization for dashboard, signals, and plot elements.
🚀 HOW TO USE IT
1. Add the Script
Search for "Session-Based Sentiment Oscillator " in the Indicators tab or manually add it to your chart. The indicator will appear in a separate pane below your main chart.
2. Configure Session Times
Asian Session : Set Tokyo market hours (default: 00:00-09:00) based on your chart timezone.
European Session : Configure London market hours (default: 07:00-16:00) for European analysis.
US Session : Define New York market hours (default: 13:00-22:00) for American markets.
Timezone Adjustment : Ensure session times match your broker's specifications and account for daylight saving changes.
3. Optimize Analysis Parameters
Sentiment Period : Choose 5-50 bars (default: 14) for sentiment calculation lookback period.
Smoothing Settings : Select 1-10 bars smoothing (default: 3) with SMA, EMA, or RMA options.
Component Selection : Enable/disable volume analysis, price action, and volatility factors based on available data.
Signal Sensitivity : Adjust threshold from 0.05-0.50 (default: 0.15) for transition signal generation.
4. Interpret Readings and Signals
Positive Values : Indicate bullish sentiment for the active session.
Negative Values : Suggest bearish sentiment conditions.
Dashboard Status : Monitor which session is currently active and their respective sentiment strengths.
Transition Signals : Watch for triangle markers indicating significant cross-session sentiment changes.
Extreme Alerts : Note diamond markers when sentiment reaches overbought (>70%) or oversold (<-70%) levels.
5. Set Up Alerts
Configure TradingView alerts for:
- Bullish session transitions
- Bearish session transitions
- Overbought condition alerts
- Oversold condition alerts
❗️LIMITATIONS
1. Data Dependency
Volume Requirements : Volume-based analysis only functions when volume data is provided by your broker. Many forex brokers do not supply reliable volume data.
Price Action Focus : In absence of volume data, sentiment calculations rely primarily on price movement and volatility factors.
2. Session Time Sensitivity
Manual Adjustment Required : Session times must be manually updated for daylight saving time changes.
Broker Variations : Different brokers may have slightly different session definitions requiring time parameter adjustments.
3. Ranging Market Limitations
Trend Bias : Sentiment calculations may be less reliable during extended sideways or low-volatility market conditions.
Lag Consideration : As with all sentiment indicators, readings may lag during rapid market transitions.
4. Regional Market Focus
Major Session Coverage : Designed primarily for major global sessions; may not capture sentiment from smaller regional markets.
Weekend Gaps : Does not account for weekend gap effects on sentiment calculations.
⚠️ RISK DISCLAIMER
Trading and investing carry significant risk and can result in financial loss. The "Session-Based Sentiment Oscillator " is provided for informational and educational purposes only. It does not constitute financial advice.
- Always conduct your own research and analysis
- Use proper risk management and position sizing in all trades
- Past sentiment patterns do not guarantee future market behavior
- Combine this indicator with other technical and fundamental analysis tools
- Consider overall market context and your personal risk tolerance
This script is an original creation by TradeDots, published under the Mozilla Public License 2.0.
Session-based sentiment analysis should be used as part of a comprehensive trading strategy. No single indicator can predict market movements with certainty. Exercise proper risk management and maintain realistic expectations about indicator performance across varying market conditions.
