CMOav Strategy This indicator plots average of three different length CMO's. This indicator
was developed by Tushar Chande. A scientist, an inventor, and a respected
trading system developer, Mr. Chande developed the CMO to capture what he
calls "pure momentum". For more definitive information on the CMO and other
indicators we recommend the book The New Technical Trader by Tushar Chande
and Stanley Kroll.
The CMO is closely related to, yet unique from, other momentum oriented
indicators such as Relative Strength Index, Stochastic, Rate-of-Change, etc.
It is most closely related to Welles Wilder?s RSI, yet it differs in several ways:
- It uses data for both up days and down days in the numerator, thereby directly
measuring momentum;
- The calculations are applied on unsmoothed data. Therefore, short-term extreme
movements in price are not hidden. Once calculated, smoothing can be applied to
the CMO, if desired;
- The scale is bounded between +100 and -100, thereby allowing you to clearly see
changes in net momentum using the 0 level. The bounded scale also allows you to
conveniently compare values across different securities.
Strategy


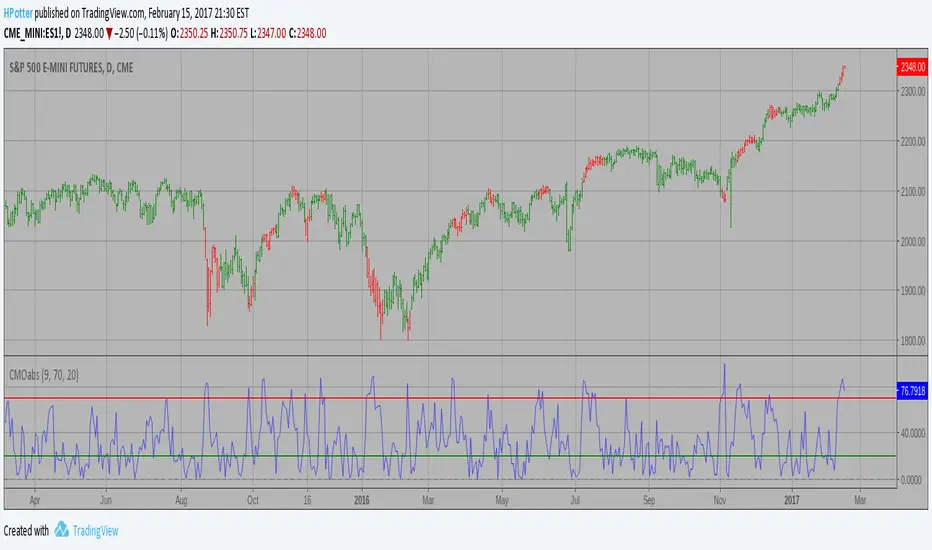
CMOabs Strategy// This indicator plots the absolute value of CMO. CMO was developed by Tushar
Chande. A scientist, an inventor, and a respected trading system developer,
Mr. Chande developed the CMO to capture what he calls "pure momentum". For
more definitive information on the CMO and other indicators we recommend the
book The New Technical Trader by Tushar Chande and Stanley Kroll.
The CMO is closely related to, yet unique from, other momentum oriented indicators
such as Relative Strength Index, Stochastic, Rate-of-Change, etc. It is most closely
related to Welles Wilder`s RSI, yet it differs in several ways:
- It uses data for both up days and down days in the numerator, thereby directly
measuring momentum;
- The calculations are applied on unsmoothed data. Therefore, short-term extreme
movements in price are not hidden. Once calculated, smoothing can be applied to
the CMO, if desired;
- The scale is bounded between +100 and -100, thereby allowing you to clearly see
changes in net momentum using the 0 level. The bounded scale also allows you to
conveniently compare values across different securities.
FLD - Future Lines of Demarcation Strategy An FLD is a line that is plotted on the same scale as the price and is in fact the
price itself displaced to the right (into the future) by (approximately) half the
wavelength of the cycle for which the FLD is plotted. There are three FLD's that can be
plotted for each cycle:
An FLD based on the median price.
An FLD based on the high price.
An FLD based on the low price.

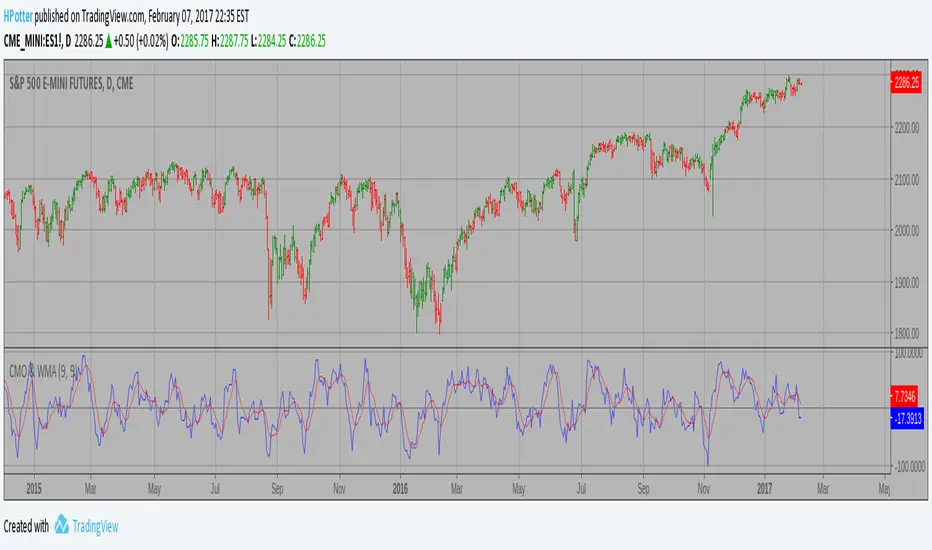
CMO & WMA Strategy This indicator plots Chande Momentum Oscillator and its WMA on the
same chart. This indicator plots the absolute value of CMO.
The CMO is closely related to, yet unique from, other momentum oriented
indicators such as Relative Strength Index, Stochastic, Rate-of-Change,
etc. It is most closely related to Welles Wilder?s RSI, yet it differs
in several ways:
- It uses data for both up days and down days in the numerator, thereby
directly measuring momentum;
- The calculations are applied on unsmoothed data. Therefore, short-term
extreme movements in price are not hidden. Once calculated, smoothing
can be applied to the CMO, if desired;
- The scale is bounded between +100 and -100, thereby allowing you to clearly
see changes in net momentum using the 0 level. The bounded scale also allows
you to conveniently compare values across different securities.
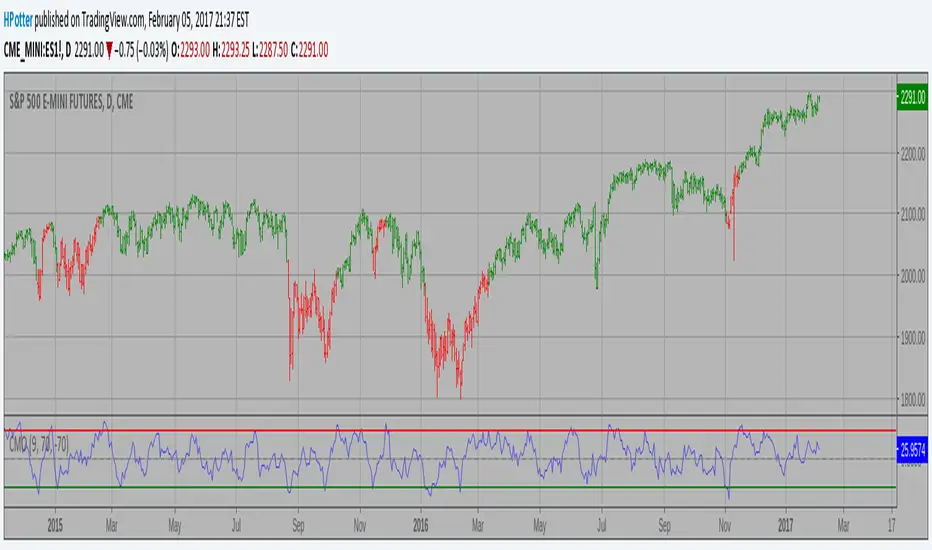
CMO (Chande Momentum Oscillator) Strategy This indicator plots Chande Momentum Oscillator. This indicator was
developed by Tushar Chande. A scientist, an inventor, and a respected
trading system developer, Mr. Chande developed the CMO to capture what
he calls "pure momentum". For more definitive information on the CMO and
other indicators we recommend the book The New Technical Trader by Tushar
Chande and Stanley Kroll.
The CMO is closely related to, yet unique from, other momentum oriented
indicators such as Relative Strength Index, Stochastic, Rate-of-Change,
etc. It is most closely related to Welles Wilder`s RSI, yet it differs
in several ways:
- It uses data for both up days and down days in the numerator, thereby
directly measuring momentum;
- The calculations are applied on unsmoothed data. Therefore, short-term
extreme movements in price are not hidden. Once calculated, smoothing
can be applied to the CMO, if desired;
- The scale is bounded between +100 and -100, thereby allowing you to
clearly see changes in net momentum using the 0 level. The bounded scale
also allows you to conveniently compare values across different securities.
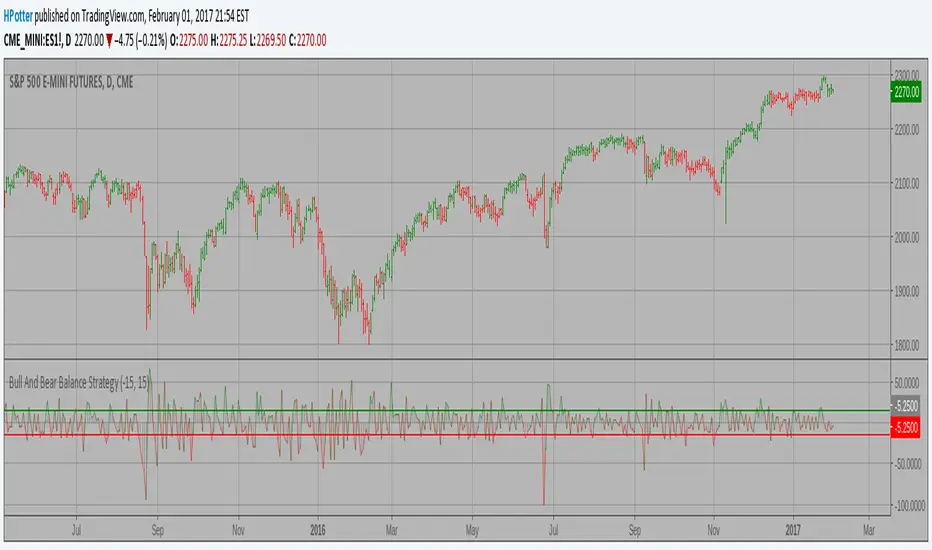
Bull And Bear Balance Strategy This new indicator analyzes the balance between bullish and
bearish sentiment.
One can cay that it is an improved analogue of Elder Ray indicator.
To get more information please see "Bull And Bear Balance Indicator"
by Vadim Gimelfarb.
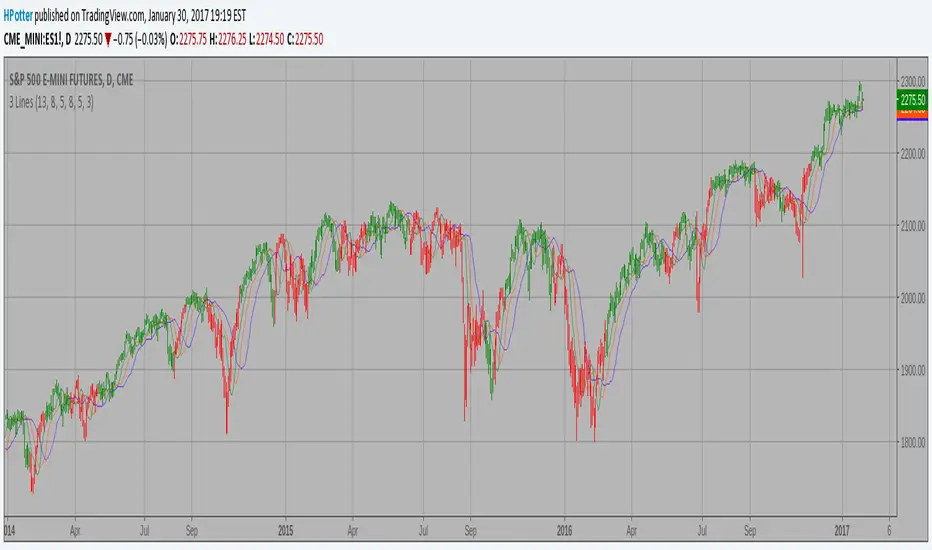
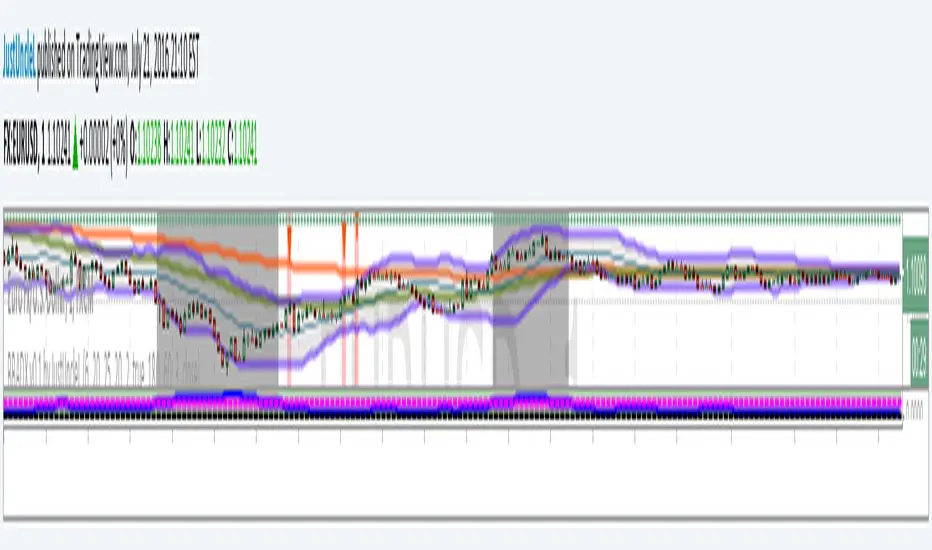
Bill Williams Averages. 3Lines Strategy This indicator calculates 3 Moving Averages for default values of
13, 8 and 5 days, with displacement 8, 5 and 3 days: Median Price (High+Low/2).
The most popular method of interpreting a moving average is to compare
the relationship between a moving average of the security's price with
the security's price itself (or between several moving averages).
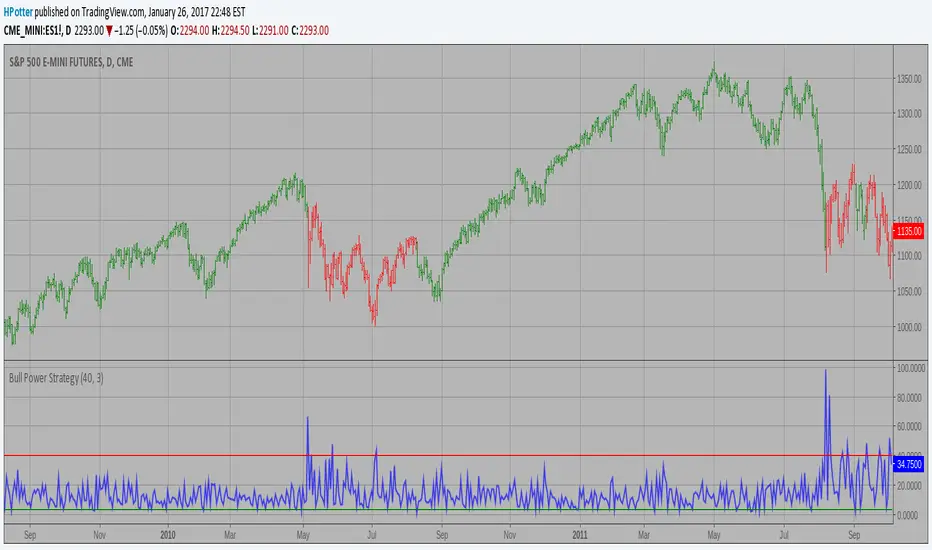
Bull Power Strategy Bull Power Indicator
To get more information please see "Bull And Bear Balance Indicator"
by Vadim Gimelfarb.
Bear Power Strategy Bear Power Strategy
To get more information please see "Bull And Bear Balance Indicator"
by Vadim Gimelfarb.


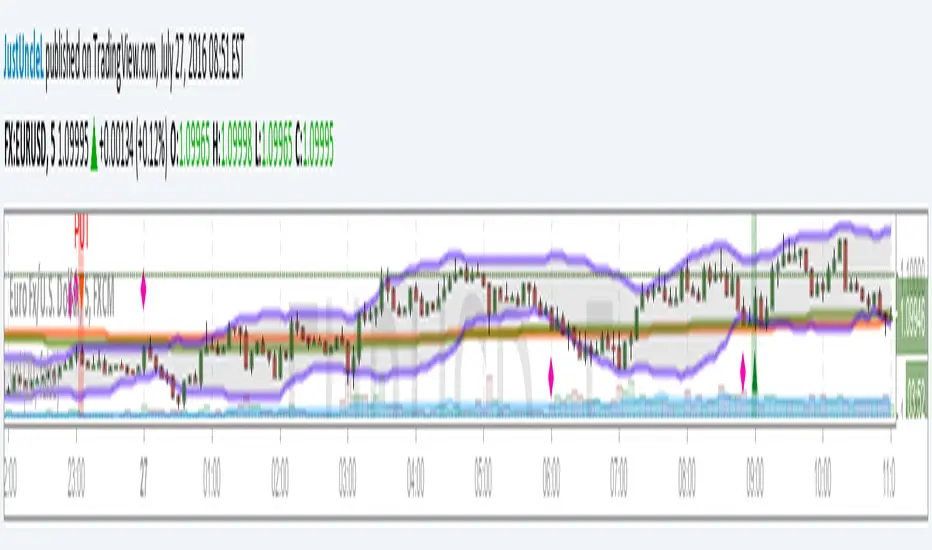
Bollinger Band and Moving Average v0.1 by JustUncleLThis is another Bollinger Band strategy+indicator in my series of Bollinger based setups. This one is seems to work best with 5min charts and 20 to 30min expiry. The strategy follows variation of a Bollinger band + Moving Averages
reversal strategy, it uses the 2 moving averages mainly to determine market direction.
Bollinger Band and ADX Retrace Alert v0.1 by JustUncleLThis script is an implementation of a well known Bollinger band + ADX retracement strategy for 1min to 15min charts. This variation uses my own settings, a market direction filter and has an alert that can be added to your trading alarms.
Chinkou_ProWelcome traders,
I have made this script wishing a higher gain,
Originally, this strategy is taken from Ichimoku Kinko Hyo
Simply:
ChinkouPro crossing with price is giving a clear opportunity.
Review it, master it, work it.
first version
change log
Delete function of lazy trader { smooth candle }
Delete function of alert , { make alert from chart it's better }
Enjoy with it , and contact me for any reason :)

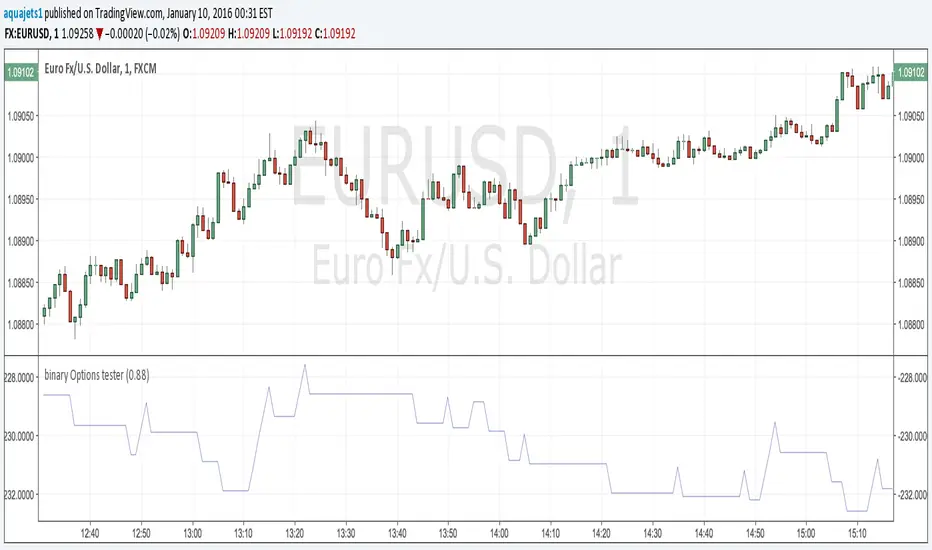
Binary Options Strategy Testing ScriptThis is a script for testing binary options trading strategies. To test a strategy, modify the 'go_down' or 'go_up' booleans. These SHOULD NOT access any current values (for example, 'ohlc4' or 'close '), or the backtesting will not be an accurate representation of the forward values.
Modify the fraction_return input to be the return rate of the option on success. This is assumed to be a true 100 or 0 option- i.e. if the choice is not correct, there is a 100% loss.
The strategy in place is merely an example, and as you can see, has a very negative rate of return when implemented as a strategy.
Please comment in your code if you use this in any future posts. Thanks!
SP_Relative Strength IndexQuick Update to the Steve Primo RSI.
Nothing fancy, but one indicator to represent all his RSI based setups.
Primarily used on Strategy #1 and #8.

Romi Trend and Momentum Oscillator
Great oscillator which determines trend and momentum. So accurate it could be used as a stand alone indicator.

Binary option trading by two previous barsThis simple script uses the idea of inertia of the market. if 2 previous candles have the same color, current meant to have that too. Following this signal is equal to buying a binary option on the start of the bar (week here). Signals are shown as arrows on the series. The color of the bar shows the outcome of the current option: yellow is success, black is failure. The same outcomes are at the bottom of the chart. The blue line is the total revenue of all options so far. Can be used as template for strategy simulation.

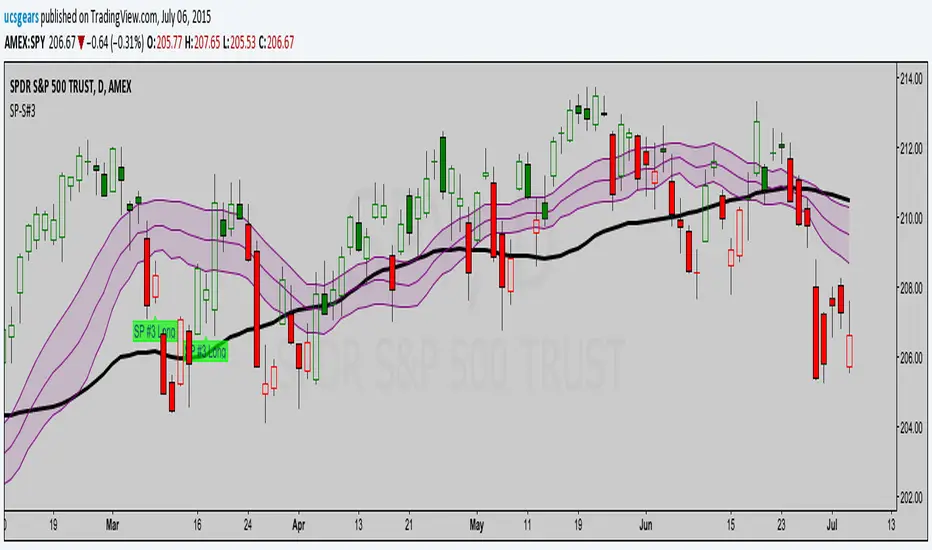
UCS_S_Steve Primo - Strategy 3Here is the code for Steve Primo Strategy #1 - Setup Long and Short
- Please refer to his videos for triggers and management.
Share your views.
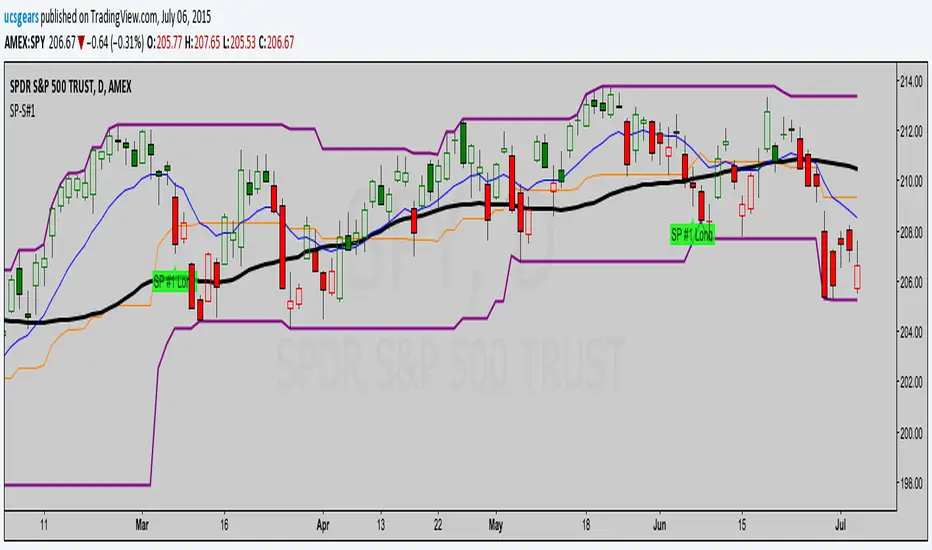
UCS_S_Steve Primo - Strategy 1Here is the code for Steve Primo Strategy #1 Long and Short Setups.
- Post your views and share the knowledge.
Watch his free videos on youtube for trigger and trade management
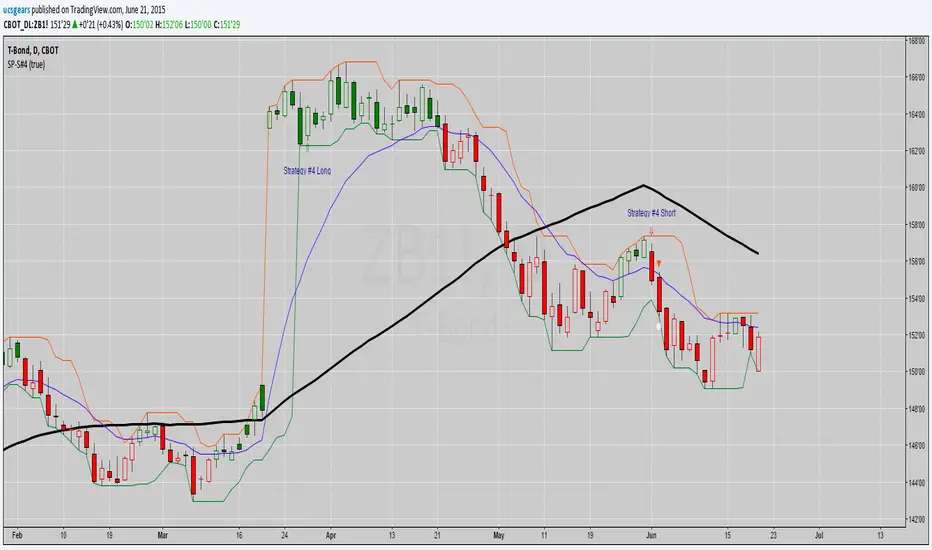
UCS_S_Steve Primo - Strategy 4 - Version 2For those who are interested with this strategy, Here is a better version.
Naked Forex Trading StrategyBased on "How Naked Trading Works" video by Walter Peters: youtu.be I don't know this person and I am in no way affiliated with him. I just found his video interesting enough to make this into a script.
Rules as described by Walter in his video:
1. if current candle makes a higher high than the previous one
2. and is a bearish engulfing candle
3. and has room to the left
4. and is the largest candle (high - low) compared to the last 7-10 previous ones
Then open trade on the next candle once it breaks bearish engulfing candle's low and take profit close above previous support. Stop loss goes a few pips above bearish engulfing candle high
Do the opposite on a bullish engulfing candle signal.
Works best on 1H, 4H and 1D timeframes.
I haven't done any extensive backtesting on this, but it looks like it gives pretty good signals:

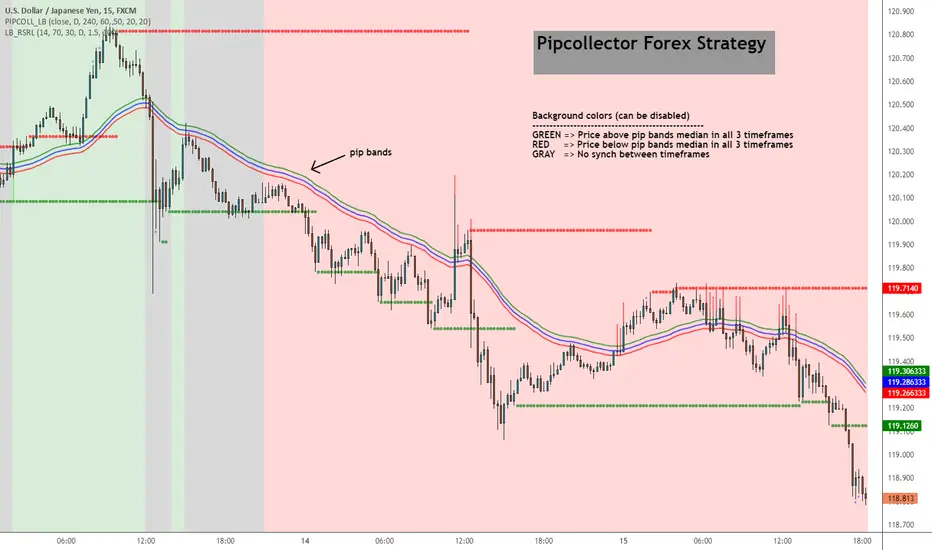
Pip collector [LazyBear]A simple but effective Forex strategy requested by user @pipcollector.
Suggested chart timeframe is 5mins.
Indicator marks potential long/short entries based on the following conditions:
LONG
------
Price above pip median ema on daily, 4 hour and 1 hour timeframe. These 3 timeframes and median EMA lengths are configurable.
Background color is set to GREEN (if option is enabled).
As soon as price touches or crosses the median ema, a GREEN arrow is shown to mark potential long.
SHORT
------
Price below pip median ema on daily, 4 hour and 1 hour timeframe. These 3 timeframes and median EMA lengths are configurable.
Background color is set to RED (if option is enabled).
As soon as price touches or crosses the median ema, a RED arrow is shown to mark potential short.
NO SETUP
-----------
Moving averages do not align on the 3 timeframes.
Background color is set to GRAY (if option is enabled)
I have noticed that this works well on other instruments too (anything trending), also on higher time frames. Feel free to leave any questions/comments on this below.
List of my public indicators: bit.ly
List of my app-store indicators: blog.tradingview.com