Trend Zone Moving Averages📈 Trend Zone Moving Averages
The Trend Zone Moving Averages indicator helps traders quickly identify market trends using the 50SMA, 100SMA, and 200SMA. With dynamic background colors, customizable settings, and real-time alerts, this tool provides a clear view of bullish, bearish, and extreme trend conditions.
🔹 Features:
Trend Zones with Dynamic Background Colors
Green → Bullish Trend (50SMA > 100SMA > 200SMA, price above 50SMA)
Red → Bearish Trend (50SMA < 100SMA < 200SMA, price below 50SMA)
Yellow → Neutral Trend (Mixed signals)
Dark Green → Extreme Bullish (Price above all three SMAs)
Dark Red → Extreme Bearish (Price below all three SMAs)
Customizable Moving Averages
Toggle 50SMA, 100SMA, and 200SMA on/off from the settings.
Perfect for traders who prefer a cleaner chart.
Real-Time Trend Alerts
Get instant notifications when the trend changes:
🟢 Bullish Zone Alert – When price enters a bullish trend.
🔴 Bearish Zone Alert – When price enters a bearish trend.
🟡 Neutral Zone Alert – When trend shifts to neutral.
🌟 Extreme Bullish Alert – When price moves above all SMAs.
⚠️ Extreme Bearish Alert – When price drops below all SMAs.
✅ Perfect for Any Market
Works on stocks, forex, crypto, and commodities.
Adaptable for day traders, swing traders, and investors.
⚙️ How to Use: Trend Zone Moving Averages Strategy
This strategy helps traders identify and trade with the trend using the Trend Zone Moving Averages indicator. It works across stocks, forex, crypto, and commodities.
🟢 Bullish Trend Strategy (Green Background)
Objective: Look for buying opportunities when the market is in an uptrend.
Entry Conditions:
✅ Background is Green (Bullish Zone).
✅ Price is above the 50SMA (confirming strength).
✅ Price pulls back to the 50SMA and bounces OR breaks above a key resistance level.
Stop Loss:
🔹 Place below the most recent swing low or just under the 50SMA.
Take Profit:
🔹 First target at the next resistance level or recent swing high.
🔹 Second target if price continues higher—trail stops to lock in profits.
🔴 Bearish Trend Strategy (Red Background)
Objective: Look for shorting opportunities when the market is in a downtrend.
Entry Conditions:
✅ Background is Red (Bearish Zone).
✅ Price is below the 50SMA (confirming weakness).
✅ Price pulls back to the 50SMA and rejects OR breaks below a key support level.
Stop Loss:
🔹 Place above the most recent swing high or just above the 50SMA.
Take Profit:
🔹 First target at the next support level or recent swing low.
🔹 Second target if price keeps falling—trail stops to secure profits.
🌟 Extreme Trend Strategy (Dark Green / Dark Red Background)
Objective: Trade with momentum when the market is in a strong trend.
Entry Conditions:
✅ Dark Green Background → Extreme Bullish: Price is above all three SMAs (strong uptrend).
✅ Dark Red Background → Extreme Bearish: Price is below all three SMAs (strong downtrend).
Trade Execution:
🔹 For longs (Dark Green): Look for breakout entries above resistance or pullbacks to the 50SMA.
🔹 For shorts (Dark Red): Look for breakdown entries below support or rejections at the 50SMA.
Risk Management:
🔹 Use tighter stop losses and trail profits aggressively to maximize gains.
🟡 Neutral Trend Strategy (Yellow Background)
Objective: Avoid trading or wait for a breakout.
What to Do:
🔹 Avoid trading in this zone—price is indecisive.
🔹 Wait for confirmation (background turns green/red) before taking a trade.
🔹 Use alerts to notify you when the trend resumes.
📌 Final Tips
Use this strategy with price action for extra confirmation.
Combine with support/resistance levels to improve accuracy.
Set alerts for trend changes so you never miss an opportunity.
Enjoy!
Trend

Gradient Trend Filter STRATEGY [ChartPrime/PineIndicators]This strategy is based on the Gradient Trend Filter indicator developed by ChartPrime. Full credit for the concept and indicator goes to ChartPrime.
The Gradient Trend Filter Strategy is designed to execute trades based on the trend analysis and filtering system provided by the Gradient Trend Filter indicator. It integrates a noise-filtered trend detection system with a color-gradient visualization, helping traders identify trend strength, momentum shifts, and potential reversals.
How the Gradient Trend Filter Strategy Works
1. Noise Filtering for Smoother Trends
To reduce false signals caused by market noise, the strategy applies a three-stage smoothing function to the source price. This function ensures that trend shifts are detected more accurately, minimizing unnecessary trade entries and exits.
The filter is based on an Exponential Moving Average (EMA)-style smoothing technique.
It processes price data in three successive passes, refining the trend signal before generating trade entries.
This filtering technique helps eliminate minor fluctuations and highlights the true underlying trend.
2. Multi-Layered Trend Bands & Color-Based Trend Visualization
The Gradient Trend Filter constructs multiple trend bands around the filtered trend line, acting as dynamic support and resistance zones.
The mid-line changes color based on the trend direction:
Green for uptrends
Red for downtrends
A gradient cloud is formed around the trend line, dynamically shifting colors to provide early warning signals of trend reversals.
The outer bands function as potential support and resistance, helping traders determine stop-loss and take-profit zones.
Visualization elements used in this strategy:
Trend Filter Line → Changes color between green (bullish) and red (bearish).
Trend Cloud → Dynamically adjusts color based on trend strength.
Orange Markers → Appear when a trend shift is confirmed.
Trade Entry & Exit Conditions
This strategy automatically enters trades based on confirmed trend shifts detected by the Gradient Trend Filter.
1. Trade Entry Rules
Long Entry:
A bullish trend shift is detected (trend direction changes to green).
The filtered trend value crosses above zero, confirming upward momentum.
The strategy enters a long position.
Short Entry:
A bearish trend shift is detected (trend direction changes to red).
The filtered trend value crosses below zero, confirming downward momentum.
The strategy enters a short position.
2. Trade Exit Rules
Closing a Long Position:
If a bearish trend shift occurs, the strategy closes the long position.
Closing a Short Position:
If a bullish trend shift occurs, the strategy closes the short position.
The trend shift markers (orange diamonds) act as a confirmation signal, reinforcing the validity of trade entries and exits.
Customization Options
This strategy allows traders to adjust key parameters for flexibility in different market conditions:
Trade Direction: Choose between Long Only, Short Only, or Long & Short .
Trend Length: Modify the length of the smoothing function to adapt to different timeframes.
Line Width & Colors: Customize the visual appearance of trend lines and cloud colors.
Performance Table: Enable or disable the equity performance table that tracks historical trade results.
Performance Tracking & Reporting
A built-in performance table is included to monitor monthly and yearly trading performance.
The table calculates monthly percentage returns, displaying them in a structured format.
Color-coded values highlight profitable months (blue) and losing months (red).
Tracks yearly cumulative performance to assess long-term strategy effectiveness.
Traders can use this feature to evaluate historical performance trends and optimize their strategy settings accordingly.
How to Use This Strategy
Identify Trend Strength & Reversals:
Use the trend line and cloud color changes to assess trend strength and detect potential reversals.
Monitor Momentum Shifts:
Pay attention to gradient cloud color shifts, as they often appear before the trend line changes color.
This can indicate early momentum weakening or strengthening.
Act on Trend Shift Markers:
Use orange diamonds as confirmation signals for trend shifts and trade entry/exit points.
Utilize Cloud Bands as Support/Resistance:
The outer bands of the cloud serve as dynamic support and resistance, helping with stop-loss and take-profit placement.
Considerations & Limitations
Trend Lag: Since the strategy applies a smoothing function, entries may be slightly delayed compared to raw price action.
Volatile Market Conditions: In high-volatility markets, trend shifts may occur more frequently, leading to higher trade frequency.
Optimized for Trend Trading: This strategy is best suited for trending markets and may produce false signals in sideways (ranging) conditions.
Conclusion
The Gradient Trend Filter Strategy is a trend-following system based on the Gradient Trend Filter indicator by ChartPrime. It integrates noise filtering, trend visualization, and gradient-based color shifts to help traders identify strong market trends and potential reversals.
By combining trend filtering with a multi-layered cloud system, the strategy provides clear trade signals while minimizing noise. Traders can use this strategy for long-term trend trading, momentum shifts, and support/resistance-based decision-making.
This strategy is a fully automated system that allows traders to execute long, short, or both directions, with customizable settings to adapt to different market conditions.
Credit for the original concept and indicator goes to ChartPrime.

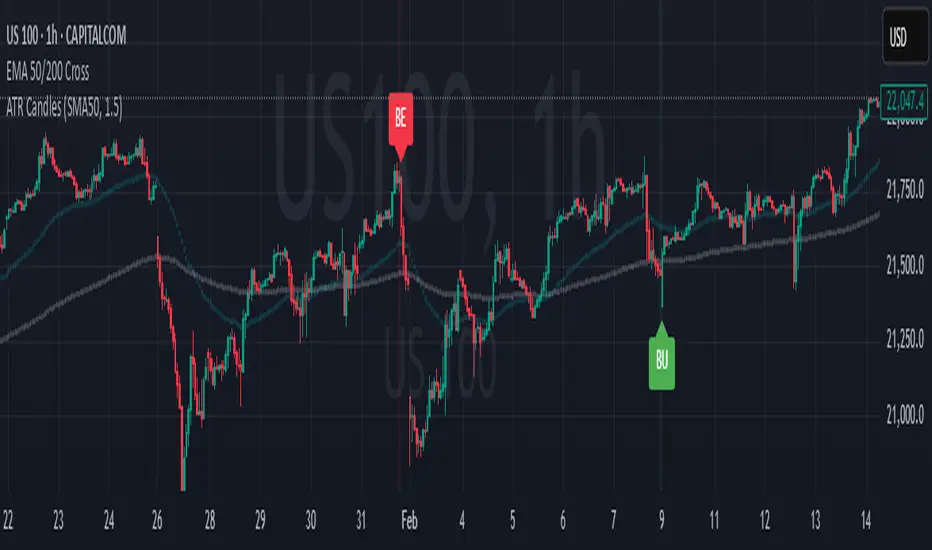
Engulfing Candles (ATR-Based)This indicator detects Engulfing Patterns with an ATR-based filtering mechanism and trend confirmation. Unlike a basic engulfing pattern indicator that only checks if a current candle engulfs the previous one, this script incorporates trend detection using either the 50-period SMA alone or a combination of 50 and 200-period SMAs to ensure that signals align with the broader trend. The indicator identifies Bullish Engulfing patterns when a strong bullish candle engulfs a smaller bearish candle in a downtrend and Bearish Engulfing patterns when a strong bearish candle engulfs a smaller bullish candle in an uptrend. It also generates alerts and visually marks these patterns with labels ("BU" for bullish and "BE" for bearish) while highlighting the background accordingly.
What sets this indicator apart from a normal engulfing indicator is its ATR-based filtering system, which ensures that only significant engulfing candles are considered. Instead of accepting any engulfing pattern, the script measures candle body size relative to 1.5x ATR (configurable) to filter out weak signals. It also differentiates between long-bodied and small-bodied candles to confirm that the engulfing pattern represents real momentum shifts. This approach reduces false signals caused by small, insignificant candles and ensures that traders focus on high-probability reversal patterns. By integrating trend-based filtering and ATR-based confirmation, this indicator provides more reliable and context-aware engulfing signals than a standard engulfing pattern detector.
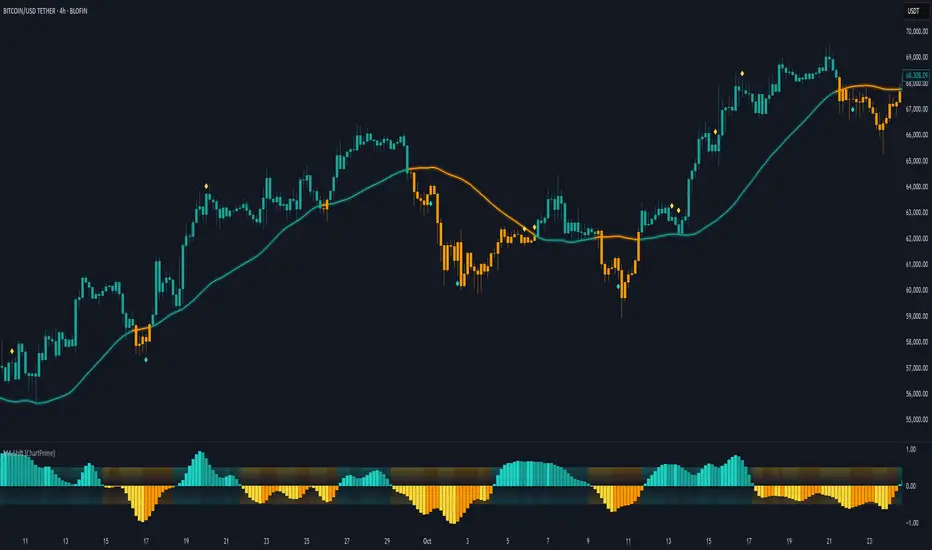
Moving Average Shift [ChartPrime]Moving Average Shift indicator combines multiple moving average (MA) types with a unique MA Shift Oscillator to help traders visualize trend direction, price deviations, and mean reversion states.
⯁ KEY FEATURES
Customizable Moving Averages: Choose from SMA, EMA, SMMA (RMA), WMA, or VWMA.
Trend-Based Coloring: Candles are dynamically colored based on price position relative to the MA.
MA Shift Oscillator: Identifies price deviations and potential mean reversion zones.
Threshold Filtering: Helps filter mean reversion signals using a user-defined threshold.
Diamond Signals for Mean Reversion: Plots diamonds on the chart when the oscillator crosses back above or below the threshold level.
Oscillator Color Coding: The oscillator has four color states:
Color 1: Above 0 and increasing.
Color 2: Above 0 and decreasing.
Color 3: Below 0 and increasing.
Color 4: Below 0 and decreasing.
⯁ HOW TO USE
Use the indicator to follow the trend based on MA direction and price relation to it.
The MA Shift Oscillator helps identify potential mean reversion points where price may revert toward the MA.
The threshold setting allows traders to filter out weak mean reversion signals and focus on significant shifts.
The four-color oscillator visually indicates trend momentum and potential trend shifts.
⯁ CONCLUSION
The Moving Average Shift indicator is a powerful tool that merges trend-following and mean reversion strategies into one comprehensive system. By allowing traders to select different types of moving averages, it provides flexibility in trend analysis while visually enhancing price action with dynamic candle coloring. The MA Shift Oscillator further strengthens decision-making by detecting deviations and highlighting potential mean reversion points.
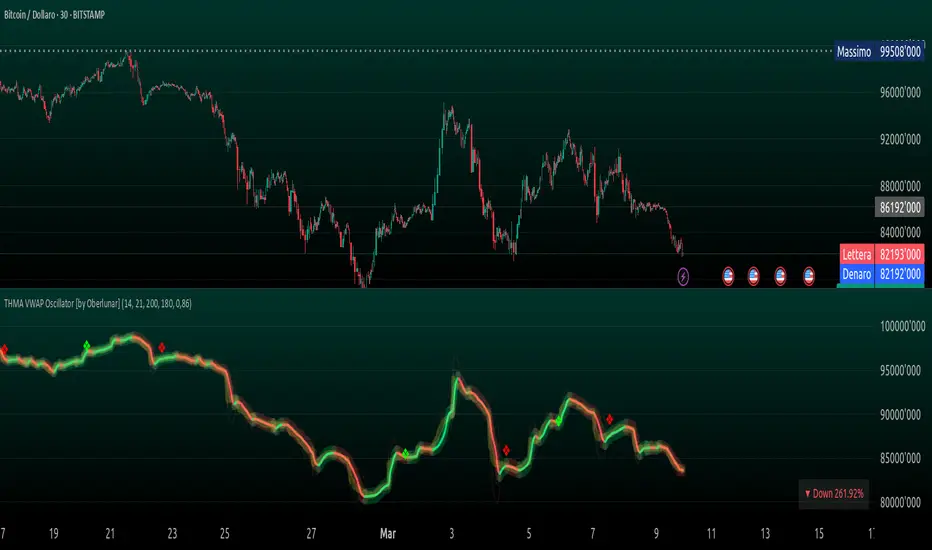
THMA VWAP Oscillator [by Oberlunar]The THMA VWAP Oscillator of Oberlunar is a trend-following and liquidity-sensitive indicator that blends the Triple Hull Moving Average (THMA) with Volume Weighted Average Price (VWAP) deviation bands to highlight high-probability trading setups. It helps traders differentiate between healthy momentum moves and market noise , making it an effective tool for spotting trend continuations, reversals, and mean reversion trades .
At its core, the THMA is an advanced moving average that smooths price action while minimizing lag. Unlike conventional moving averages that react slowly, the THMA dynamically adapts to market conditions by applying a weighted smoothing process. This allows it to react more efficiently to momentum shifts , making it ideal for trend-following and breakout strategies .
The VWAP acts as a volume-weighted price equilibrium, giving traders a framework for understanding institutional positioning. Since VWAP considers both price and volume , it helps determine whether the market is trading at a premium or a discount relative to where most of the volume has transacted. The inclusion of VWAP deviation bands , derived from standard deviations, enhances the ability to detect overbought and oversold conditions , ensuring that signals align with key liquidity levels.
The indicator generates buy and sell signals based on a structured methodology that incorporates trend direction, liquidity positioning, and momentum confirmation . A buy signal is triggered when the THMA on a higher timeframe is positioned below the THMA of the current timeframe, indicating that the broader trend is supportive of an upward move. Additionally, the THMA must be trading below the lower VWAP deviation band , suggesting that price is in a discounted liquidity zone, which is often an area where institutional buyers step in. To ensure that the signal is not just a random fluctuation, the THMA must also show positive slope , meaning it is actively rising, confirming that price is attempting to reverse or continue its upward move with strength.
A sell signal follows the same logic in reverse. The THMA on a higher timeframe must be above the THMA of the current timeframe, confirming alignment with a broader downtrend. The THMA must also be positioned above the upper VWAP deviation band , signaling that price is extended and potentially due for a reversal. To validate that the momentum is actually weakening, the THMA must be in a declining slope , ensuring that price is not simply pausing but actually entering a phase of downward acceleration.
One of the key nuances of the THMA VWAP Oscillator is how it visually represents momentum through the serpentine line , which dynamically shifts color as it develops. When the serpentine line maintains a consistent color—green in an uptrend or red in a downtrend—it signals strong trend conviction . However, when the color fluctuates rapidly between green and red, it indicates a weakening signal , suggesting that price action is becoming choppy and trend strength is deteriorating. This alternation in color serves as an early warning of potential reversals, false breakouts, or trend exhaustion. Traders should be cautious when signals appear in conjunction with an unstable serpentine, as they are less likely to be reliable in such conditions.
To further enhance signal quality, the indicator incorporates a signal alternation mechanism , ensuring that consecutive buy or sell signals do not appear unless the previous trade setup has been invalidated. This helps prevent overtrading in consolidating markets and reduces the chances of chasing false breakouts. Additionally, the placement of buy and sell labels is optimized using ATR-based scaling , positioning them strategically above or below price action to maintain chart clarity without interfering with live price movements.
By integrating trend structure, liquidity positioning, and signal validation , the THMA VWAP Oscillator provides a structured approach to trade execution. It is particularly effective for traders looking to capture breakout moves, pullback entries, and mean reversion opportunities , as it ensures that entries are aligned with market momentum, institutional positioning, and price equilibrium dynamics . The ability to filter out weak signals while identifying strong momentum trends makes it an indispensable tool for trend-followers, breakout traders, and mean reversion specialists alike .
I am very pleased to share that I am publicly releasing one of my private indicators, which I usually provide exclusively to my community. This is a significant moment for me, as this tool has been carefully refined and tested to offer high-quality trading insights.
I also want to take this opportunity to thank my entire community for the incredible support I have received over the past few months. Your feedback, engagement, and enthusiasm continue to inspire me, and I truly appreciate being part of this journey with all of you.
Stay tuned for more updates, and as always, trade smart! 🚀
Long-Only MTF EMA Cloud StrategyOverview:
The Long-Only EMA Cloud Strategy is a powerful trend-following strategy designed to help traders identify and capitalize on bullish market conditions. By utilizing an Exponential Moving Average (EMA) Cloud, this strategy provides clear and reliable signals for entering long positions when the market trend is favorable. The EMA cloud acts as a visual representation of the trend, making it easier for traders to make informed decisions. This strategy is ideal for traders who prefer to trade in the direction of the trend and focus exclusively on long positions.
Key Features:
EMA Cloud:
The strategy uses two EMAs (short and long) to create a dynamic cloud.
The cloud is bullish when the short EMA is above the long EMA, indicating a strong upward trend.
The cloud is bearish when the short EMA is below the long EMA, indicating a downward trend or consolidation.
Long Entry Signals:
A long position is opened when the EMA cloud turns bullish, which occurs when the short EMA crosses above the long EMA.
This crossover signals a potential shift in market sentiment from bearish to bullish, providing an opportunity to enter a long trade.
Adjustable Timeframe:
The EMA cloud can be calculated on the same timeframe as the chart or on a higher/lower timeframe for multi-timeframe analysis.
This flexibility allows traders to adapt the strategy to their preferred trading style and time horizon.
Risk Management:
The strategy includes adjustable stop loss and take profit levels to help traders manage risk and lock in profits.
Stop loss and take profit levels are calculated as a percentage of the entry price, ensuring consistency across different assets and market conditions.
Alerts:
Built-in alerts notify you when a long entry signal is generated, ensuring you never miss a trading opportunity.
Alerts can be customized to suit your preferences, providing real-time notifications for potential trades.
Visualization:
The EMA cloud is plotted on the chart, providing a clear visual representation of the trend.
Buy signals are marked with a green label below the price bar, making it easy to identify entry points.
How to Use:
Add the Script:
Add the script to your chart in TradingView.
Set EMA Lengths:
Adjust the Short EMA Length and Long EMA Length in the settings to suit your trading style.
For example, you might use a shorter EMA (e.g., 21) for more responsive signals or a longer EMA (e.g., 50) for smoother signals.
Choose EMA Cloud Resolution:
Select the EMA Cloud Resolution (timeframe) for the cloud calculation.
You can choose the same timeframe as the chart or a different timeframe (higher or lower) for multi-timeframe analysis.
Adjust Risk Management:
Set the Stop Loss (%) and Take Profit (%) levels according to your risk tolerance and trading goals.
For example, you might use a 1% stop loss and a 2% take profit for a 1:2 risk-reward ratio.
Enable Alerts:
Enable alerts to receive notifications for long entry signals.
Alerts can be configured to send notifications via email, SMS, or other preferred methods.
Monitor and Trade:
Monitor the chart for buy signals and execute trades accordingly.
Use the EMA cloud as a visual guide to confirm the trend direction before entering a trade.
Ideal For:
Trend-Following Traders: This strategy is perfect for traders who prefer to trade in the direction of the trend and capitalize on sustained price movements.
Long-Only Traders: If you prefer to focus exclusively on long positions, this strategy provides a clear and systematic approach to identifying bullish opportunities.
Multi-Timeframe Analysts: The adjustable EMA cloud resolution allows you to analyze trends across different timeframes, making it suitable for both short-term and long-term traders.
Risk-Averse Traders: The inclusion of stop loss and take profit levels helps manage risk and protect your capital.

OBV Trend Bands [Alpha Extract]OBV Trend Bands 📊
The OBV Trend Bands indicator leverages On-Balance Volume (OBV) to assess trend strength and potential reversals by plotting a dynamic median line alongside upper and lower bands based on standard deviation. This tool helps traders identify overbought or oversold conditions and visualize OBV momentum relative to historical trends.
🔶 CALCULATION
The indicator calculates OBV, a dynamic median of OBV, and standard deviation bands to measure volume-driven momentum:
• OBV: Cumulative volume that adds or subtracts based on price direction.
• Aggregate Median: A smoothed median of OBV over a user-defined lookback period, adjusted by a minimum lookback for robustness.
• Standard Deviation Bands: Upper and lower bands derived from the scaled aggregate median, adjusted by a multiplier.
• Scaled OBV: OBV divided by a customizable scaling factor for better visualization.
Formula:
• OBV = Cumulative sum of volume (positive if price increases, negative if price decreases)
• Aggregate Median = Average of simple medians over a range from minLookbackPeriod to length
• Upper Band = Aggregate Median / Scaling Factor + StdMultiplier * StdDev
• Lower Band = Aggregate Median / Scaling Factor - StdMultiplier * StdDev
🔶 DETAILS
Visual Features:
• OBV Line (Dynamic Color): Plotted with a color that shifts based on its position—green above the upper band (bullish), red below the lower band (bearish), and white between bands (neutral).
• Upper Band (Green): Represents the overbought threshold, lightly shaded for clarity.
• Lower Band (Red): Indicates the oversold threshold, also lightly shaded.
• Aggregate Median Line (Gray): Acts as the central trend reference.
• Fill Areas: Transparent green fill when OBV exceeds the upper band, transparent red fill when below the lower band, and no fill within the bands.
Interpretation:
• Bullish Signal: OBV rises above the upper band, suggesting strong buying pressure and potential trend continuation.
• Bearish Signal: OBV falls below the lower band, indicating selling pressure and possible trend weakness.
• Neutral Zone: OBV between bands reflects consolidation or indecision in the market.
🔶 EXAMPLES
The chart demonstrates:
• Bullish Momentum: OBV crosses above the upper band with a green line and fill, signaling robust accumulation.
• Bearish Momentum: OBV drops below the lower band with a red line and fill, indicating distribution or selling pressure.
• Reversal Points: Transitions of OBV from below the lower band to above the upper band (or vice versa) suggest potential trend shifts.
Example Snapshots:
• A sustained bullish phase where OBV remains above the upper band with consistent green coloring.
• A bearish trend change where OBV falls below the upper band hinting at weakening momentum leading to a change in trend.
🔶 SETTINGS
Customization Options:
• Median Length (Default: 100): Adjusts the period for calculating the aggregate median, tailoring trend sensitivity.
• Minimum Lookback Period (Default: 30): Sets the shortest period for median aggregation, refining responsiveness.
• Standard Deviation Multiplier (Default: 1.0): Controls the width of the bands—higher values widen them, lower values tighten them.
• Scaling Factor (Default: 100,000): Scales OBV for better chart readability, adjustable based on asset volume.
The OBV Trend Bands indicator is a versatile tool for traders, blending volume analysis with statistical boundaries to effectively pinpoint market extremes and momentum shifts.

Flow Optimized Moving AverageOverview
The Flow Optimized Moving Average (Flow OMA) is an advanced adaptive moving average designed to dynamically adjust smoothing factors based on market efficiency and volatility. By integrating the Efficiency Ratio (ER) with an Adaptive Moving Average (AMA) and leveraging ATR-based bands, this indicator provides traders with a refined tool for identifying trend direction, strength, and potential reversal zones.
Key Features
Adaptive Moving Average (AMA)
Adjusts to price action based on the Efficiency Ratio (ER), reducing lag in trending markets while smoothing noise in ranging conditions.
Efficiency Ratio (ER)
Measures the effectiveness of price movement over a defined lookback period.
Helps in dynamically adjusting the smoothing constant of the AMA.
ATR-Based Volatility Bands
Creates upper and lower dynamic bands based on the Average True Range (ATR).
Expands in high volatility and contracts in low volatility, providing traders with a contextual understanding of price action.
Slope-Based Trend Strength
Normalizes the moving average slope relative to ATR.
Generates a trend strength score, which influences band opacity, making strong trends visually distinguishable.
Dynamic Color Coding
Bullish Trends: Cyan/Turquoise (#00e2ff)
Bearish Trends: Blue (#003ff5)
Neutral Trends: Gray
The transparency of the bands dynamically adjusts based on trend strength.
Fill Zone Effect
The area between the ATR bands is filled with a gradient-like effect, giving a clear visual representation of trend strength and transitions.
Indicator Components
Inputs (User Settings)
ER Lookback Period: Defines how many bars are used in the Efficiency Ratio calculation (default: 10).
Fast & Slow Periods: Control the sensitivity of the Adaptive Moving Average (default: 2 & 30).
ATR Period: Defines the lookback for Average True Range (default: 14).
Band Multiplier: Determines the width of ATR-based bands (default: 1.5).
Slope Average Period: Smooths trend slope for more stable trend assessment (default: 5).
Efficiency Ratio Calculation
Measures how effectively price moves in a straight line compared to its total movement.
A higher ER value suggests strong trend momentum, while a lower value implies consolidation.
Adaptive Moving Average (AMA)
Dynamically adjusts its smoothing factor based on ER.
Uses a smoothing constant that ranges between the fastest and slowest specified values.
Volatility-Based Bands
Constructed using the ATR multiplier.
Expand and contract dynamically in response to market volatility.
Trend Strength & Direction
Computed using the normalized slope of AMA against ATR.
Positive slope = Bullish trend, Negative slope = Bearish trend.
Visual Enhancements
Colored Adaptive MA Line: Changes based on trend direction.
ATR Bands with Gradient Fill: Visual representation of market conditions.
Dynamic Opacity: Highlights trend strength through transparency.
How to Use the Flow OMA Indicator
Trend Identification
When the Adaptive MA is rising and colored cyan, a bullish trend is in play.
When the Adaptive MA is falling and colored blue, a bearish trend is present.
Trend Strength Assessment
A stronger trend results in more opaque band fills, indicating a clear directional bias.
Weaker trends or consolidations result in fainter fills, signaling a loss of momentum.
Reversal Signals
If price touches the upper band in a bullish move and starts reversing, it can indicate potential profit-taking areas.
If price approaches the lower band in a bearish move and rebounds, a short-term reversal may be imminent.
Volatility Insights
Narrow bands indicate low volatility and possible breakout conditions.
Wider bands suggest increased volatility, warning traders of potential price swings.
Best Practices
✅ Combine with Other Indicators
Use RSI, MACD, or Volume Profile for confirmation before executing trades.
✅ Apply to Multiple Timeframes
Works effectively in higher timeframes (1H, 4H, Daily) for trend trading.
Can be utilized in lower timeframes (5m, 15m) for scalping setups.
✅ Adjust Parameters Based on Asset Volatility
Increase ATR Period for stocks with high volatility.
Reduce ATR Multiplier for forex pairs to avoid excessive band width.
The Flow Optimized Moving Average (Flow OMA) is a powerful trend-following tool designed for both swing and intraday traders. Its adaptive nature allows it to efficiently track trends while minimizing false signals. By incorporating dynamic volatility bands and trend-sensitive color coding, this indicator enhances traders' ability to read price action effectively. Whether used standalone or in combination with other indicators, Flow OMA provides a significant edge in trend analysis.

Continuation Opportunity Indicator by QTX Algo SystemsContinuation Opportunity Indicator by QTX Algo Systems
Overview
This indicator is designed to pinpoint key moments within an established trend when a pullback is likely just a temporary consolidation rather than a reversal. It distinguishes phases of reduced volatility—suggesting a pause or consolidation—from moments when volatility subsequently increases, confirming that the prevailing trend is resuming. This integrated approach combines multiple classical elements into a unique tool that offers traders clear insight into trend continuity.
How It Works
The indicator marries two types of volatility measurements with dual momentum assessments and a trend filter to generate continuation signals. Two complementary volatility metrics are used: one assesses long-term price dispersion to gauge overall market behavior, while the other employs a percentile-based method to capture recent variability and ensure that overall market volatility meets a minimum threshold. A critical part of the signal generation is that the pullback must occur during a period of reduced volatility, indicating consolidation, and then be followed by an increase in volatility, which confirms the resumption of the trend.
For momentum analysis, a double‐smoothed oscillator provides a refined, short-term view of price action, and a Price – Moving Average Ratio (PMARP) confirms the trend’s strength by requiring that it remains above or below a set threshold with a positive or negative slope, respectively. Signals are produced based on crossover events in the momentum oscillator that occur after a pullback, with the subsequent rise in volatility validating the trend continuation. A moving average-based trend filter further ensures that these signals align with the broader market direction.
While the individual components—volatility measures, momentum oscillators, and trend filters—are standard in technical analysis, their deliberate integration in this script results in a tool that is greater than the sum of its parts. Rather than merely merging indicators, this system is crafted to filter out false signals and clearly differentiate between temporary consolidations and genuine trend continuations. By providing a holistic view of market behavior, it offers traders actionable insight into when a pullback is simply a pause before the trend resumes.
How to Use
Traders should monitor the chart for opportunity signals. These signals indicate that a consolidation phase is ending and that the overall trend is likely to continue. Adjust the volatility parameters as needed to suit your market or timeframe, and use these signals in conjunction with other technical analysis tools to confirm optimal entry and exit points.
Disclaimer
This indicator is for educational purposes only and is intended to support your trading strategy. It does not guarantee performance, and past results are not indicative of future outcomes. Always use proper risk management and perform your own analysis before trading.

Market Participation Index [PhenLabs]📊 Market Participation Index
Version: PineScript™ v6
📌 Description
Market Participation Index is a well-evolved statistical oscillator that constantly learns to develop by adapting to changing market behavior through the intricate mathematical modeling process. MPI combines different statistical approaches and Bayes’ probability theory of analysis to provide extensive insight into market participation and building momentum. MPI combines diverse statistical thinking principles of physics and information and marries them for subtle changes to occur in markets, levels to become influential as important price targets, and pattern divergences to unveil before it is visible by analytical methods in an old-fashioned methodology.
🚀 Points of Innovation:
Automatic market condition detection system with intelligent preset selection
Multi-statistical approach combining classical and advanced metrics
Fractal-based divergence system with quality scoring
Adaptive threshold calculation using statistical properties of current market
🚨 Important🚨
The ‘Auto’ mode intelligently selects the optimal preset based on real-time market conditions, if the visualization does not appear to the best of your liking then select the option in parenthesis next to the auto mode on the label in the oscillator in the settings panel.
🔧 Core Components
Statistical Foundation: Multiple statistical measures combined with weighted approach
Market Condition Analysis: Real-time detection of market states (trending, ranging, volatile)
Change Point Detection: Bayesian analysis for finding significant market structure shifts
Divergence System: Fractal-based pattern detection with quality assessment
Adaptive Visualization: Dynamic color schemes with context-appropriate settings
🔥 Key Features
The indicator provides comprehensive market analysis through:
Multi-statistical Oscillator: Combines Z-score, MAD, and fractal dimensions
Advanced Statistical Components: Includes skewness, kurtosis, and entropy analysis
Auto-preset System: Automatically selects optimal settings for current conditions
Fractal Divergence Analysis: Detects and grades quality of divergence patterns
Adaptive Thresholds: Dynamically adjusts overbought/oversold levels
🎨 Visualization
Color-coded Oscillator: Gradient-filled oscillator line showing intensity
Divergence Markings: Clear visualization of bullish and bearish divergences
Threshold Lines: Dynamic or fixed overbought/oversold levels
Preset Information: On-chart display of current market conditions
Multiple Color Schemes: Modern, Classic, Monochrome, and Neon themes
Classic
Modern
Monochrome
Neon
📖 Usage Guidelines
The indicator offers several customization options:
Market Condition Settings:
Preset Mode: Choose between Auto-detection or specific market condition presets
Color Theme: Select visual theme matching your chart style
Divergence Labels: Choose whether or not you’d like to see the divergence
✅ Best Use Cases:
Identify potential market reversals through statistical divergences
Detect changes in market structure before price confirmation
Filter trades based on current market condition (trending vs. ranging)
Find optimal entry and exit points using adaptive thresholds
Monitor shifts in market participation and momentum
⚠️ Limitations
Requires sufficient historical data for accurate statistical analysis
Auto-detection may lag during rapid market condition changes
Advanced statistical calculations have higher computational requirements
Manual preset selection may be required in certain transitional markets
💡 What Makes This Unique
Statistical Depth: Goes beyond traditional indicators with advanced statistical measures
Adaptive Intelligence: Automatically adjusts to current market conditions
Bayesian Analysis: Identifies statistically significant change points in market structure
Multi-factor Approach: Combines multiple statistical dimensions for confirmation
Fractal Divergence System: More robust than traditional divergence detection methods
🔬 How It Works
The indicator processes market data through four main components:
Market Condition Analysis:
Evaluates trend strength, volatility, and price patterns
Automatically selects optimal preset parameters
Adapts sensitivity based on current conditions
Statistical Oscillator:
Combines multiple statistical measures with weights
Normalizes values to consistent scale
Applies adaptive smoothing
Advanced Statistical Analysis:
Calculates higher-order statistical moments
Applies information-theoretic measures
Detects distribution anomalies
Divergence Detection:
Uses fractal theory to identify pivot points
Detects and scores divergence quality
Filters signals based on current market phase
💡 Note:
The Market Participation Index performs optimally when used across multiple timeframes for confirmation. Its statistical foundation makes it particularly valuable during market transitions and periods of changing volatility, where traditional indicators often fail to provide clear signals.

Fractal Breakout Trend Following System█ OVERVIEW
The Fractal Breakout Trend Following System is a custom technical analysis tool designed to pinpoint significant fractal pivot points and breakout levels. By analyzing price action through configurable pivot parameters, this indicator dynamically identifies key support and resistance zones. It not only marks crucial highs and lows on the chart but also signals potential trend reversals through real-time breakout detections, helping traders capture shifts in market momentum.
█ KEY FEATURES
Fractal Pivot Detection
Utilizes user-defined left and right pivot lengths to detect local highs (pivot highs) and lows (pivot lows). This fractal-based approach ensures that only meaningful price moves are considered, effectively filtering out minor market noise.
Dynamic Line Visualization
Upon confirmation of a pivot, the system draws a dynamic line representing resistance (from pivot highs) or support (from pivot lows). These lines extend across the chart until a breakout occurs, offering a continuous visual guide to key levels.
Trend Breakout Signals
Monitors for price crossovers relative to the drawn pivot lines. A crossover above a resistance line signals a bullish breakout, while a crossunder below a support line indicates a bearish move, thus updating the prevailing trend.
Pivot Labelling
Assigns labels such as "HH", "LH", "LL", or "HL" to detected pivots based on their relative values.
It uses the following designations:
HH (Higher High) : Indicates that the current pivot high is greater than the previous pivot high, suggesting continued upward momentum.
LH (Lower High) : Signals that the current pivot high is lower than the previous pivot high, which may hint at a potential reversal within an uptrend.
LL (Lower Low) : Shows that the current pivot low is lower than the previous pivot low, confirming sustained downward pressure.
HL (Higher Low) : Reveals that the current pivot low is higher than the previous pivot low, potentially indicating the beginning of an upward reversal in a downtrend.
These labels provide traders with immediate insight into the market structure and recent price behavior.
Customizable Visual Settings
Offers various customization options:
• Adjust pivot sensitivity via left/right pivot inputs.
• Toggle pivot labels on or off.
• Enable background color changes to reflect bullish or bearish trends.
• Choose preferred colors for bullish (e.g., green) and bearish (e.g., red) signals.
█ UNDERLYING METHODOLOGY & CALCULATIONS
Fractal Pivot Calculation
The script employs a sliding window technique using configurable left and right parameters to identify local highs and lows. Detected pivot values are sanitized to ensure consistency in subsequent calculations.
Dynamic Line Plotting
When a new pivot is detected, a corresponding line is drawn from the pivot point. This line extends until the price breaks the level, at which point it is reset. This method provides a continuous reference for support and resistance.
Trend Breakout Identification
By continuously monitoring price interactions with the pivot lines, the indicator identifies breakouts. A price crossover above a resistance line suggests a bullish breakout, while a crossunder below a support line indicates a bearish shift. The current trend is updated accordingly.
Pivot Label Assignment
The system compares the current pivot with the previous one to determine if the move represents a higher high, lower high, higher low, or lower low. This classification helps traders understand the underlying market momentum.
█ HOW TO USE THE INDICATOR
1 — Apply the Indicator
• Add the Fractal Breakout Trend Following System to your chart to begin visualizing dynamic pivot points and breakout signals.
2 — Adjust Settings for Your Market
• Pivot Detection – Configure the left and right pivot lengths for both highs and lows to suit your desired sensitivity:
- Use shorter lengths for more responsive signals in fast-moving markets.
- Use longer lengths to filter out minor fluctuations in volatile conditions.
• Visual Customization – Toggle the display of pivot labels and background color changes. Select your preferred colors for bullish and bearish trends.
3 — Interpret the Signals
• Support & Resistance Lines – Observe the dynamically drawn lines that represent key pivot levels.
• Pivot Labels – Look for labels like "HH", "LH", "LL", and "HL" to quickly assess market structure and trend behavior.
• Trend Signals – Watch for price crossovers and corresponding background color shifts to gauge bullish or bearish breakouts.
4 — Integrate with Your Trading Strategy
• Use the identified pivot points as potential support and resistance levels.
• Combine breakout signals with other technical indicators for comprehensive trade confirmation.
• Adjust the sensitivity settings to tailor the indicator to various instruments and market conditions.
█ CONCLUSION
The Fractal Breakout Trend Following System offers a robust framework for identifying critical fractal pivot points and potential breakout opportunities. With its dynamic line plotting, clear pivot labeling, and customizable visual settings, this indicator equips traders with actionable insights to enhance decision-making and optimize entry and exit strategies.

Percentage Based ZigZag█ OVERVIEW
The Percentage-Based ZigZag indicator is a custom technical analysis tool designed to highlight significant price reversals while filtering out market noise. Unlike many standard zigzag tools that rely solely on fixed price moves or generic trend-following methods, this indicator uses a configurable percentage threshold to dynamically determine meaningful pivot points. This approach not only adapts to different market conditions but also helps traders distinguish between minor fluctuations and truly significant trend shifts—whether scalping on shorter timeframes or analyzing longer-term trends.
█ KEY FEATURES & ORIGINALITY
Dynamic Pivot Detection
The indicator identifies pivot points by measuring the percentage change from the previous extreme (high or low). Only when this change exceeds a user-defined threshold is a new pivot recognized. This method ensures that only substantial moves are considered, making the indicator robust in volatile or noisy markets.
Enhanced ZigZag Visualization
By connecting significant highs and lows with a continuous line, the indicator creates a clear visual map of price swings. Each pivot point is labelled with the corresponding price and the percentage change from the previous pivot, providing immediate quantitative insight into the magnitude of the move.
Trend Reversal Projections
In addition to marking completed reversals, the script computes and displays potential future reversal points based on the current trend’s momentum. This forecasting element gives traders an advanced look at possible turning points, which can be particularly useful for short-term scalping strategies.
Customizable Visual Settings
Users can tailor the appearance by:
• Setting the percentage threshold to control sensitivity.
• Customizing colors for bullish (e.g., green) and bearish (e.g., red) reversals.
• Enabling optional background color changes that visually indicate the prevailing trend.
█ UNDERLYING METHODOLOGY & CALCULATIONS
Percentage-Based Filtering
The script continuously monitors price action and calculates the relative percentage change from the last identified pivot. A new pivot is confirmed only when the price moves a preset percentage away from this pivot, ensuring that minor fluctuations do not trigger false signals.
Pivot Point Logic
The indicator tracks the highest high and the lowest low since the last pivot. When the price reverses by the required percentage from these extremes, the algorithm:
1 — Labels the point as a significant high or low.
2 — Draws a connecting line from the previous pivot to the current one.
3 — Resets the extreme-tracking for detecting the next move.
Real-Time Reversal Estimation
Building on traditional zigzag methods, the script incorporates a projection calculation. By analyzing the current trend’s strength and recent percentage moves, it estimates where a future reversal might occur, offering traders actionable foresight.
█ HOW TO USE THE INDICATOR
1 — Apply the Indicator
• Add the Percentage-Based ZigZag indicator to your trading chart.
2 — Adjust Settings for Your Market
• Percentage Move – Set a threshold that matches your trading style:
- Lower values for sensitive, high-frequency analysis (ideal for scalping).
- Higher values for filtering out noise on longer timeframes.
• Visual Customization – Choose your preferred colors for bullish and bearish signals and enable background color changes for visual trend cues.
• Reversal Projection – Enable or disable the projection feature to display potential upcoming reversal points.
3 — Interpret the Signals
• ZigZag Lines – White lines trace significant high-to-low or low-to-high movements, visually connecting key swing points.
• Pivot Labels – Each pivot is annotated with the exact price level and percentage change, providing quantitative insight into market momentum.
• Trend Projections – When enabled, projected reversal levels offer insight into where the current trend might change.
4 — Integrate with Your Trading Strategy
• Use the indicator to identify support and resistance zones derived from significant pivots.
• Combine the quantitative data (percentage changes) with your risk management strategy to set optimal stop-loss and take-profit levels.
• Experiment with different threshold settings to adapt the indicator for various instruments or market conditions.
█ CONCLUSION
The Percentage-Based ZigZag indicator goes beyond traditional trend-following tools by filtering out market noise and providing clear, quantifiable insights into price action. With its percentage threshold for pivot detection and real-time reversal projections, this original methodology and customizable feature set offer traders a versatile edge for making informed trading decisions.

Volume Flow Indicator Signals | iSolani
Volume Flow Indicator Signals | iSolani: Decoding Trend Momentum with Volume Precision
In markets where trends are fueled by institutional participation, discerning genuine momentum from false moves is critical. The Volume Flow Indicator Signals | iSolani cuts through this noise by synthesizing price action with volume dynamics, generating high-confidence signals when capital flows align with directional bias. This tool reimagines traditional volume analysis by incorporating volatility-adjusted thresholds and dual-layer smoothing, offering traders a laser-focused approach to trend identification.
Core Methodology
The indicator employs a multi-stage calculation to quantify volume-driven momentum:
Volatility-Adjusted Filter: Measures price changes via log returns, scaling significance using a 30-bar standard deviation multiplied by user-defined sensitivity (default: 2x).
Volume Normalization: Caps extreme volume spikes at 3x the 50-bar moving average, preventing distortion from anomalous trades.
Directional Volume Flow: Assigns positive/negative values to volume based on whether price movement exceeds volatility-derived thresholds.
Dual Smoothing: Applies consecutive SMA (3-bar) and EMA (14-bar) to create the Volume Flow Indicator (VFI) and its signal line, filtering out transient fluctuations.
Breaking New Ground
This implementation introduces three key innovations:
Adaptive Noise Gates: Unlike static volume oscillators, the sensitivity coefficient dynamically adjusts to market volatility, reducing false signals during choppy conditions.
Institutional Volume Capping: The vcoef parameter limits the influence of outlier volume spikes, focusing on sustained institutional activity rather than one-off trades.
Non-Repainting Signals: Generates single-per-trend labels (buy below bars, sell above) to avoid chart clutter while maintaining visual clarity.
Engine Under the Hood
The script executes through five systematic stages:
Data Preparation: Computes HLC3 typical price and its logarithmic rate of change.
Threshold Calculation: Derives dynamic cutoff levels using 30-period volatility scaled by user sensitivity.
Volume Processing: Filters raw volume through a 50-bar SMA, capping extremes at 3x average.
VFI Construction: Sums directional volume flow over 50 bars, smoothed with a 3-bar SMA.
Signal Generation: Triggers alerts when VFI crosses zero, confirmed by a 14-bar EMA crossover.
Standard Configuration
Optimized defaults balance responsiveness and reliability:
Volume MA: 50-bar smoothing window
Sensitivity: 2.0 (doubles volatility threshold)
Signal Smoothing: 14-bar EMA
Volume Cap: 3x average (hidden parameter)
VFI Smoothing: Enabled (3-bar SMA)
By fusing adaptive volume filtering with price confirmation logic, the Volume Flow Indicator Signals | iSolani transforms raw market data into institutional-grade trend signals. Its ability to mute choppy price action while amplifying high-conviction volume moves makes it particularly effective for spotting early trend reversals in equities, forex, and futures markets.

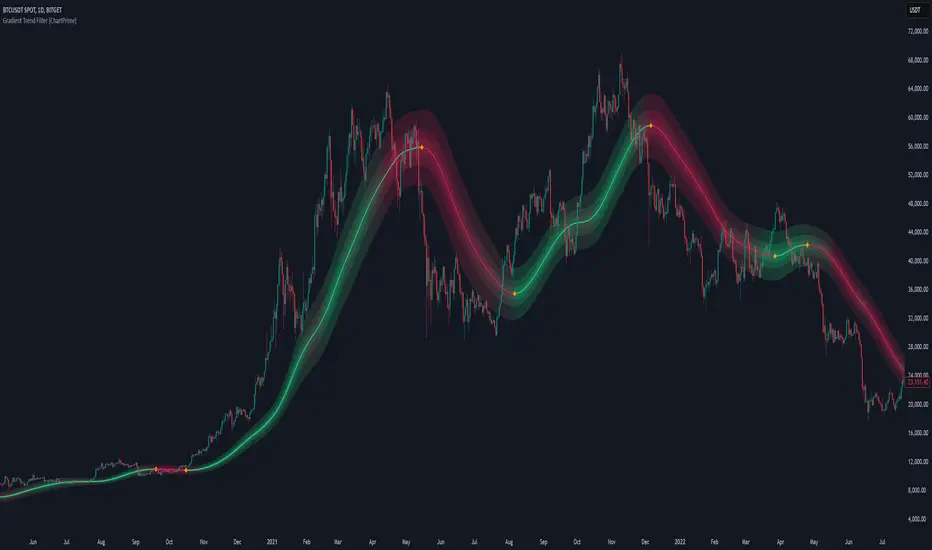
Gradient Trend Filter [ChartPrime]The Gradient Trend Filter is a dynamic trend analysis tool that combines a noise-filtered trend detection system with a color-gradient cloud. It provides traders with a visual representation of trend strength, momentum shifts, and potential reversals.
⯁ KEY FEATURES
Trend Noise Filtering
Uses an advanced smoothing function to filter market noise and produce a more reliable trend representation.
// Noise filter function
noise_filter(src, length) =>
alpha = 2 / (length + 1)
nf_1 = 0.0
nf_2 = 0.0
nf_3 = 0.0
nf_1 := (alpha * src) + ((1 - alpha) * nz(nf_1 ))
nf_2 := (alpha * nf_1) + ((1 - alpha) * nz(nf_2 ))
nf_3 := (alpha * nf_2) + ((1 - alpha) * nz(nf_3 ))
nf_3 // Final output with three-stage smoothing
Color-Based Trend Visualization
The mid-line changes color based on trend direction—green for uptrends and red for downtrends—making it easy to identify trends at a glance.
Orange diamond markers appear when a trend shift is confirmed, providing actionable signals for traders.
Gradient Color Trend Cloud
A cloud around the base trend line that dynamically changes color, often signaling trend shifts ahead of the main trend line.
When in a downtrend, if the cloud starts turning green, it suggests weakening bearish momentum or an upcoming bullish reversal. Conversely, when in an uptrend, a red cloud indicates potential trend weakening or a bearish reversal.
Multi-Layered Trend Bands
The cloud consists of multiple bands, offering a range of support and resistance zones that traders can use for confluence in decision-making.
⯁ HOW TO USE
Identify Trend Strength & Reversals
Use the mid-line and cloud color changes to assess the strength of a trend and spot early signs of reversals.
Monitor Momentum Shifts
Watch for gradient cloud color shifts before the trend line changes color, as this can indicate early weakening or strengthening of momentum.
Act on Trend Shift Markers
Use the orange diamonds as confirmation of trend shifts and potential trade entry or exit points.
Utilize Cloud Bands as Support/Resistance
The outer bands of the cloud act as dynamic support and resistance, helping traders refine their stop-loss and take-profit placements.
⯁ CONCLUSION
The Gradient Trend Filter is an advanced trend detection tool designed for traders looking to anticipate trend shifts with greater precision. By integrating a noise-filtered trend line with a gradient-based trend cloud, this indicator enhances traders' ability to navigate market trends effectively.
Cumulative Price Change AlertCumulative Price Change Alert
Version: 1.0
Author: QCodeTrader 🚀
Overview 🔍
The Cumulative Price Change Alert indicator analyzes the percentage change between the current and previous open prices and sums these changes over a user-defined number of bars. It then generates visual buy and sell signals using arrows and labels on the chart, helping traders spot cumulative price momentum and potential trading opportunities.
Key Features ⚙️
Customizable Timeframe 🕒:
Use a custom timeframe or default to the chart's timeframe for price data.
User-Defined Summation 🔢:
Specify the number of bars to sum, allowing you to analyze cumulative price changes.
Custom Buy & Sell Conditions 🔔:
Set individual percentage change thresholds and cumulative sum thresholds to tailor signals for
your strategy.
Visual Alerts 🚀:
Displays green upward arrows for buy signals and red downward arrows for sell signals directly
on the chart.
Informative Labels 📝:
Provides labels with formatted percentage change and cumulative sum details for the analyzed
bars.
Versatile Application 📊:
Suitable for stocks, forex, crypto, commodities, and more.
How It Works ⚡
Price Change Calculation ➗:
The indicator calculates the percentage change between the current bar's open price and the
previous bar's open price.
Cumulative Sum ➕:
It then sums these percentage changes over the last N bars (as specified by the user).
Signal Generation 🚦:
Buy Signal 🟢: When both the individual percentage change and the cumulative sum exceed
their respective buy thresholds, a green arrow and label are displayed.
Sell Signal 🔴: Conversely, if the individual change and cumulative sum fall below the sell
thresholds, a red arrow and label are shown.
How to Use 💡
Add the Indicator ➕:
Apply the indicator to your chart.
Customize Settings ⚙️:
Set a custom timeframe if desired.
Define the number of bars to sum.
Adjust the buy/sell percentage change and cumulative sum thresholds to match your trading
strategy.
Interpret Visual Cues 👀:
Monitor the chart for green or red arrows and corresponding labels that signal potential buy or
sell opportunities based on cumulative price movements.
Settings Explained 🛠️
Custom Timeframe:
Select an alternative timeframe for analysis, or leave empty to use the current chart's timeframe.
Number of Last Bars to Sum:
Determines how many bars are used to compute the cumulative percentage change.
Buy Condition - Min % Change:
The minimum individual percentage change required to consider a buy signal.
Buy Condition - Min Sum of Bars:
The minimum cumulative percentage change over the defined bars needed for a buy signal.
Sell Condition - Max % Change:
The maximum individual percentage change threshold for a sell signal.
Sell Condition - Max Sum of Bars:
The maximum cumulative percentage change over the defined bars for triggering a sell signal.
Best Use Cases 🎯
Momentum Identification 📈:
Quickly spot strong cumulative price movements and momentum shifts.
Entry/Exit Signals 🚪:
Use the visual signals to determine potential entry and exit points in your trading.
Versatile Strategy Application 🔄:
Effective for scalping, swing trading, and longer-term analysis across various markets.
UPD: uncheck labels for better performance

Volatility Price FlowCapitalize on market volatility with our new volatility price flow indicator. We have designed this indicator to process historical price movements and indicate when price may have reached exhaustion in the context of current volatility.
This is achieved by taking the price deviation from a user defined moving average, and applying a weighting to the deviations from the candle body and candle wick on both buy side and sell side, over a user defined period. The period of the base moving average, type of moving average and the period of the historical price deviations can all be modified. This creates a typical 'band' style indicator, though with a unique characteristic that the buy and sell side vary independently as well as the band expansion being based on weighted variables tied to the actual price changes, rather than just a standard deviation the moves uniformly.
Additionally, these bands can be merged with an anchored vwap - we do this so that the deviations of price from the moving average can include a more volume based approach to identifying potential pivots.
The end result is an indicator that reflects the current market price movements, identifies and capitalizes on impulsive or beginning moves to indicate potential tops / bottoms / reversals.
The signals are simple - anytime price closes within a band, having been outside the band, a signal is displayed. As a basic guide to setting the indicator up for the first time, we suggest reducing all of the multipliers to a value less than 1. Then gradually increase each one, until the signals reduce in quantity and improve in quality, starting with the price deviation multiplier, then the volatility multiplier and finally the expansion multiplier.
Last of all, alerts can be created based on the current chart timeframe and indicator settings, simply by adding an alert that uses the built in buy or sell signal.
Note: We cannot guarantee the accuracy of the signals provided, since the user creates the signals by modifying the settings, and as such we can take no responsibility for any trading losses incurred using the indicator and highly encourage all users to manage their risk and only risk what you can afford to lose.

highs&lowsone of my first strategy: highs&lows
This strategy takes the highest high and the lowest low of a specified timeframe and specified bar count.
It will then takes the average between these two extremes to create a center line.
This creates a range of high middle and low.
Then the strategy takes the current market movement
which is the direct average(no specified timeframe and specified bar count) of the current high and low.
Using this "current market movement" within the range of high middle and low it determins when to buy and then sell the asset.
*********note***************
-this strategy is (bullish)
-works good with most futures assets that have volatility/ decent movement
(might add more details if I forget any)
(work in progress)

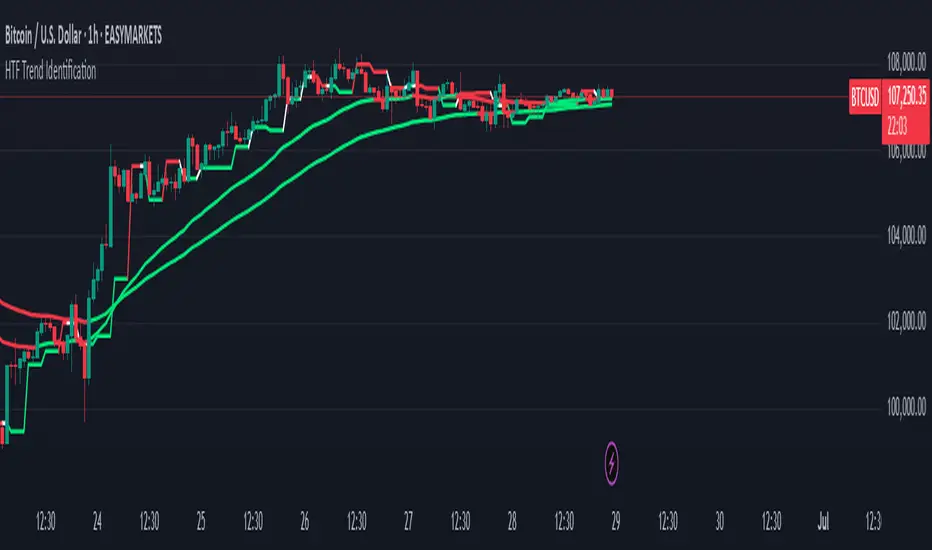
HTF Trend IdentificationThis indicator identifies higher timeframe (HTF) trends and plots them on the chart. It uses a fixed higher timeframe input and a selectable source to calculate the HTF value. The indicator also plots an EMA and colors the candles based on the HTF trend and EMA crossover.
**Features:**
* **HTF Trend Identification:** Calculates and plots a higher timeframe trend based on a user-defined source and fixed timeframe. This allows you to visualize the larger trend context on your current chart.
* **Repainting Option:** Provides a toggle to control whether the HTF calculation repaints. Disabling repainting ensures that past HTF signals remain fixed, but may introduce a slight lag. Enabling repainting provides more up-to-date signals, but can cause past signals to change.
* **Customizable Colors:** Allows users to set custom colors for uptrends and downtrends.
* **EMA Plot:** Includes an Exponential Moving Average (EMA) plot with a customizable length and offset. The EMA color changes based on the HTF trend.
* **Candle Coloring:** Colors the candles based on the HTF trend, providing a clear visual representation of the overall trend direction.
* **Alerts:** (This would require adding alert conditions to the code, which I can do if you'd like) Could be extended to include alerts for HTF trend changes or EMA crossovers.
**Inputs:**
* **Repainting:** On/Off toggle to control repainting of the HTF calculation.
* **Source:** Select the source for HTF calculations (e.g., close, open, high, low, etc.).
* **Fixed Higher Timeframe:** Set the higher timeframe for trend calculation (e.g., 1D, 4H, 1W). *Note: Timeframes smaller than the current chart's timeframe are not allowed.*
* **Up Color:** Color for uptrends.
* **Down Color:** Color for downtrends.
* **EMA Length 1:** Length of the EMA.
* **Offset:** Offset for the EMA plot.
**How to Use:**
1. Add the indicator to your chart.
2. Configure the inputs to your desired settings.
3. Observe the plotted HTF trend line, EMA, and candle colors to identify potential trading opportunities.
**Limitations:**
* **Repainting:** Enabling repainting can cause past HTF signals to change. Use with caution.
* **No Alerts (by default):** This version does not include alerts. However, this can be added if requested.
**Author:** atulgalande75
**Disclaimer:** This script is for educational purposes only and should not be considered financial advice. Use at your own risk.
Zerg range filter credit to Kivanc turkish pinecoder for base indicator i reworked with chatgpt and some common sense
this indicator similar to the ADX but i think its better visually to keep you out of market conditions that are unfavorable.
i made original indicator to work in a 0-100 enviroment (before it was a zero middle line oscillator) and added background coloring that has a lower and higher threshold setting. i also added a smoothing moving average. this will trigger threshold levels (not the core oscillator)
above higher level would indicate trending market conditions and its purple. these are the areas where you might want to buy low period moving average bounces like 10 or 21 ema
lower band will paint indicator background blue and its cold, meaning range bound trade ideas are likely play out better. selling resistance and buying horizontal supports for example.
you are encourage to play with lookback period and change thresholds until you find something that works for your trading.
on the picture above it illustrates how i intended its usage.
it also shows divergences which was not intended but also a function.
you can also observe as the oscillator likes to coil up into a tight range (horizontal or a wedge formation) and when these break their trendlines explosive moves are incoming usually.
if you have a trading system and can generate a lot of signals but want to filter out some loser trades this could be the indicator you were looking for.
i hope this will be inline with community guidelines. my other publishing got removed unfortunately

Sma Indicator with Ratio (pr)SMA Indicator with Ratio (PR) is a technical analysis tool designed to provide insights into the relationship between multiple Simple Moving Averages (SMAs) across different time frames. This indicator combines three key SMAs: the 111-period SMA, 730-period SMA, and 1400-period SMA. Additionally, it introduces a ratio-based approach, where the 730-period SMA is multiplied by factors of 2, 3, 4, and 5, allowing users to analyze potential market trends and price movements in relation to different SMA levels.
What Does This Indicator Do?
The primary function of this indicator is to track the movement of prices in relation to several SMAs with varying periods. By visualizing these SMAs, users can quickly identify:
Short-term trends (111-period SMA)
Medium-term trends (730-period SMA)
Long-term trends (1400-period SMA)
Additionally, the multiplied versions of the 730-period SMA provide deeper insights into potential price reactions at different levels of market volatility.
How Does It Work?
The 111-period SMA tracks the shorter-term price trend and can be used for identifying quick market movements.
The 730-period SMA represents a longer-term trend, helping users gauge overall market sentiment and direction.
The 1400-period SMA acts as a very long-term trend line, giving users a broad perspective on the market’s movement.
The ratio-based SMAs (2x, 3x, 4x, 5x of the 730-period SMA) allow for an enhanced understanding of how the price reacts to higher or lower volatility levels. These ratios are useful for identifying key support and resistance zones in a dynamic market environment.
Why Use This Indicator?
This indicator is useful for traders and analysts who want to track the interaction of price with different moving averages, enabling them to make more informed decisions about potential trend reversals or continuations. The added ratio-based values enhance the ability to predict how the market might react at different levels.
How to Use It?
Trend Confirmation: Traders can use the indicator to confirm the direction of the market. If the price is above the 111, 730, or 1400-period SMA, it may indicate an uptrend, and if below, a downtrend.
Support/Resistance Levels: The multiplied versions of the 730-period SMA (2x, 3x, 4x, 5x) can be used as dynamic support or resistance levels. When the price approaches or crosses these levels, it might indicate a change in the trend.
Volatility Insights: By observing how the price behaves relative to these SMAs, traders can gauge market volatility. Higher multiples of the 730-period SMA can signal more volatile periods where price movements are more pronounced.

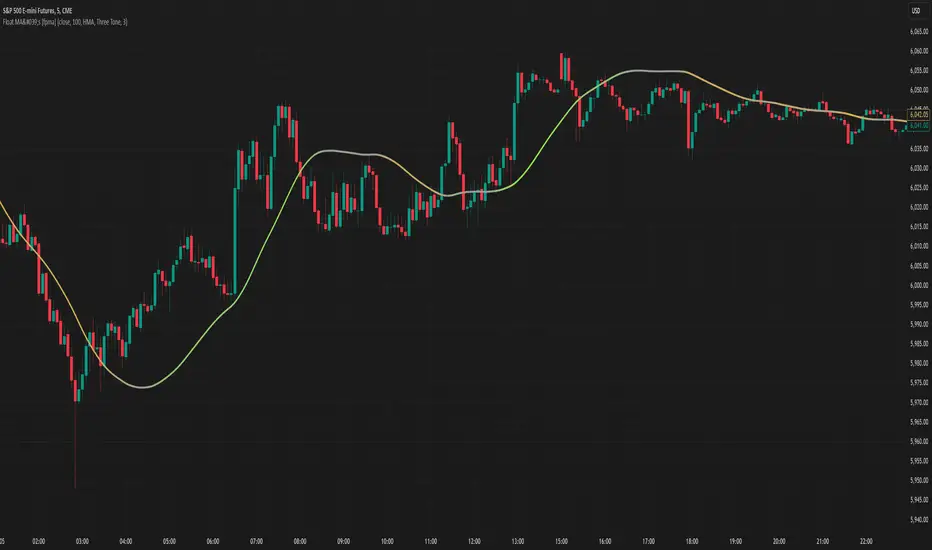
Moving Averages With Continuous Periods [macp]This script reimagines traditional moving averages by introducing floating-point period calculations, allowing for fractional lengths rather than being constrained to whole numbers. At its core, it provides SMA, WMA, and HMA variants that can work with any decimal length, which proves especially valuable when creating dynamic indicators or fine-tuning existing strategies.
The most significant improvement lies in the Hull Moving Average implementation. By properly handling floating-point mathematics throughout the calculation chain, this version reduces the overshoot tendencies that often plague integer-based HMAs. The result is a more responsive yet controlled indicator that better captures price action without excessive whipsaw.
The visual aspect incorporates a trend gradient system that can adapt to different trading styles. Rather than using fixed coloring, it offers several modes ranging from simple solid colors to more nuanced three-tone gradients that help identify trend transitions. These gradients are normalized against ATR to provide context-aware visual feedback about trend strength.
From a practical standpoint, the floating-point approach eliminates the subtle discontinuities that occur when integer-based moving averages switch periods. This makes the indicator particularly useful in systems where the MA period itself is calculated from market conditions, as it can smoothly transition between different lengths without artificial jumps.
At the heart of this implementation lies the concept of continuous weights rather than discrete summation. Traditional moving averages treat each period as a distinct unit with integer indexing. However, when we move to floating-point periods, we need to consider how fractional periods should behave. This leads us to some interesting mathematical considerations.
Consider the Weighted Moving Average kernel. The weight function is fundamentally a slope: -x + length where x represents the position in the averaging window. The normalization constant is calculated by integrating (in our discrete case, summing) this slope across the window. What makes this implementation special is how it handles the fractional component - when the length isn't a whole number, the final period gets weighted proportionally to its fractional part.
For the Hull Moving Average, the mathematics become particularly intriguing. The standard HMA formula HMA = WMA(2*WMA(price, n/2) - WMA(price, n), sqrt(n)) is preserved, but now each WMA calculation operates in continuous space. This creates a smoother cascade of weights that better preserves the original intent of the Hull design - to reduce lag while maintaining smoothness.
The Simple Moving Average's treatment of fractional periods is perhaps the most elegant. For a length like 9.7, it weights the first 9 periods fully and the 10th period at 0.7 of its value. This creates a natural transition between integer periods that traditional implementations miss entirely.
The Gradient Mathematics
The trend gradient system employs normalized angular calculations to determine color transitions. By taking the arctangent of price changes normalized by ATR, we create a bounded space between 0 and 1 that represents trend intensity. The formula (arctan(Δprice/ATR) + 90°)/180° maps trend angles to this normalized space, allowing for smooth color transitions that respect market volatility context.
This mathematical framework creates a more theoretically sound foundation for moving averages, one that better reflects the continuous nature of price movement in financial markets. The implementation recognizes that time in markets isn't truly discrete - our sampling might be, but the underlying process we're trying to measure is continuous. By allowing for fractional periods, we're creating a better approximation of this continuous reality.
This floating-point moving average implementation offers tangible benefits for traders and analysts who need precise control over their indicators. The ability to fine-tune periods and create smooth transitions makes it particularly valuable for automated systems where moving average lengths are dynamically calculated from market conditions. The Hull Moving Average calculation now accurately reflects its mathematical formula while maintaining responsiveness, making it a practical choice for both systematic and discretionary trading approaches. Whether you're building dynamic indicators, optimizing existing strategies, or simply want more precise control over your moving averages, this implementation provides the mathematical foundation to do so effectively.
Multi Timeframe 8x MA Support Resistance Zones [SiDec]Multi-Timeframe Moving Average Support/Resistance Zones: The Ultimate Trading Power Tool
Indicator Overview
Get ready to elevate your trading game with the Multi-Timeframe Moving Average Support/Resistance Zones indicator. This advanced tool is engineered for traders who want to maximize efficiency without constantly switching between timeframes. By dynamically plotting support and resistance zones using the 21 SMA and 21 EMA, it reveals crucial price levels where trends may pause, reverse, or accelerate—giving you actionable insights in a fraction of the time.
Imagine seeing all the relevant timeframe zones on one chart, without ever needing to flip between timeframes—saving you time and allowing you to focus on what really matters.
Core Features
Dynamic Zones That Adjust in Real-Time:
The area between the 21 EMA and 21 SMA is shaded, forming a "zone" on your chart. This dynamic zone adjusts live as price moves, keeping you in sync with current market behavior across multiple timeframes.
By showing these zones across all your selected timeframes, you can view everything you need at a glance—no time wasted jumping between charts.
All Timeframes, One View:
With the ability to view multiple timeframe zones simultaneously (from 5-minute to Monthly), this tool helps you spot key levels quickly without switching between timeframes. You’ll see how price interacts with these levels across different timeframes without ever having to change charts.
Higher timeframes show broader, more significant zones—giving you the market's big picture—while intraday zones help you fine-tune your entries.
Customisable Like Never Before:
Toggle Timeframes: Only activate the timeframes you care about—no distractions, just pure focus.
Color Your World: Assign different colors to each timeframe for instant visual cues (e.g., blue for Daily, gold for Weekly). This makes it easy to identify key zones across all timeframes at a glance.
Why You Need This Tool
Instant Trend Confirmation: Track how price interacts with multiple timeframe zones to confirm bullish or bearish momentum in real-time.
Confluence = High Confidence: When zones from multiple timeframes overlap, you’ve found a high-probability reversal area. This is where the market is likely to turn, and where your edge lies.
Efficiency at Its Best: No more switching between timeframes—everything you need is in one place, giving you more time to trade and less time spent on analysis.
Configuration Instructions
1.) Timeframe Selection:
Choose which timeframes to display using the Timeframe Selection panel.
Intraday Focus: 5m, 15m, 1H.
Swing/Long-Term Focus: 4H, 12H, Daily, Weekly, Monthly.
Color Coding: Assign a distinct color to each timeframe for instant identification—like having a personal color-coded trading roadmap.
2.) MA Settings:
MA Types:
21 EMA: Perfect for capturing short-term trends and fast price action.
21 SMA: The smooth operator for spotting longer-term trends with more consistency.
Recommended Periods: The 21-period MA works wonders for trend detection across various timeframes. You can also integrate Fibonacci-based MAs (e.g., 55, 233) for enhanced confluence.
3.) Visual Tweaks:
Opacity: Adjust the zone transparency (80-90% opacity keeps it visible yet non-intrusive).
Zone Extensions: Customize how far zones extend backward and forward, capturing the full impact of support/resistance levels.
Labels: Show real-time MA values and timeframe-specific details for further clarity.
Trading Strategies That Pack a Punch
1.) Trend Confirmation:
Uptrend: Price staying above the 21 EMA and 21 SMA suggests a bullish trend.
Downtrend: Price holding below these MAs signals a bearish market.
2.) Zone-Based Reversals:
Entry: Look for price to retrace to a higher timeframe support zone (e.g., Daily 21 SMA) with confirmation from oversold/overbought indicators like RSI.
Exit: Time to sell when price breaks through a critical zone, like the 4H 21 EMA.
3.) Confluence Trading:
Combine the zones with other indicators to amplify your trade setups:
Fibonacci Levels: When a 61.8% retracement lines up with an MA zone, you’ve found a high-confluence area.
Volume Profile: High-volume nodes near key zones strengthen their significance.
Best Practices for Maximum Profit
Focus on Higher Timeframes: Weekly and Monthly zones carry more weight, making them more significant in decision-making.
Avoid Clutter: If you’re trading higher timeframes, disable intraday timeframes like 5m and 15m to keep your chart clear and focused.
Risk Management: Zones are probabilities, not guarantees. Always use stop-loss orders to protect your trades.
Example of a Winning Setup
Scenario:
Price retraces to the 1H 21 EMA zone.
The Daily 21 SMA zone is nearby—talk about confluence!
RSI shows oversold conditions, indicating a potential reversal.
Action:
Enter long on a bullish candlestick pattern (e.g., bullish engulfing).
Set your stop-loss just below the Daily 21 SMA zone.
Target the next higher timeframe resistance.
Performance Considerations
Repainting Risk: Zones might slightly adjust with the formation of new bars, but the changes will typically be minimal.
Enhance with Oscillators: Use momentum indicators like MACD or Stochastic and volume analysis for even more confirmation.
Conclusion
The Multi-Timeframe Moving Average Support/Resistance Zones indicator isn’t just a tool—it’s a game-changer. With the ability to view all relevant timeframe zones on one chart, you can make decisions faster, spot high-confluence areas, and trade with greater precision. The time you save by not switching between timeframes can make all the difference in your trading success.
Maximise your trading edge—harness the power of multi-timeframe analysis, gain more time to trade, and dominate the market like never before. 📊🔍

Dynamic 200 EMA with Trend-Based ColoringDescription:
This script plots the 200-period Exponential Moving Average (EMA) and dynamically changes its color based on the trend direction. The script helps traders quickly identify whether the price is above or below the 200 EMA, which is widely used as a long-term trend indicator.
How It Works:
The script calculates the 200 EMA based on the closing price.
If the price is above the EMA, it suggests a bullish trend, and the EMA line turns green.
If the price is below the EMA, it suggests a bearish trend, and the EMA line turns red.
An optional background color is added to enhance visual clarity, highlighting the current trend direction.
Use Cases:
Trend Confirmation: Helps traders determine if the overall trend is bullish or bearish.
Support and Resistance: The 200 EMA is often used as dynamic support/resistance.
Entry & Exit Signals: Traders can use crossovers with the 200 EMA as potential trade signals.
This script is designed for traders looking for a simple yet effective way to incorporate trend visualization into their charts. It is fully open-source and can be customized to fit individual trading strategies.
