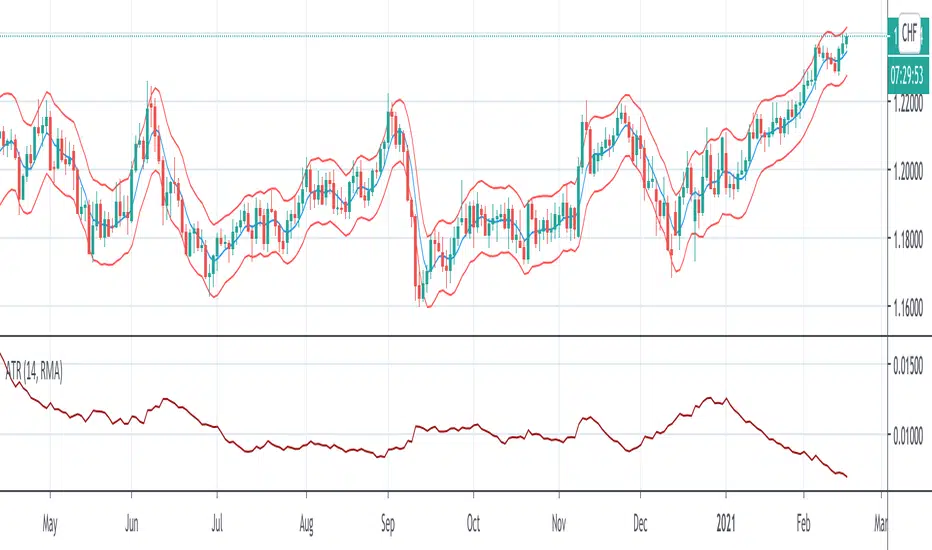
Arnaud Legoux Moving Average With ATR BandsArnaud Legoux Moving Average With ATR Bands to get an idea of the volatility.
ATR
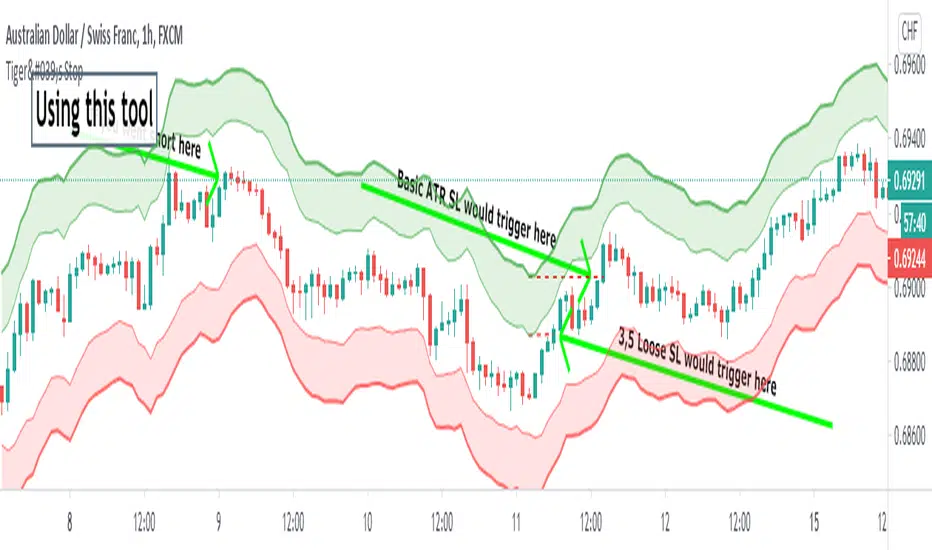
Tiger's Stop - Objective Stoploss SettingTrading is a lot about risk management too. I created this script to help with setting and moving a proper stop-loss. It plots an area that is a result of adding and subtracting both average true range and something I call "false range".
►The Average True Range is calculated as the candle's high-low. If there is a gap, it is added to complete the result.
►My own False Range just candle bodies. It is calculated as an absolute value of (close-open).
Then, Rolling Moving Average is applied on both ATR and False Range to get an idea of how far the price tends to extend out of pure randomness. The resulting value is multiplied by a Multiplier.
The next step is an addition of the values to the higher part of the candle for short or a lower part of the candle for long. I prefer a special calculation instead of using Highs and Lows because it allows for more precise observation and stop-loss set up for less wicky symbols.
►►►Additional Functions
• Smoothing - applies moving average to candles from which range distance is calculated. This can achieve good smoothness but higher values will lead to using outdated price in the SL area calculation.
• Enable/Disable - if you know the direction you are going to trade in, it is good to disable either Long Stop-Loss Area or Short Stop-Loss Area. Just untick it in the settings.
►►►Actual Using
Before using the script to set your stop-loss, check the historical data and find a similar set-up. Is it engulfing you use as a trigger? Find a different one and see how effective the stop-loss based on the ATR*multiplier was. This will help you to optimize Multiplier value. A picture shows such research for a double top. You should find more similar situations to find an optimal value.
Ultimately, the indicator still gives you relatively a lot of freedom with your stop-loss settings (at least, that is with the default settings). You need to decide how loose stop-loss you want to set. Average True Range is the furthermost part which will make for a very large stop-loss, on the other hand, False Range might be triggered by a villainous wick unnecessarily. The choice should depend on the specific symbol you trade and perhaps, you will learn to set stops regardless of the indicator.
A little trick : 1. You can set the loosest stop-loss and set a TradingView alert for where the tightest stop-loss would be. When alerted, you will get the opportunity to reconsider the trade and take a loss if needs be or exit if a candle closes there. 2. Mostly for cryptocurrencies, you can set the tightest stop-loss to protect yourself from sudden spikes. If the price approaches it slowly enough, you can move the stop-loss to the further part of the channel. This is not the same as moving stop-loss indefinitely with hopes of reversal if you plan it from the beginning and a smaller stop is meant to protect you from spikes that are not always predictable and drive to both directions.
►►►Advantages of trailing stop-loss
I usually stick with my original stop-loss instead of moving to break even. If my entry area was functional support once, it may work again and is, therefore, still a good entry zone. But an alternative used to preserve as much of the profit as possible is trailing.
Trailing is setting a specific value in ticks or a calculation of how to move the stop-loss whenever the price moves in your favor. Tiger's Stop can be used this way. Whenever there is a new value as the candle closes and that value is closer to price than your current stop-loss, you can update it. However, if it moves further from your price, don't change the stop-loss. This can be a little tiresome if you do it manually but should be worth the effort.
I usually start trailing only after the price moves significantly in my favor that allowing it to return to the entry price would not make any sense.
►►►Feedback and optimization
The preview chart is chosen entirely at random and the values are not optimized for any specific symbol. If you opt to use it, let me know which values work for you the best, I'll add it to the description when I update it.
Furthermore, let me know if you think any sort of alerts would be useful with my script.
Good luck!
Trend MagicTrend Magic is originally a MT platform (MetaTrader) indicator and it can be used with any forex trading systems / strategies for additional confirmation of trading entries or exits. Converted the MT platform code to TradingView Pine version 4. Also you can use Multiple Time Frame.
It also works well with Crypto and Stock Markets.
Trend Magic consists of two main calculation parts as momentum and volatility:
First part is ATR based (like ATR Trailing Stop) logic, second part is all about CCI which also determines the color of Trend Magic.
Blue: when CCI is positive
Red: when CCI is negative
Also added alert condition regarding price crosses :
when LOW CrossesAbove TM
and HIGH CrossesBelow TM
Enjoy
Kıvanç Özbilgiç

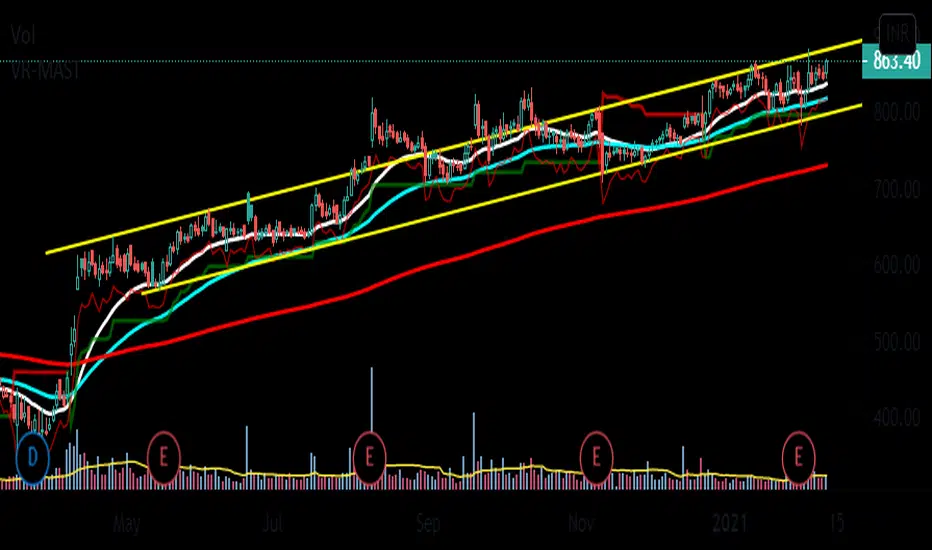
VR-MASTThis is a my script for a super simple trading strategy - ZEST.
Identify Zone of Value, Enter on pullback, place proper Stop Loss and set achievable Targets.
So, to identify Zone of Value, I have EMA in my script.
20EMA generally acts as a dynamic Support/Resistance zone.
For Buy Stop Loss, we have 1ATR below Swing Low.
Then, we have SuperTrend for Trailing Stop Loss.
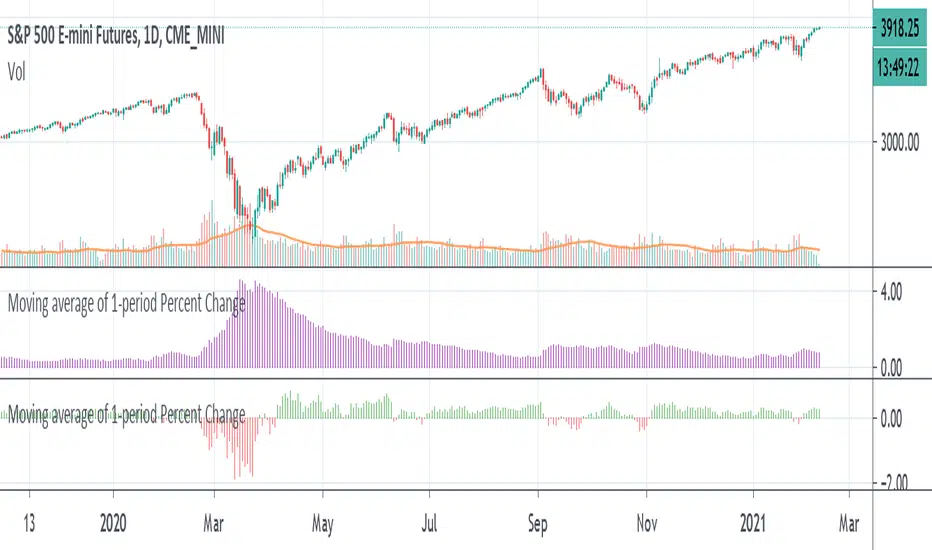
Moving average of 1-period Percent ChangeAnother way of finding the average range of the bars using 1 period percentage change of the price and taking an average of them. It's given in percentages and the absolute value of the average can be shown when the option is turned on, or the average including the up and down bars can be shown. Perhaps an alternative way of looking at volatility or range of the bars. If you prefer a line version over histogram, just simply change the style under the settings of the indicator.
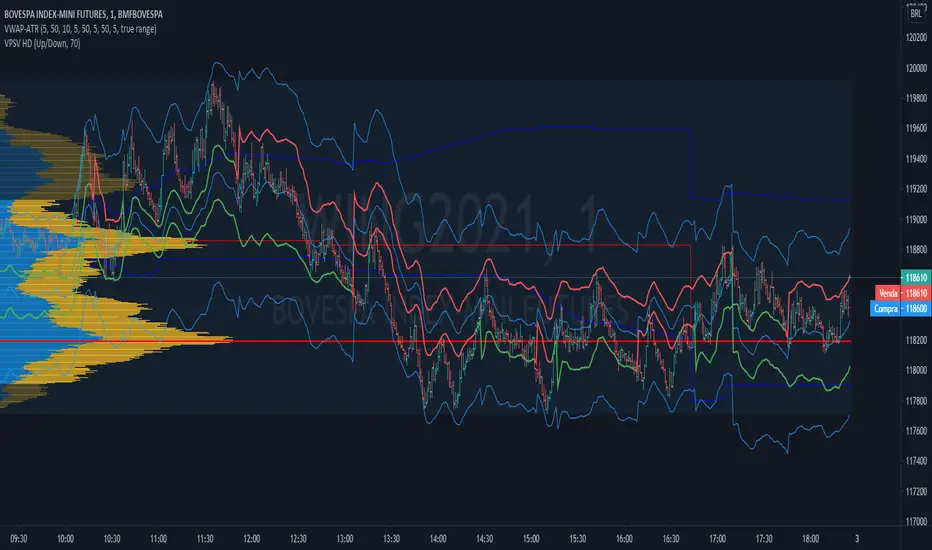
VWAP-ATR-SSLThis is an experimental idea to transform the original script created by @Fleite28 in a kind of SSL with volatility bands.
@Fleite28 has made all script and he have all credits, I just give him this idea.
I'm using this indicator to confirm:
1-potential bull trend (when you have 2x green lines with support)
2-potential bear trend (2x lines red - resistance)
3-consolidations (inside green support and red resistance).
Try to use this with a Market Profile Volume and some trend lines.
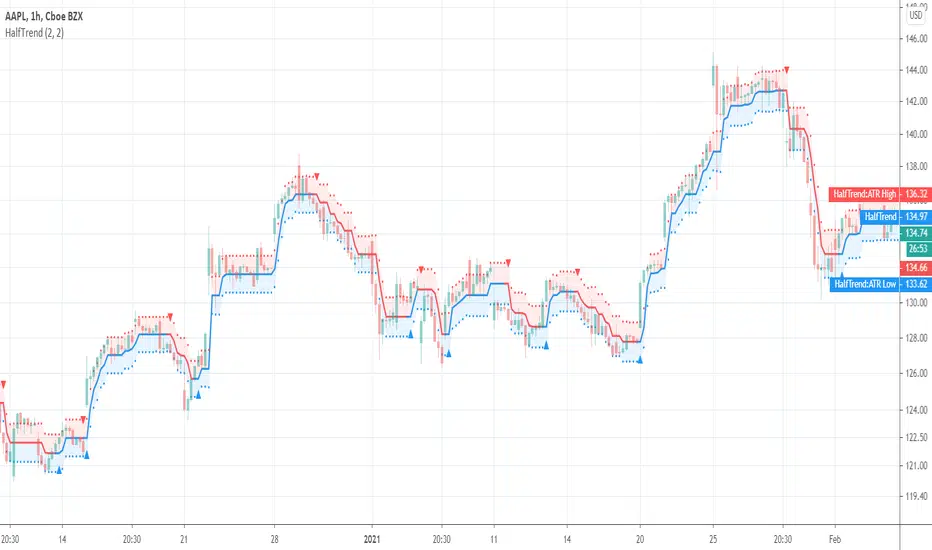
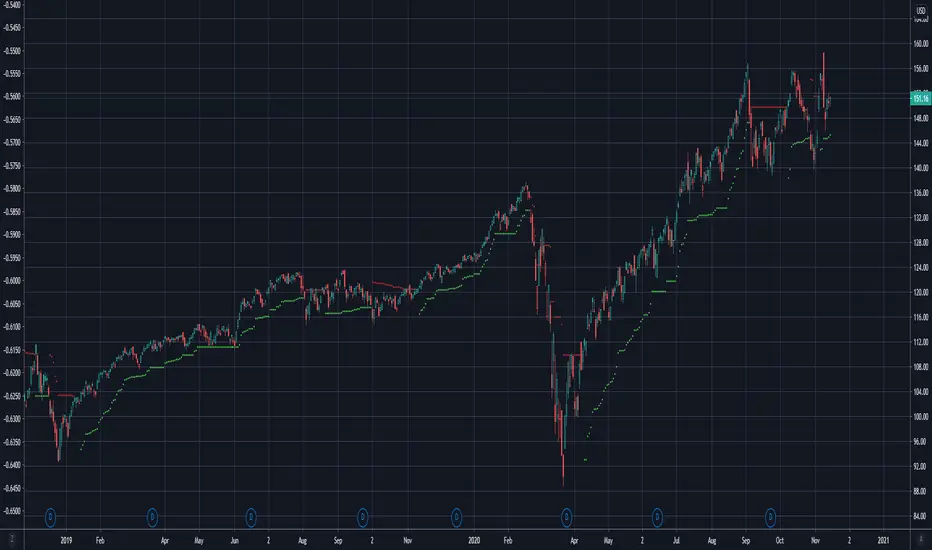
HalfTrendA popular trend indicator based on ATR. Similar to the SuperTrend but uses a different trend's identification logic.
I am publishing a disclosed code without license. Remember that in the future you may see a lot of paid IO scripts called BuySellScalper, Trend Trader Karan, Trend Trader and etc (by other authors) which will be based on this script. I found the same script on Ebay for $10 with a free shipping. Beware, always check and follow one Russian wisdom: "Do not pay for something you can get for free".
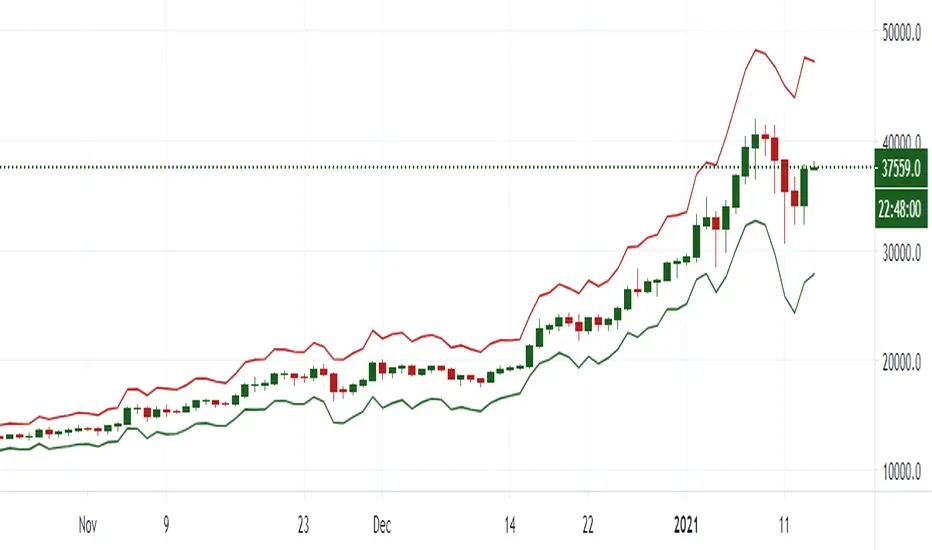
Running Bound based on ATR multiplierThis script basically uses default ATR and then
Multiplies with ATR multiplier (3 for crypto and 2 for forex) - you can change the values from the settings if you like
Adds/subtracts from the current price
And tries to find a bound on both side of price
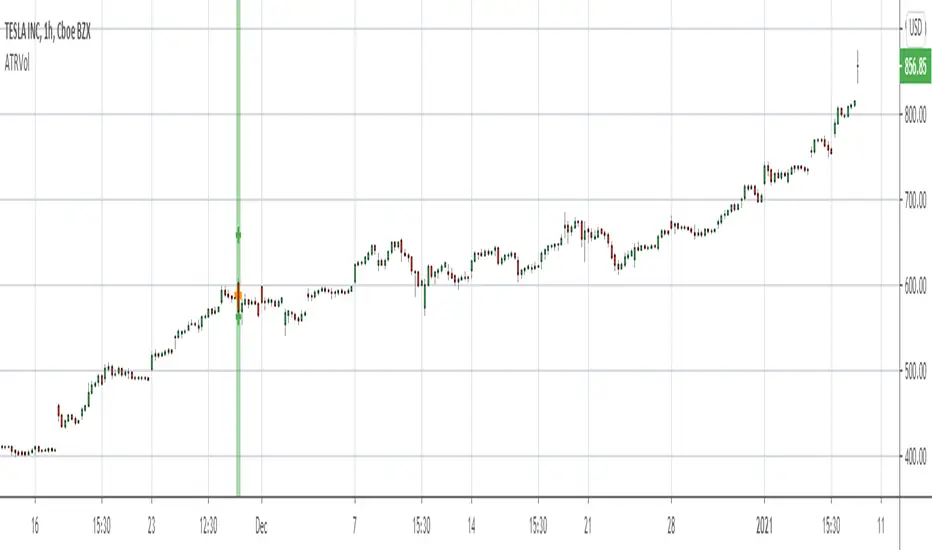
ATR Volatility Bars 1.0This script will be featured in upcoming video ideas about catching liquidations spikes in cryptocurrencies.
The script measures the unique size of each bar compared to the Average True Range (ATR) of the evaluation period. The evaluation period can be set in the inputs. The desired benchmark for what will be highlighted is also set in the inputs as a percentage. The default settings are to evaluate the last 26 bars for ATR and highlight bars that are 300% or larger than ATR.
When a bar meets the criteria of the indicator it will show a label and highlight the bar accordingly. The user may select the indicator to only show Buy or Sell opportunities. The indicator has alert functionality.
[JRL] ATR Pivot PointsThis indicator plots pivot points with support and resistance lines based on average true range (ATR). ATR is one of the best volatility and trading range predictors, so it can be very useful for finding confluence in any strategy.

Indicator - ATR Profit Loss - DGHi Traders,
This is an on chart indicator that can be used for setting take profit and stop losses very easily using the Average True Range Indicator (ATR). Using a volatility adjusted TP and SL will allow you to set your targets and losses based on market conditions. In the settings, you are able to adjust how much of a multiplier you require depending on your risk tolerance and strategy. For those that follow the NNFX method, the defult settings are preset to 1xATR TP and 1.5xATR SL.
How to use:
- For longs, 'isLong' box must be ticked, for shorts, this box is unticked
- For longs, green line is TP, red line is SL
- For shorts, red line is TP, green line is SL
Regards,
Dillon Grech

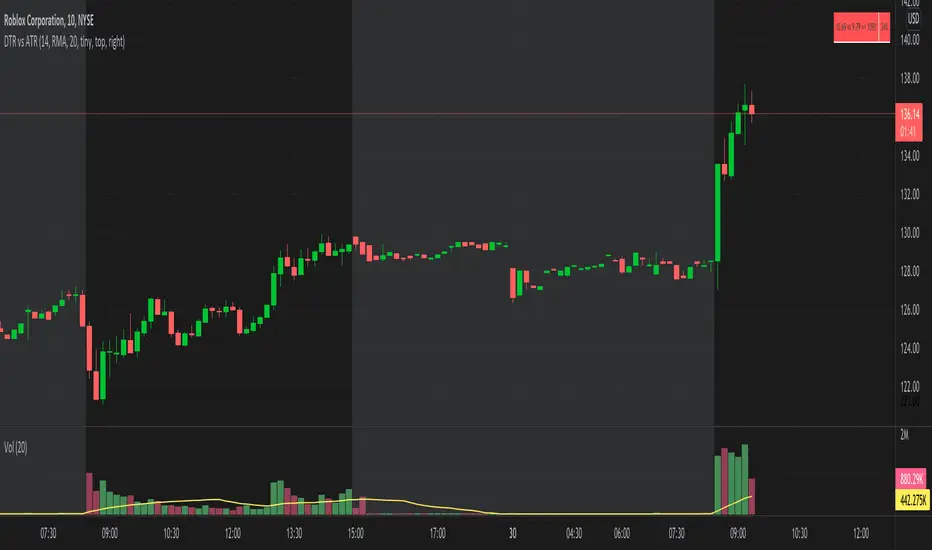
DTR vs ATR w RVolDTR vs ART along with Relative Volume in Percentage. So if you see RVol as 200% with input length of 10 days, today's volume is 2x compared to past 10 days. It helps if today's volume is already reached 20% or 30% within 30mins of market open, etc.
ALMA PPO with Volume Weighted ATR BandsAlma PPO with a percentile eq and atr bands using volume weighted alma. Volume weighted alma idea from rumpypumpydumpy. All code is from the open source library.

PMax on RSI with Tillson T3Profit Maximizer Indicator on RSI with Tillson T3 Moving Average:
PMax uses ATR calculation inside, for this reason users couldn't manage to use PMax on RSI because RSI indicator doesn't have High and Low values in bars, but ATR needs that values. So I personally calculate RSI in a different way to have High and Low values of RSI wrt price bars.
IMPORTANT:
Because of the sudden movements and divergences on RSI, this indicator must firstly optimized for the charts before using. Optimization can be held by users for the meaningful parameters for each chart.
3 parameters are critical when optimizing:
First: Multiplier
Second: Tillson T3 Length
Third: T3 Volume Factor
Here are some information about Profit Maximizer:
PMax Indicator:
PMax Screener and Strategy:

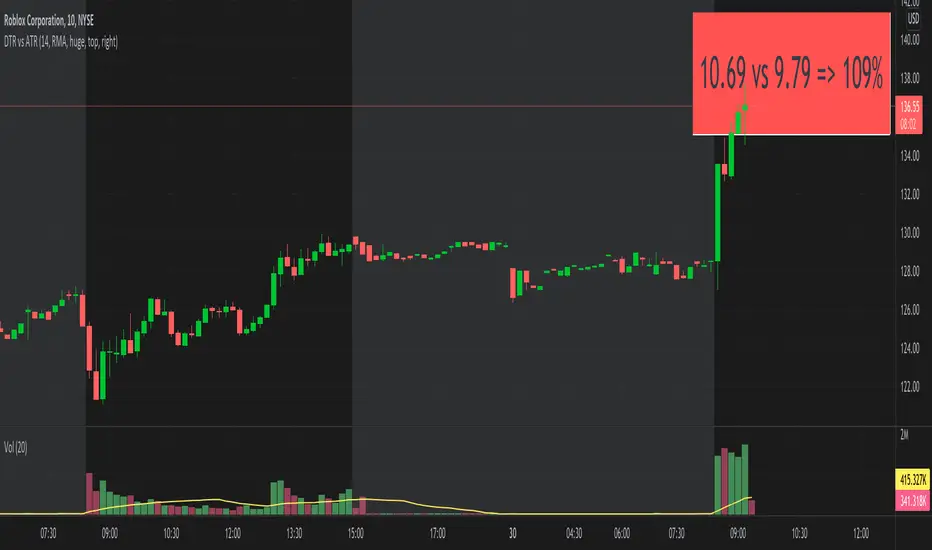
DTR vs ATRThis script shows DTR vs ATR (Today's True Range vs 14 days Avg True Range) along with percentage. The label automatically changes color based on percent value. <=70 is GREEN, >=90 is RED and between 70 & 90 is ORANGE.
The location of the script not stick to one place. There is no such a functionality to keep it static at one location (like top right corner). But I think that feature is coming soon. I may be wrong.
Daily GAP StatsI did not write the script from scratch but rather started editing code of an existing one. The original code came from a script called GAP DETECTOR by @Asch-
First up: I am a trader, not a programmer and therefore my code most likely is inefficient. If someone with more expertise would like to help and optimize it - feel free to get in touch, I am always happy to learn some new tricks. :)
This script does 2 things:
- It shows daily gaps stats based on user inputs
- It shows color coded labels on gap days with additional information in tooltips ( important: make sure to read 'known issues/limitations' at the end )
User Inputs
==========
Although the input dialog is pretty straight forward, I do a quick rundown:
- Length: max lookback time
- Gap Direction: self explanatory
- Show All Gaps | Cont Only | Reversal Only | Off:
This refers to the way labels are displayed on gap days (again: make sure to read known issues/limitations!)
- Show All Gaps: does what it says
- Cont Only: only shows gaps where price continued in the gap direction. If you filter for gap ups and chose 'Cont only' you will only see labels on gap days where price closed above the open (and vice versa if you scan for gap downs).
- Reversal Only: you will only see labels for closes below the open on gap up days (and the opposite on gap down days)
- Off: self explanatory
- Gap Measure in ATR/PCT: self explanatory, ATR is calculated over a 10d period
- Gap Size (Abs Values): no negative values allowed here. If you filter for gap downs and enter 3 it means it will show gaps where the stock fell more than 3 ATR/PCT on the open.
- RVOL Factor: along with significant gaps should come significant volume. RVOL = volume of the gap day / 20d average volume
- Viewing Options: Placing the stats label in the window is a bit tricky (see knonw issues/limitations) and I was not sure which way I liked better. See for yourself what works best for you.
Known Isusses/Limitations:
=======================
- Positioning of the stats table:
As to my knowledge, Tradingview only allows label positioning relative to price and not relative to the chart window. I tried to always display the gap stats table in the upper right corner, using 52wk high as y-coordinate. This works ok most of the time, but is not pretty. If anybody has some fancy way to tag the label in a fixed position, please get in touch.
- Max number of labels per script:
TradingView has a limitation that allows a maxium of ~50 labels per script. If there are more labels, TradingView will automatically cut the oldest ones, without any notification. I have found this behaviour to be rather inconsistent - sometimes it'll dump labels even if there are a lot fewer than 50. Hopefully TradingView will drop this limitation at one point in the future.
Important: The inconsistent display of the gap day labels has NO INFLUENCE on the calculations in the gap stats table - the count and the calculations are complete and correct!

Chandelier Exit | SAR/Long Only (4CUP)As introduced by StockCharts.com, Chandelier Exit was developed by Charles Le Beau and featured in Alexander Elder's books, this sets a trailing stop-loss based on the Average True Range (ATR).
Chandelier Exit can be formulated as a stop-and-reverse (SAR) or as a traditional trailing stop-loss version shown by Stockcharts.com.
The main difference is that, in SAR version, the indicator is usually formulated in a higher of previous or spot indicator (HPS) for long and lower of previous and spot indicator (LPS) for short position.
This indicator is coded to show both the SAR version and the traditional one shown by Stockcharts.com (for long position) by simply clicking a tick in the Version box.
The ATR multiplier is relaxed to allow non-integer input, like 3.5, 4.25, ... for a greater flexibility to tailor your best-fit exit strategy.
If you find this indicator is useful to you, Star it, Follow, Donate, Like and Share.
Your support is a highly motivation for me.
Minimum Average True RangeI use ATR a lot when designing trading strategies, this way the strategy adjusts to the instrument in most cases instead of me plugging in special numbers.
However, ATR itself could get spiked by some violent moves. For this I have created MinATR which I am publishing here.
It is effectively ATR + minimum ATR over the last "Min Length" bars. (this is a parameter which I have defaulted to 50).
So use this the same way you use ATR, but it will also show the min ATR over the last "Min Length" periods.

ATR SL Buy/Sell w/ SMAsFirstly I'd like to state that this script's ATR buy/sell source is from the public script library here:
Additionally with the buy/sell signals from the original script, two more buy/sell conditions were added to give more entries/scaling in or out options. On top of that, two SMA lines were added, a 1 day moving average and a 5 day moving average.
This script is more so designed for scalping/scaling in and out of positions already made.
The SMAs add a level of confidence to the entry order, buy/sell triggers are not based on these SMAs.
For the confirmation on the entry, ideally you want a bullish cross on the SMAs, as well as the color of the SMA to correlate to the buy/sell color.

ATR_percentATR_percent is an indicator that i have created to find and be ready for volatility in stock or index. Works best in the 15 min time frame. Use case can be for Nifty and Banknifty.
Basically, whenever the ATR _percent line leaves the yellow line for upwards, market is falling. While if it is heading downwards, the market is rising.

Renko MTF - Traditional and ATRSomehow there aren't too many renko bars that have the traditional setting built-in so I put one up. This one has the option to choose between Traditional and ATR, the size number corresponds to the option that was chosen. And just in case if anyone wanted, I put up a multi-time frame option to choose the time frame the bars take place. D is for day, W is for week, flat numbers are in minutes, and leaving it blank looks at the current time frame the chart is in. The calculation comes from how Tradingview handles renko bars.
Renko bars don't paint a color unless the market moves a certain amount based on its settings. When the market moves up it turns green, if it moves down it turns red, simple color changes alone can say a lot. They're a good way to try to find trends somewhat objectively and seem to be a good way to eliminate time and can replace other time-based indicators that can whipsaw or lag. The bars have a tendency to repeat themselves so it's a good way to find trends. There aren't too many settings for the box size, most people either just choose 5, 10, 14, etc where as other indicators have many options that differ on different markets. The numbers can be chosen easily enough to pick a sweet spot with just a single input where other indicators such as MACD have multiple inputs to pick the right number that can make it difficult to choose from(although it won't be as precise as a MACD would sometimes but can be worth the objectiveness and consistency and same setting repeatability in different markets in my opinion). Some example strategies could be to use them as an alternative trailing stop, finding trends, a simple color change for entry and exit on top of other strategies, etc. It can do the job of many in an all in one price action type indicator(although not better all the time, it can come close enough). Despite all this, it does seem to depend on which time-frame it's being looked at, how TV does the calculation for it, and how one can use this with the lack of practical information on it out there.

Volatility Support & Resistance [LM]Hello guys,
I would like to introduce you volatility support and resistance horizontals. It draws line horizontal on high and low vhighly volatile candles. You can select lines on this timeframe and/or another one. It's done in the same spirit like my other indicators for horizontals
The colors are dynamic depending whether price is below or above the line:
for the current timeframe green is used for support and blue for resistance
for the other timeframe by default 4h orange is used for support and violet for resistance
There are various sections in setting:
general settings - here you can select ATR length, multiplier and show labels
show and hide section of the current timeframe
other timeframe
show and hide other timeframe horizontals
Any suggestions are welcome

ATR TRex [ipooya]To appreciate dear Mr.Khakestar efforts I have converted his mt4 ATR formula to pine script. All credits go to him.
you can view the ATR result of each candle in the past:
The first black number is the ATR of the M1 chart.
The second black number is the ATR of the M5chart.
The third black number is the ATR of the M15 chart.
The fourth black number is the ATR of the H1 chart.
The fifth black number is the ATR of the H4 chart.
The sixth black number is the ATR of the Daily chart.
The seventh black number is the ATR of the Weekly chart.
**and the second number of every line is live ATR ( current ATR candle)
What makes this ATR formula so different?
This formula invented by Mr.Khakestar and it shows the power of the price to move in each cycle of the chart. We can use it in RTM strategy and Price Action trading. To learn how to use it you need to learn TRex strategy (Presented by Mr.Khakestart for free in Persian).
