FBMAEN:
TradingView indicator for FBMA strategy
People oftem ask: “Dmitry, BABA, TSLA, AAPL flies like a rocket! Well, what are we buying!?” - And I say no, the price does not act like a straight rocket upwards or downwards, instead it breathes, inhales moving away from the moving average and exhales returning to it, so we will wait for the first pullback and buy exactly at the value of the moving average.
Your new paradigm: wait for the stock to pull back to the moving average rather than chasing the price
And one more thing... Remember, you don't want to buy a stock when it's going down, you'll start to have doubts. it's against human nature to go long when the price is falling, but that's why this strategy works so well. We buy on the price rollback (pullback to the moving average), but we DO IT WHILE FOLLOWING THE TREND.
The biggest consequence of this strategy, my author's FBMA strategy and this is a game changer (results are in the comments).
So, let's dive into FBMA indicator settings:
Main settings
ATR Period — Period of intergrated ATR Indicator(shows ATR in a small dashboard);
Settings of Moving Averages
Sign Moving Averages? — shows values of moving averages near their lines on the chart;
Fix MAs' signatures overlapping? — automatically MAs' signatures overlapping (specifically for SMAs and EMAs!) ;
Fix MAs' signatures overlapping between SMAs and EMAs? — automatically group overlapping between EMAs' and SMAs' signatures;
Min distance between MAs' signatures (in % of ATR) — minimal distance between MAs' signatures that indicator will push away MAs' signatures from each other if they are overlapped;
Dashboard
Dashboard position — position of dashboard on the chart ( 9 options ).
Settings of MAs
Source;
Period;
Option for showing EMA and/or SMA of chosen period and source;
Line colour ;
Signature colour .
Addons
Show data by selected timeframe? — shows difference of current price opening and opening a "timeframe" time ago;
Shows MAs only if asset has grown by selected growth % in selected timeframe?
Growth, % — percent, which asset has to gain in order for MAs to be plotted;
Timeframe — frequency with which price's current and previous opening are being will be compared;
Show analog MAs' signatures? — shows MAs' value in a small table;
Show cloud between 1st and 2nd MAs? — shows cloud for both EMAs and SMAs simultaneously).
Price Action
This settings are intuitively understandable
Feel free to leave your questions or suggestions in the comments!
* Price Action-section was taken from ChrisMoody's CM_Price_Action and rebuilt.
RU:
Индикатор TradingView для стратегии ПООС
Мне часто пишут в личку: “Дмитрий, BABA, TSLA , AAPL летит ракетой! Ну что покупаем!?”- А я говорю нет, цена не летит по прямой ракетой вверх, она дышит, делает вдохи отдаляясь от скользящей и выдохи возвращаясь к ней, поэтому мы дождёмся первого пуллбэка и купим точно на значении скользящей
Ваша новая парадигма: ждать акцию на пуллбэке к скользящей по тренду, а не гнаться за ценой
И ещё… Помните, вы не захотите покупать акцию в момент, когда она падает, вы начнете сомневаться т.к. это против человеческой природы заходить в лонг при падении цены, но именно поэтому эта стратегия работает так эффективно, т.к. мы покупаем на откате цены (пуллбэке к скользящей), но ПО ТРЕНДУ
Самое большее следствие из этой стратегии, моя авторская стратегия ПООС и это гейм-чейнджер (результаты в комментариях).
Итак, давайте посмотрим сами настройки индикатора:
Основные настройки
ATR Period — период интегрированного индикатора ATR (показывает ATR на небольшой панели);
Настройки скользящих средних
Sign Moving Averages? — показывает значения скользящих средних рядом с их линиями на графике;
Исправить перекрытие сигнатур МА? — автоматически сигнатуры СС перекрываются (специально для SMA и EMA!) ;
Исправить перекрытие сигнатур МА между SMA и EMA? — автоматически группировать перекрытие между сигнатурами EMA и SMA;
Минимальное расстояние между сигнатурами скользящих средних (в % от ATR) — минимальное расстояние между сигнатурами скользящих средних, при котором индикатор будет отталкивать сигнатуры скользящих средних друг от друга, если они перекрываются;
Панель управления
Dashboard position — положение таблицы на графике ( 9 вариантов ).
Настройки МА
Source;
Период;
Опция отображения EMA и/или SMA выбранного периода и source;
Цвет линии ;
Цвет подписи .
Дополнения
Показать данные по выбранному таймфрейму? — показывает разницу текущей цены открытия и цены открытия в прошлом, по времени равному величины параметра "Таймфрейм";
Показывает MA только в том случае, если актив вырос на выбранный % роста за выбранный период времени?
Прирост, % — процент, на который актив должен набраться, чтобы скользящие средние были построены;
Таймфрейм — частота, с которой будет сравниваться текущее и предыдущее открытие цены;
Показать сигнатуры аналоговых МА? — показывает значение МА в небольшой таблице;
Показать облако между 1-й и 2-й скользящими средними? — показывает облако для EMA и SMA одновременно).
Price Action
Эти настройки будут интуитивно понятны
Оставляете свои вопросы и предложения в комментариях, всё учтём!
* Price Action-section was taken from ChrisMoody's CM_Price_Action and rebuilt.
ATR

AutoLevelsAuto Levels is a Work in progress.
It is based on the previous days ATR and the current days opening tick.
It takes that info and uses Fibonacci to automatically draw key levels for the day.
I have added the BULL BAR ( Green bar ) and Bear Bar ( Red Bar ) to signal as a Go Long / Go Short line in the sand.
The Tan bars are also proven key "Take Profit" levels.
These are, on average, major points of reversals, dip buys or consolidation.
I use this on the 5min timeframe and a close above or below a key level is my signal and direction. Auto Levels have proven to be a great indicator of major support and resistance.

[-_-] Volatility Calibrated ATRDescription:
An indicator based on ATR adjusted for volatility of the market. It uses Heikin Ashi data to find short and long opportunities and displays a dynamic stop loss level. Additionally, it has alerts for when the trend changes (which is an entry signal).
How it works:
It works by dynamically calculating the Period for ATR which depends on current volatility level that is calculated by a function that uses Standard Deviation of price. ATR is then smoothed by Weighted Moving Average and multiplied by ATR Factor, resulting in a plot that changes its colour to red when we're in a downtrend and green when in an uptrend. This plot should be used as a dynamic Stop Loss level. Trend change is determined by price crossing the dynamic Stop Loss level. The squared red and green labels appear when the trend changes, and should be used as Entry signals.
Parameters:
- Source -> data used for calculations
- ATR Factor -> higher values produce less noise and longer trends, lower values give more signals

Correlated ATR Bands | AdulariHow do I use it?
Never use this indicator as standalone trading signal, it should be used as confluence.
It is highly recommended to use this indicator on the 15m timeframe and above, try experimenting with the inverse feature and multipliers as well.
When the price is above the moving average this shows the bullish trend is strong.
When the price is below the moving average this shows the bearish trend is strong.
When the moving average is purple, the trend is bullish , when it is gray, the trend is bearish.
When price is above the upper band this may indicate a bearish reversal.
When price is below the lower band this may indicate a bullish reversal.
Features:
Purple line for bullish trend and gray line for bearish trend.
Custom formula combining an ATR and Hull MA to clearly indicate trend strength and direction.
Unique approach to moving averages and bands by taking the average of 2 types of MA's combined with custom ATR's, then multiplying these by correlation factors.
Bands to indicate possible trend reversals when price crosses them.
How does it work?
1 — ATR value is calculated, then the correlation between the source and ATR is calculated.
2 — Final value is calculated using the following formula:
correlation * atr + (1 - correlation) * nz(atr , atr)
3 — Moving average is calculated with the following formula:
ta.hma((1-(correlation/100*(1+weight/10)))*(ta.sma(source+value, smoothing)+ta.sma(source-value,smoothing))/2,flength)
4 — Bands calculation using multipliers.

Average True Range Refurbished💡 Objective
This script is a rebuild of the pre-existing ATR indicator, with improvements and fine-tuning.
🪄Improvements
1. Normalization option (range 0 to 100)
2. Optional calculation of the ratio between current volatility and average volatility
3. Optional smoothing
4. Show a moving average
5. Show Bollinger Bands with 3 bands
6. Change bar colors according to ATR and Bollinger Bands
📚 Definition
'The Average True Range (ATR) is a tool used in technical analysis to measure volatility. Unlike many of today's popular indicators, the ATR is not used to indicate the direction of price. Rather, it is a metric used solely to measure volatility, especially volatility caused by price gaps or limit moves.'
(TradingView)

Correlated ATR MA | AdulariHow do I use it?
Never use this indicator as standalone trading signal, it should be used as confluence.
When the price is above the moving average this shows the bullish trend is strong.
When the price is below the moving average this shows the bearish trend is strong.
When the moving average is purple, the trend is bullish, when it is gray, the trend is bearish.
Features:
Purple line for bullish trend and gray line for bearish trend.
Custom formula combining an ATR and Hull MA to clearly indicate trend strength and direction.
Unique approach to moving averages by taking the average of 3 types of MA's combined with custom ATR's.
How does it work?
1 — ATR value is calculated, then the correlation between the source and ATR is calculated.
2 — Signal value is calculated from the difference between the previous source and ATR values.
3 — Final value is being calculated using the following formula:
cor * target + (1 - cor) * nz(atr , target)
4 — Moving average is calculated by getting the average of 3 values: a normal HMA, HMA plus final value, and HMA minus final value.

ATR & APCAverage True Range (ATR) and Average Price Change (APC). Shows the ATR and APC as well as the TR and PC for the current bar, colour coded to indicate very large/small bars. The ATR and APC are also colour coded to reflect whether they are increasing or decreasing. Style will need to be customized.

Interactive SAR Stop-Loss [TANHEF]This indicator is "Interactive" which means some inputs can are manually added through the first click after adding the indicator to the chart (SAR Trailing Stop-loss start point).
Unlike the normal Parabolic SAR, this indicator allows for the modification of the start point of the Parabolic SAR’s first bar calculation. Normally, the Parabolic SAR automatically has a start point after the first bar of an asset’s historical price that will then switch between trailing above and below price respectively. It must be noted that due to how the first position of the Parabolic SAR is calculated, on occasion the Parabolic SAR will immediately flip on the next bar to the opposite side relative to price that it was just located. Modifying the setting “⭐Initial Interactive SAR Position Source”, then selecting either 'Clicked' or 'ATR' level as the vertical start position will prevent this. See images below for more explanation.
Why use a trailing stop-loss?
A trailing stop-loss provides an exit when price moves against you but also enables you to move the exit point further into profit when price is moving in the desired direction of a trade. The Parabolic SAR ( stop and reverse ) which is used to determine price direction as well as when price direction is changing, is very effective at functioning as a trailing stop loss.
Indicator Explanation
Initially when this indicator is added to the chart, you will be prompted to select where to begin the SAR Trailing Stop-loss.
For a long stop-loss, select below price.
For a short stop-loss, select above price.
After this indicator is placed, it can be modified via dragging or from within the settings by modifying the time and the price input. Or simply re-add the indicator to the chart. Another option is to have this Parabolic SAR begin directly on the price that was initially ‘Clicked’ or the ‘ATR’ level, which requires selecting the option in settings labeled “⭐Initial Interactive SAR Position Source”
The SAR Stop Loss plotted. Note that the calculation that occurs on this first bar of the ‘Interactive SAR’ is as if the prior bar was the oldest historical bar of the asset. Due to the SAR’s calculations, if the ‘Normal SAR’ were to also flip sides over to the position that has been manually set for the ‘Interactive SAR’, they won’t necessarily have the same result.
An optional fixed profit target can be added within the settings. This profit target will only actively be plotted when the SAR Trailing Stop-loss has not be hit yet or until the profit target has been hit.
Here shows that the profit target was hit, then later on the SAR Trailing Stop-loss was hit.
Note, trailing stop-loss will continue to be plotted until it has been hit regardless of the profit target being hit or not.
Here is an example of when the Parabolic SAR will immediately flip on the next bar to the opposite side relative to price that it was just first located. This is due to how the Parabolic SAR is calculated and will also occur with the traditional Parabolic SAR that is not interactively (manually) given a start location. To prevent this, either relocate this time in which this SAR beings or consider modifying the SAR’s (start, increment, max) settings specifically.
Here instead of using the SAR’s calculation for an initial bar, the ‘ATR’ was selected as the start point within the setting “⭐Initial Interactive SAR Position Source”.
Alerts
1. 'Check' alerts to use within indicator settings (trailing stop hit and/or profit target hit).
2. Select 'Create Alert'
3. Set the condition to 'Interactive SAR''
4. Select create.

Trend & atr day & calcHi!
Why for what and how in this script?
At the time of publication the script consists of three modules, it may increase in the future.
1. Bottom left corner : daytime ATR module
(idea and basis of the author's script - ???)
- The size of the daily ATR based on 14 bars;
- intraday ATR progress;
- colour indication of the progress status, for easier visual perception (green < 70%, yellow 70-90 and red over 90% of ATR)
By evaluating the progress of the daily ATR, it is possible to suggest and expedient to enter/exit/hold a trade.
2. Top right: trend module
The trend is calculated based on Bill Williams' alligator indicator
- trend status on specified timeframes for the current ticker;
- colour indication for visual perception (green - growing trend, yellow - alligator is sleeping, red - downtrend)
Do not forget that the alligator is based on moving averages with the resulting consequences.
Its purpose is to assess the state of the trend on other ticker TFs, without additional actions (switching to another screen or TF)
3. In the bottom left corner - risk and position calculator
(based on an idea of the risk calculator by @andrei.bunulu)
It helps to determine the advisability of entering the trade and also what size position to enter into the trade, within money management strategy chosen.
- The calculator works in two directions: long deal and short deal (short deal calculation is enabled by check-box in settings)
- two calculation methods:
a. based on the set stop loss % (default is 0.3%), in this mode the stop and takeout level is automatically calculated (default is 1 / 3).
b. by entering the desired price levels (entry, stop and take profit points)
To make this work correctly please do not forget to choose the type of calculation (% or price) in the settings, and the currency symbol (for visual representation in the results).
The calculator can take into account the set commissions and spreads.
When hovering over the module - tooltips are displayed.
Each module can be enabled / disabled in the settings.
The size and arrangement of the modules is made for joint use with the script - "Abnormal Bar".
/// а по-русски это так ///
Привет!
Зачем для чего и как в этом скрипте?
На момент публикации скрипт состоит из трех модулей, возможно в будущем увеличится.
1. В левом нижнем углу : модуль дневного ATR
(идея и основа скрипт автора - ???)
- размер дневной ATR на основании 14 баров;
- прогресс ATR внутри дня;
- цветовая индикация состояния прогресса, для более простого визуального восприятия (зеленый < 70%, желтый 70-90 и красный более 90% ATR)
Оценивая прогресс дневного ATR, можно предположить и целесообразности входа / выхода / удержания из сделки.
2. В правом верхнем углу: модуль тренда
Тренд рассчитывается на основе индикатора - аллигатор Билла Вильямса
- состояние тренда на указанных таймфреймах для текущего тикера;
- цветовая индикация для визуального восприятия (зеленый - растущий тренд, желтый - аллигатор спит, красный - нисходящий тренд)
Не забываем, что аллигатор построен на основе скользящих средних с вытекающими последствиями.
Назначение - оценить состояние тренда на других ТФ тикера, без дополнительных действий (переключения на другой экран или ТФ)
3. В нижнем левом углу - калькулятор рисков и позиции
(на основе идеи калькулятора аuthor: @andrei.bunulu)
Помогает определить целесообразность входа в сделку, а также каким размером позиции входить в сделку, в рамках выбранной стратегии мани менеджмента.
- калькулятор работает в два направления: длинная и короткая сделка (расчет по короткой включается в настройках чек-боксом)
- два варианта расчета:
а. на основании установленного % стоп лосса (по-умолчанию 0,3%), при этом режиме происходит автоматический расчет уровня стопа и тейка (по умолчанию 1 / 3).
b. путем ввода данных желаемых уровней цены (точки входа, стопа и тейк профита)
Для корректной работы не забываем в настройках выбирать тип расчета (% или цена), а также символ валюты (для визуального отображения в итогах).
Калькулятор может учитывать установленный размер комиссий и спреда.
При наведении на модуль - отображаются подсказки.
Каждый модуль можно включить / выключить в настройках.
Размер и расположение модулей сделано для совместного использования со скриптом - "Abnormal Bar"

Q-TrendQ-Trend is an multipurpose indicatorm that can be used for swing- and trend-trading equally on any timeframe (non-volatile markets are better for this thing).
Settings:
Trend period - used to calculate trend line in the special moments(will explain below);
ATR Multiplier - changes sensitivity. The higher the multiplier = the more sensitive it is.
Also option to smooth source data (helps get cleaner signals, as always).
How to use?
Signals are given on the chart. Also ou can use trend line as S/R line.
The idea behind:
Terms:
SRС = Source
TL = trend line;
MP = ATR multiplier;
ATR = ATR :)
TL = (highest of source P-bars back + lowest of source P-bars back) / 2
Epsilon = MP * ATR
I was thinking for a week about combining volatility and relation between highest and lowest price point. That why I called indicator Q-Trend = Quantitative Trend , as I was trying to think about price in a mathematical way.
Okay, time to go philosophical:
1) TL is shows good price trend, but as it is slow enough and not enough informative, we need add additional conditions to produce signals.
2) Okay, so what can we add as conditions? We need to take volatility into account, as it is crucial in the moments of market uncertainty. So let's use ATR (Average True Range) somehow. My idea is that if SRC breaks TL + ATR , then it means that there will be upmove and we update our TL . Analogically for SRC breaking TL - ATR (breaks are crosses of TL +- ATR lines) .
Conclusion:
- if SRC breaks TL + ATR , it is a BUY signal and update of trend line;
- if SRC breaks TL - ATR , it is a SELL signal and update of trend line;
I think that such indicator already exisits on TradingView, as I've already saw something similar, but long ago, so please don't report, if such thing already exists.
But if not, then I hope, that you will gain some profits with Q-Trend :)
I will continue my work on this thing, so stay tuned.
Trade with your own risks and have your profits!
Wish you all the best!
- Tarasenko Fyodor

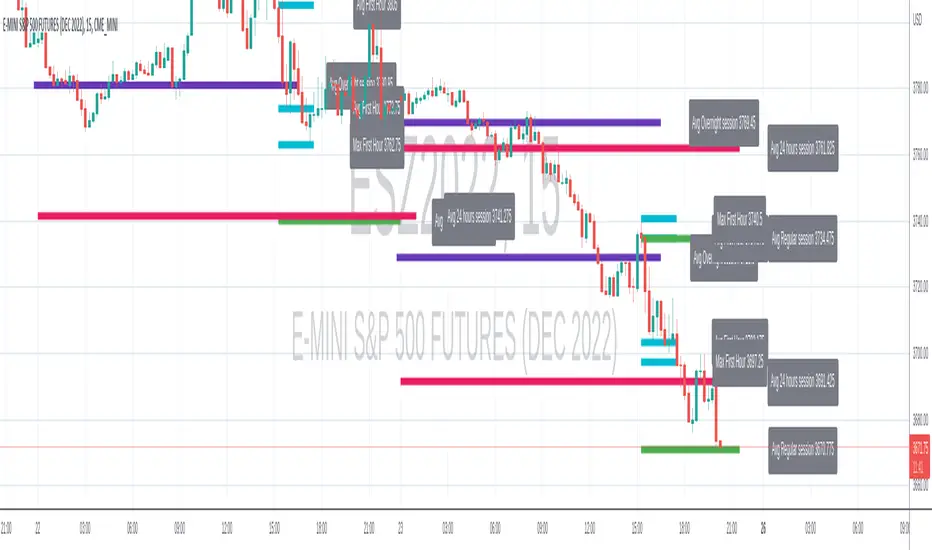
ATR+ Advanced Sessions ATR for DaterangeATR+ Advanced Sessions ATR for Daterange
The ATR+ adds the following additional filters to the stock ATR indicator by Tradingview:
- Calculates the overall average ATR for a user defined daterange, optionally filtered by trading session and selected weekdays, presented as a secondary line over the standard ATR line.
- Basic ATR line, with colour highlight to indicate the selected sessions, days and timeframe being calculated by the average ATR+ line.
- Average ATR+ line indicating the average of all ATRs within the defined timeframe, optionally filtered by instances of a selected trading session and selected weekdays.
- Customisable appearance.
- The ATR+ also includes the basic ATR configuration options typically found in the standard ATR by Tradingview, including period length and smoothing type. Defaults are set to the factory standards: 14 length, RMA smoothing type.
What Is the Average True Range (ATR)?
The ATR is a technical analysis tool that measures market volatility by decomposing the entire range asset price for that period. Investopedia describes the ATR as follows:
"The average true range (ATR) is a technical analysis indicator, introduced by market technician J. Welles Wilder Jr. in his book New Concepts in Technical Trading Systems, that measures market volatility by decomposing the entire range of an asset price for that period.
The true range indicator is taken as the greatest of the following: current high less the current low; the absolute value of the current high less the previous close; and the absolute value of the current low less the previous close. The ATR is then a moving average, generally using 14 days, of the true ranges."
For more information on the ATR and its calculations and use cases, see here:
Investopedia link here.
Tradingview link here.
Note
The indicator may time out if the number of bars being calculated is too long. If this happens, you will need to reduce the datetime range, or increase the chart timeframe in order to reduce the number of bars being calculated and the indicator will attempt to recalculate.

Interactive ATR Stop-Loss [TANHEF]This indicator is "Interactive" which means some inputs can are manually added through the first click after adding the indicator to the chart (ATR Trailing Stop-loss start point). See images below for more explanation.
Why use a trailing stop-loss?
A trailing stop-loss provides an exit when price moves against you but also enables you to move the exit point further into profit when price is moving in the desired direction of a trade. The ATR (Average True Range) which is used to measure volatility, is very effective at functioning as a trailing stop loss.
Indicator Explanation
Initially when this indicator is added to the chart, you will be prompted to select where to begin the ATR Trailing Stop-loss.
For a long stop-loss, select below price.
For a short stop-loss, select above price.
After this indicator is placed, it can be modified via dragging or from within the settings by modifying the time and the price input. Or simply re-add the indicator to the chart.
The ATR Stop Loss plotted. Note that the trailing value that is considered as the stop loss value is the value of the ATR from the prior candle. The settings for the ATR calculation can be modified within the settings.
An optional fixed profit target can be added within the settings. This profit target will only actively be plotted when the ATR Trailing Stop-loss has not be hit hit yet or until the profit target has been hit.
Here shows that the profit target was hit, then later on the ATR Trailing Stop-loss was hit.
Note, trailing stop-loss will continue to be plotted until it has been hit regardless of the profit target being hit or not.
Alerts
1. 'Check' alerts to use within indicator settings (trailing stop hit and/or profit target hit).
2. Select 'Create Alert'
3. Set the condition to 'Interactive ATR''
4. Select create.

Didi ATR HybridThis is a hybrid indicator that combines the Didi Index with the Average True Range.
It acts as both an ATR and a Confirmation indicator, based on the No-Nonsense Forex (NNFX) trade rules.
The Didi Index takes three moving averages to build a fast line (MA1 and MA2) and a slow line (MA2 and MA3). You can use it several different ways (2 lines cross, zero-cross); in this setup, we only use the slow line with the zero-cross to produce a signal (source code is set up to take advantage of the fast line - you just need to plot it yourself).
ATR is a measure of candle volatility.
The plotted value is equal to the ATR, which then gets colored based on:
Black : Didi Index is below 0 - do not enter trade
Red : Didi Index is above 1, but the previous candle closed >1x ATR - do not enter trade (too volatile)
Green : Didi Index is above 1, and the previous candle closed <1x ATR - a possible trend is confirmed and you may enter the trade (use other indicators too)
The provided chart does not look exciting - as with NNFX, I am posting it with the OANDA:EURUSD , which is one of the harder FX pairs to trade.

Abnormal bar % v.1This script helps you find abnormal bars on the charts.
An abnormal bar is a bar that is larger than the adjacent bar by at least 50 percent.
The script can search for bars on any time frame.
The search for an abnormal bar, is possible in two ways:
- on the absolute value, for example - all that is higher than 0.5% is considered an abnormal bar, on different timeframes it is necessary to change the percentage values;
- on the basis of the ATR, in my opinion it is a more objective result.
In the settings available:
- choice of color to display percentages on the screen;
- choice of calculation method;
- Selecting the value - what is considered an abnormal bar.
======
Данный скрипт помогает найти на графиках аномальные бары.
Аномальный бар - это бар который, больше рядом стоящего бара как минимум на 50 процентов.
Скрипт может искать бары на любом тайм-фрейма.
Поиск аномального бара, возможен в двух вариантах:
- по абсолютному значению, например - всё что выше 0.5%, считается аномальным баром, на разных тайм-фреймах нужно менять значения процентов;
- на основание ATR, на мой взгляд это более объективный результат.
В настройках доступно:
- выбор цвета для отображения процентов на экране;
- выбор способа поиска;
- выбор значения - что считаем аномальным баром.
==

Higher Time Frame Average True RangesPurpose: This script will help an options trader asses risk and determine good entry and exit strategies
Background Information: The true range is the greatest of: current high minus the current low; the absolute value of the current high minus the previous close; and the absolute value of the current low minus the previous close. The Average True Range (ATR) is a 14-day moving average of the true range. Traders use the ATR indicator to assess volatility in stocks and decide when to enter and exit trades. It is important to note the limitations of using True Range and ATR: These indications cannot tell you the direction of your options trade (call vs. put) and they cannot tell you whether a particular trend is about to reverse. However, it can be used to assess if volatility has peaked for a particular direction and time period.
How this script works: This indicator calculates true range for the daily (DTR), weekly (WTR), and monthly (MTR) time frames and compares it to the Average True Range (ATR) for each of those time frames (DATR, WATR, and MATR). The comparison is displayed into a colored table in the upper right-hand corner of the screen. When a daily, weekly, or monthly true range reaches 80% of its respective ATR, the row for that time frame will turn Orange indicating medium risk for staying in the trade. If the true range goes above 100% of the respective ATR, then the row will turn Red indicating high risk for staying in the trade. When the row for a time period turns red, volatility for the time period has likely peaked and traders should heavily consider taking profits. It is important to note these calculations start at different times for each time frame: Daily (Today’s Open), Weekly (Monday’s Open), Monthly (First of the Month’s Open). This means if it’s the 15th of the month then the Monthly True Range is being calculated for the trading days in the first half of the month (approximately 10 trade days).
The script also plots three sets of horizontal dotted lines to visually represent the ATR for each time period. Each set is generated by adding and subtracting the daily, weekly, and monthly ATRs from that time periods open price. For example, the weekly ATR is added and subtracted from Mondays open price to visually represent the true range for that week. The DATR is represented by red lines, the WATR is represented by the green lines, and the MATR is represented by the blue lines. These plots could also be used to assess risk as well.
How to use this script: Use the table to assess risk and determine potential exit strategies (Green=Low Risk, Orange=Medium Risk, Red=High Risk. Use the dotted lines to speculate what a stock’s price could be in a given time period (Daily=Red, Weekly=Green, and Monthly=Blue). And don’t forget the true range’s calculation and plots starts at the beginning of each time period!

Attrition Scalper v2.0Green/Red Arrowed Buy/Sell signals are just simple buy sell signals based on SuperTrend, VWAP, Bollinger, Linear Regression
Purple Arrowed Buy/Sell Signals happen when the price/candle cross over or under the yellow outer lines (4.236 fib lines) It's extremely rare and hard for price to stay above these lines therefore we can usually and comfortably buy/sell it, a key information here though when price pumps or dumps super fast and hard to the point of crossing these borders, the trend might also be extremely strong and continous so even if the price temporarily goes back inside the borders as the lines expand over time price can continue riding or crossing these lines back again and continue the uptrend/downtrend, therefore crossing these outer borders doesn't necessarilly and always mean a reversal is due.
When analyzing the instrument you're trading the important factors for support/resistance areas are usually the outer lines like i said previously it's super hard for price to be outside these and will almost always get back inside quickly. The Middle thicker green/red line which is Variable Index Dynamic Average should also be a nice pivot line for major support and resistance . All the other lines are also important dynamic support/resistance lines.
Their Importance Order
1- Outer Yellow Line (4.236 Fibs)
2- Thicker Middle Green/Red Line (VIDYA)
3- Thinner Upper/Lower Green/Red Line (VIDYA +3, VIDYA -3)
4- The Rest Of The Lines (Fib Lines)
You can use this indicator in any market condition in any market to determine key support/resistance levels, use it for mean reversion through price expanding to outside of the most outer line therefore being overbought/oversold basically using the purple buy/sell signals or only follow the normal buy/sell signals or use it in confluence with each other. You can also use this indicator in confluence with your own manual technical analysis or other indicators/strategies you are already using and are comfortable with.
A good part is the support/resistance lines from timeframe to timeframe pictures the whole situation quite well, you can use lower timeframe to find your entry/exit positions and higher timeframe to find your key support/resistance points, they all should be somewhat in confluence from timeframe to timeframe anyways. My recommendation would be to look at 1HR, 4HR and 1D charts for swing trading and 5-15 Min for quick scalping/day trading
You should still probably at least take a look to higher timeframes so that you don't get burned when you realize there is a huge resistance line at price XXXXX on the 4 hour chart but you're expecting it to go above it on the 5 minute chart, it can go above it temporarily but we analyze everything on a closing basis so it most likely won't close above it. Again don't take a position or FOMO when price breaks a support/resistance line, we're looking for a CLOSE above/below them and a retest to see if S/R flip happened would even be better.
Sometimes the most outer line won't be the 4.236 (Yellow) lines as when it gets quite volatile the Thinner Upper/Lower Green/Red Lines (VIDYA +3, VIDYA-3) might cross them to be the most outer line, in this case i have observed that the trend is extremely strong this time price almost always doesn't go above or below the VIDYA line but can stay outside of the Yellow 4.236 Fib line for an extended amount of time (price will still get back inside the channel relatively quickly, just not as fast as the normal condition)
With Proper Risk Management and Discipline this indicator can be of great use to you as it's surprisingly successful especially at mean reversion and pointing out the support/resistance lines, they are so much more successful than your average MA/EMA lines.

Auto SuperTrend+Based upon SuperTrend+ , this variation measures the volatility in order to determine the range of the trend.
Notes:
Upward volatility is measured separately from downward.
WMA is used for averaging to provide a recency bias.
Changing time-frames should display similar results as the settings are based upon time and not bars.

VolATRThis is my VolATR indicator. It fires Buy and Sell signals based on Volume and the ATR. Its pretty good at catching reversals and I like to use it to scalp the SPY . It doesn't provide tons of signals but the signals that it does are usually pretty accurate.

True Average Period Traded RangeTrue Average Period Trading Range (TAPTR)
The J. Welles Wilder Average True Range calculation includes the ability to calculate in gaps into the equation.
It is in my opinion that gaps are untraded range values until the prices on their own come back and close the gaps.
The TAPTR calculation is simple, it is the average for a set period of time of the HIGH - LOW.
The ATR average calculation is automatically set based on the timeframe period you are looking at.
12 Months (1 year) = 10 (1 decade)
Months = 12 (1 year)
Weeks = 12 (1 business quarter)
Days = 21 (1 trading month)
4 Hour = 9 (5 trading days)
1 Hour = 33 (5 trading days)
45 minutes = 9 (1 trading day)
30 minutes = 14 (1 trading day)
15 minutes = 28 (1 trading day)
10 minutes = 42 (1 trading day)
5 minutes = 85 (1 trading day)
1 minute = 420 (1 trading day)
default value = 21 (if using a timeframe not described above)
The "master trend" as being a 21 SMA.
The colored columns represent the actual range value for that time period.
Description of values from left to right.
1) Actual Trade Range Value for the time period you are viewing
2) % of price (in decimal, you need multiply by 100 to get the true percent)
3) Average Traded Range
4) % of price
5) .618 of Average Traded Range
6) % of price
7) Mean of #3 and #5
8) % of price
The % of price is displayed in its calculated form. You need to multiple the value by 100 if you want the actual percent.
Example: Displayed Value: 0.0246 = 2.46%
Why calculated form only? If the ranges are .72 and the % of price is 2.32 the indicator looks all jacked up like a redneck's pick-up.
However, if it is .0232, everything is to scale.
Why is % of price helpful?
If you are trading and are aware that average period traded range is 5%, you now have an idea of an average return if you could catch from low to high (or short high to low).
Bar Colors
RED is greater than 4.2x TAPTR
ORANGE is greater than 2.618x TAPTR but less than RED
YELLOW is greater than 1.618x TAPTR but less than ORANGE
GREEN is greater than .618x TAPTR but less than YELLOW
BLUE is less than GREEN
The colors of the bars represent how far from the Master Trend (21 SMA) the close is.
This is determined by taking the difference between the close and the 21 SMA and dividing by the current TAPTR.
EXAMPLE:
IF you have a RED bar, the close is greater than 4.2 TAPTRs away from the 21 SMA. This means that either prices will stall and remain flat until
the SMA comes to the prices or turn and return to the SMA.
If prices are greater than 4.2 TAPTR, that also represents that it is greater than 4 or more time periods from the mean if the return traded within the averages.

Buying & Selling PressureBuying and selling pressure is a volatility indicator which denotes the balance between buyers and sellers inside candlestick.
You set the length to average it just like ATR. But This offers further break down of participants of the market.
Pretty much at any condition of the market the indicator can filter out interesting details to make trading decisions faster or confirm them.
So keep it simple we have two lines
🟢 Green → buying pressure
🔴 Red → selling pressure
If green is rising → Price most likely will grow
If green is rising and red is falling → Price will grow at higher probability
If red is rising → Price most likely will fall
If red is rising and green is falling → Price will fall at higher probability
When they both grow or fall → wait till one of them goes opposite way.
╳ Crossings can indicate turning points for bigger price swings.
Technically by very act of intersecting means that Buying and Selling Pressure are equal.
Can be used for Demand/Supply analysis and evaluate the support/resistance levels.

Price LevelsAuto plots significant Gann and Fib price levels using the all time range. Useful to quickly identify significant levels of support and resistance.

Range-AnalysisMarkets usually tend to stay within a range during a specific time frame (for example first hour of the regular trading session, the whole regular trading session). For traders before initiating a trade it can be helpful to determine the range potential left for the targeted time frame. So they can decide to either try to ride the current trend further or fade the current trend in the case there is no range potential left for the specific time frame. This could be especially helpful for example in the E-Mini S&P future during the first hour.
The script calculates the average range for the last x days of the session defined and plots a line at the expected range extremes based on that average (for example: RangeExtremeHigh would be currentSessionLow+average Range of the last x days.
Any feedback is appreciated.
6 Multi-Timeframe Supertrend with Heikin Ashi as Source
This is a multiple multi-timeframe version of famous supertrernd only with Heikin Ashi as source. Atr which stands in the heart of supertrend is calculated based on heikin-ashi bars which omits a great deal of noises.
with 6 multiplication of the supertrend, its simply much easier to spot trend direction or use it as trailing stop with several levels available.
this is a great tool to assess and manage your risk and calculate your position volume if you use the heikin ashi supertrend as your stoploss.
