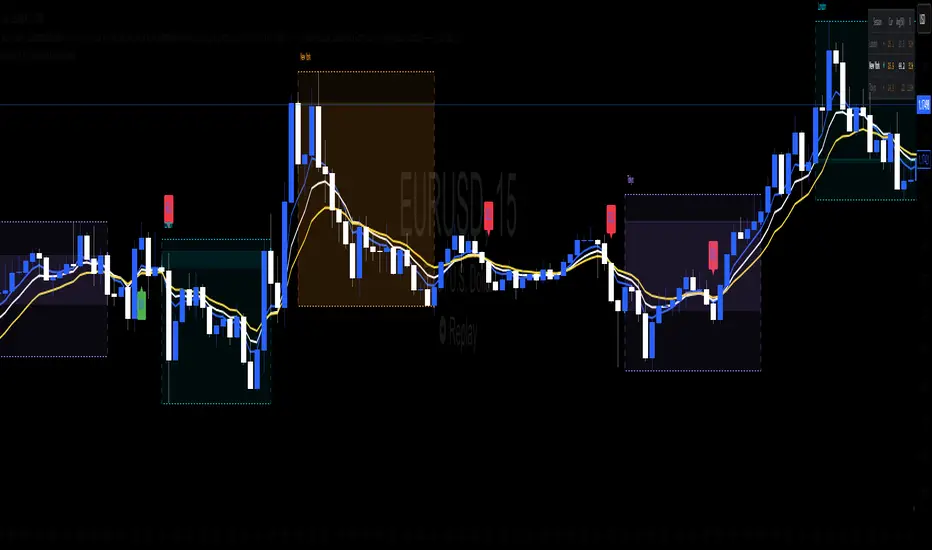
Liquidity Sweep & Reversal — Body Anchored + Risk (v6)Overview
The Liquidity Sweep & Reversal — Locked to Price (v6) indicator identifies liquidity sweeps around major swing highs and lows, confirming reversals when price closes back inside the swept level.
All signals are locked to price (bottom of green candle for BUY, top of red candle for SELL), so they remain perfectly aligned when zooming or scaling.
This indicator is ideal for swing traders and scalpers who trade reversals, liquidity events, and reclaim structures.
How It Works
Detects confirmed swing highs and lows using a pivot-based structure.
Waits for a liquidity sweep — when price wicks beyond a recent swing.
Confirms a reclaim when price closes back inside the previous swing level.
Triggers a BUY or SELL signal anchored to the candle body.
Automatically calculates stop loss and risk using ATR and your inputs.
Input Settings
Swing Detection
Swing Detection Strength: How many bars confirm a swing pivot. Higher = stronger swings.
Bars to Confirm Reclaim: Number of bars after a sweep for price to close back within the swing zone.
Swing Proximity %: How close price must come to a swing to count as a liquidity sweep.
Trend Filter (optional)
Use EMA Trend Filter: When enabled, only BUY in uptrend and SELL in downtrend.
Fast EMA Length / Slow EMA Length: Define EMAs used to detect trend direction.
Risk & Stop Management
ATR Length: Period for ATR calculation (volatility measurement).
Base ATR Stop Buffer (x ATR): Distance of stop loss from entry based on ATR multiplier.
Position Size (quote units): Your total position size in quote currency (e.g., USDT).
Risk % of (Position / 20): Defines how much of your position to risk per trade.
Example: (Position / 20) × Risk % = per-trade risk.
Chart Elements
BUY Arrow (green): Appears after a liquidity sweep and reclaim near a swing low.
SELL Arrow (red): Appears after a sweep and reclaim near a swing high.
Labels: Display entry price, stop loss (SL), and calculated risk dollar value.
EMAs: Optional fast/slow moving averages for directional bias.
Dynamic Stops: Adjust automatically using ATR × risk settings.
Trading Tips
Use BUY signals near liquidity sweeps under swing lows.
Use SELL signals near liquidity sweeps above swing highs.
Adjust swing length for different timeframes:
Lower values for scalping (3–5)
Higher values for swing trading (7–10)
Respect stop loss levels and use risk control settings for consistent sizing.
Combine with volume, OBV, or structure for confirmation.
Alerts
BUY — Locked to Price: "BUY: swing low reclaimed with dynamic stop."
SELL — Locked to Price: "SELL: swing high reclaimed with dynamic stop."
Best Use Cases
Liquidity-based reversals
Swing entry confirmation
Stop hunt reclaims
Structure-based entries
Author
Created by @roccodallas
For traders who value clean structure, risk control, and chart precision.
Bandes et canaux

MA99+MA200+MA400HMA+SLMA+HMA+SL,you can type your enter price,00000011111112222223333333444444455555666666
Multi Time Frame EMAsThree EMAs with the option to hide them on higher timeframes. Simple and easy to use.

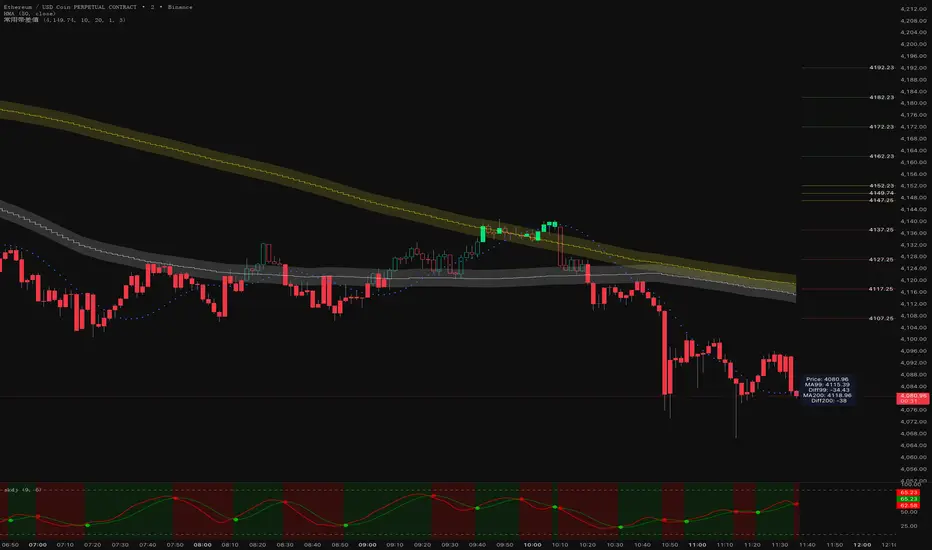
ATR Money Line Bands V2The "ATR Money Line Bands V2" is a clever TradingView overlay designed for trend identification with volatility-aware bands, evolving from basic ATR envelopes.
Reasoning Behind Construction: The core idea is to blend a smoothed trend line with dynamic volatility bands for reliable signals in varying markets. The "Money Line" uses linear regression (ta.linreg) on closes over a length (default 16) instead of a moving average, as it fits data via least-squares for a cleaner, forward-projected trend without lag artifacts. ATR (default 12-period) powers the bands because it measures true range volatility better than std dev in gappy assets like crypto/stocks—bands offset from the Money Line by ATR * multiplier (default 1.5). A dynamic multiplier (boosts by ~33% on spikes > prior ATR * 1.3) prevents tight bands from false breakouts during surges. Trend detection checks slope against an ATR-scaled tolerance (default 0.15) to ignore noise, labeling bull/bear/neutral—avoiding whipsaws in flats.
Properties: It's an overlay with a colored Money Line (green bull, red bear, yellow neutral) and invisible bands (toggle to show gray lines) filled semi-transparently matching trend for visual pop. Dynamic adaptation makes bands widen/contract intelligently. An info table (positionable, e.g., top_right) displays real-time values: Money Line, bands, ATR, trend—great for quick scans. Limits history (2000 bars) and labels (500) for efficiency.
Tips for Usage: Apply to any timeframe/asset; defaults suit medium-term (e.g., daily stocks). Watch color flips: green for longs (enter on pullbacks to lower band), red for shorts (vice versa), yellow to sit out. Use bands as S/R—breakouts signal momentum, squeezes impending vol. Tweak length for sensitivity (shorter for intraday), multiplier for width (higher for trends), tolerance for fewer neutrals. Pair with volume/RSI for confirmation; backtest to optimize. In choppy markets, disable dynamic mult to avoid over-expansion. Overall, it's adaptive and visual—helps trend-follow without overcomplicating.

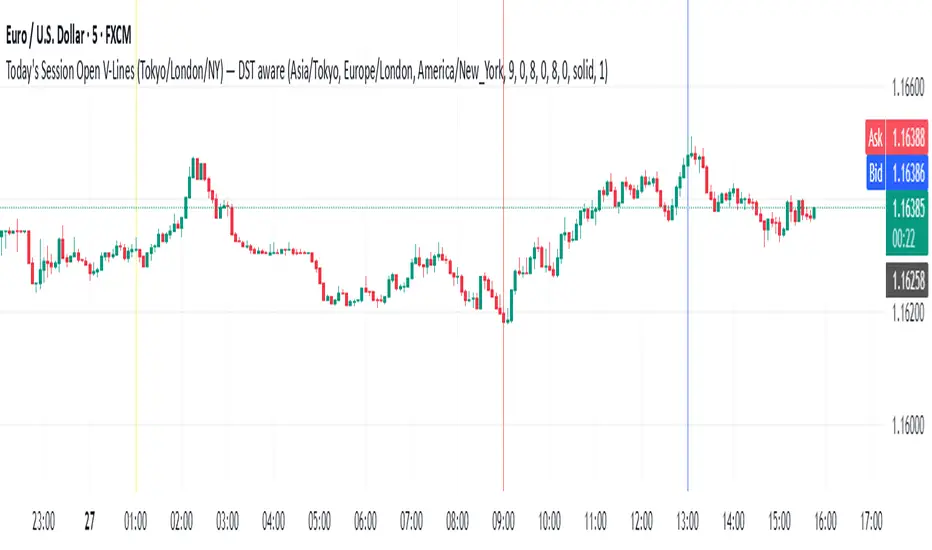
Todays Session Open LN,NYWhen are the Asian, London and New York open for each session simple stuff trading view made me right more stuff so i can publish this what to do c'est la vie
PDH & PDL Levels This indicator mark previous day high and low lines on current day. Lines will start at opening of the market and will remain there till end of the day. Lines are marked with PDH and PDL labels

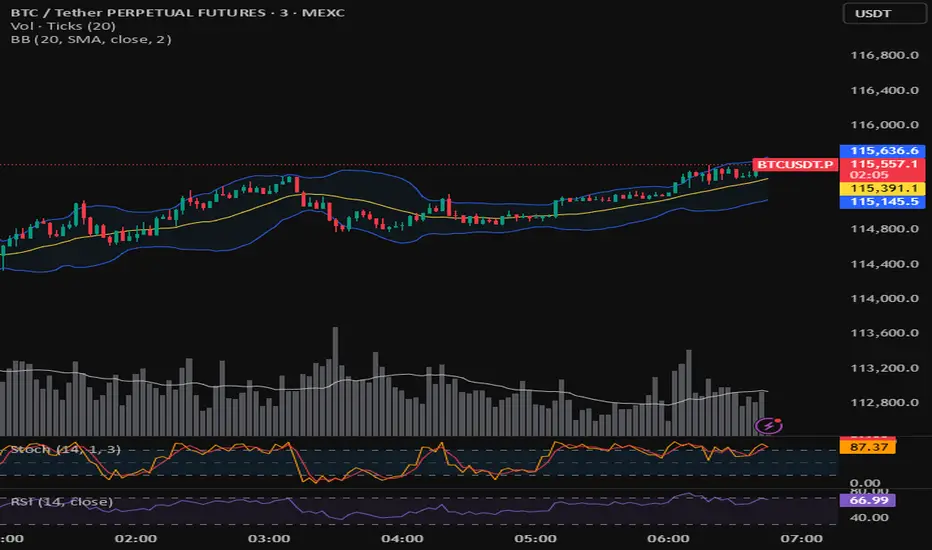
Bullish & Bearish Reversal Pattern with Sequential Bars20 Bollinger Bands and custom Stochasti_MTM Setup
Both long and short reversal signals.

Triple EMA (5, 8, 13) + Confirmed Alerts with SoundThis indicator uses three Exponential Moving Averages (EMA 5, 8, and 13) to generate buy and sell signals when the EMAs are properly aligned and not touching. Signals are confirmed on candle close and can trigger customizable sound alerts directly from the TradingView alert panel.
Reverse RSI LevelsSimple reverse RSI calculation
As default RSI values 30-50-70 are calculated into price.
This can be used similar to a bollinger band, but has also multiple other uses.
70 RSI works as overbought/resistance level.
50 RSI works as both support and resistance depending on the trend.
30 RSI works as oversold/support level.
Keep in mind that RSI levels can go extreme, specially in Crypto.
I haven't made it possible to adjust the default levels, but I've added 4 more calculations where you can plot reverse RSI calculations of your desired RSI values.
If you're a RSI geek, you probably use RSI quite often to see how high/low the RSI might go before finding a new support or resistance level. Now you can just put the RSI level into on of the 4 slots in the settings and see where that support/resistance level might be on the chart.

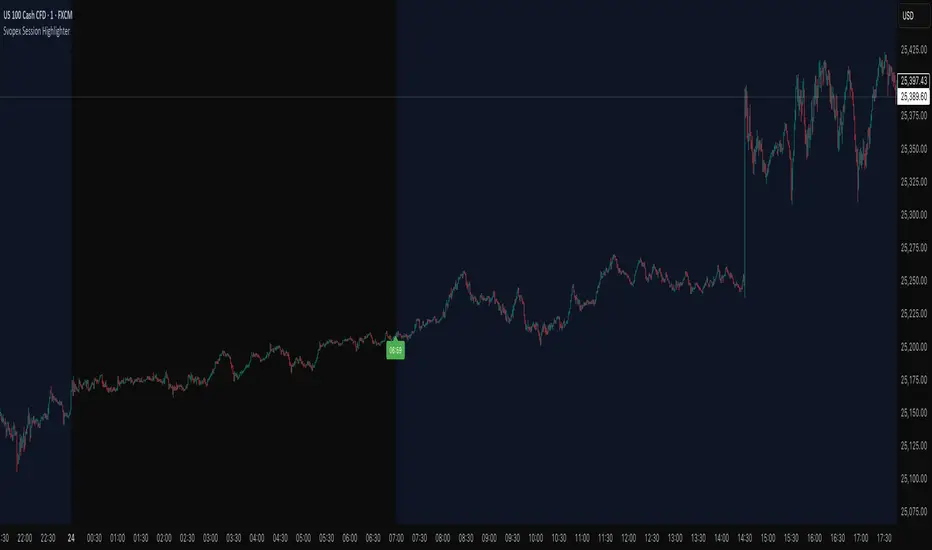
Svopex Session Highlighter# Session Highlighter
## Description
**Session Highlighter** is a powerful Pine Script indicator designed to visually identify and mark specific trading hours on your chart. This tool helps traders focus on their preferred trading sessions by highlighting the background during active hours and marking the session start with customizable visual markers.
## Key Features
- **📊 Session Background Highlighting**: Automatically shades the chart background during your defined trading hours (default: 7:00 - 23:00)
- **🎯 Smart Session Start Marker**: Places a marker on the last candle before session start, intelligently adapting to your timeframe:
- 1 Hour chart: Marker at 6:00
- 15 Minute chart: Marker at 6:45
- 5 Minute chart: Marker at 6:55
- 1 Minute chart: Marker at 6:59
- **🌍 Timezone Support**: Choose from multiple timezones (Europe/Prague, Europe/London, America/New_York, UTC)
- **🎨 5 Marker Styles**: Customize your session start indicator:
- Triangle
- Circle
- Diamond
- Label with time text
- Vertical line
- **⚙️ Fully Customizable**: Adjust start/end hours, timezone, and marker style through simple settings
## Settings
- **Start Hour**: Set your session start time (0-23)
- **End Hour**: Set your session end time (0-23)
- **Timezone**: Select your trading timezone
- **Marker Style**: Choose your preferred visual marker
## Use Cases
- Identify London/New York trading sessions
- Mark Asian session hours
- Highlight your personal trading windows
- Avoid trading during off-hours
- Perfect for day traders and scalpers
## Installation
1. Copy the Pine Script code
2. Open TradingView Pine Editor
3. Paste the code and click "Add to Chart"
4. Configure settings to match your trading schedule
Corpus Bollinger BandsThis is a copy of the build-in indicator, but as addition, it shows the distance between upper and lower band in percentage.
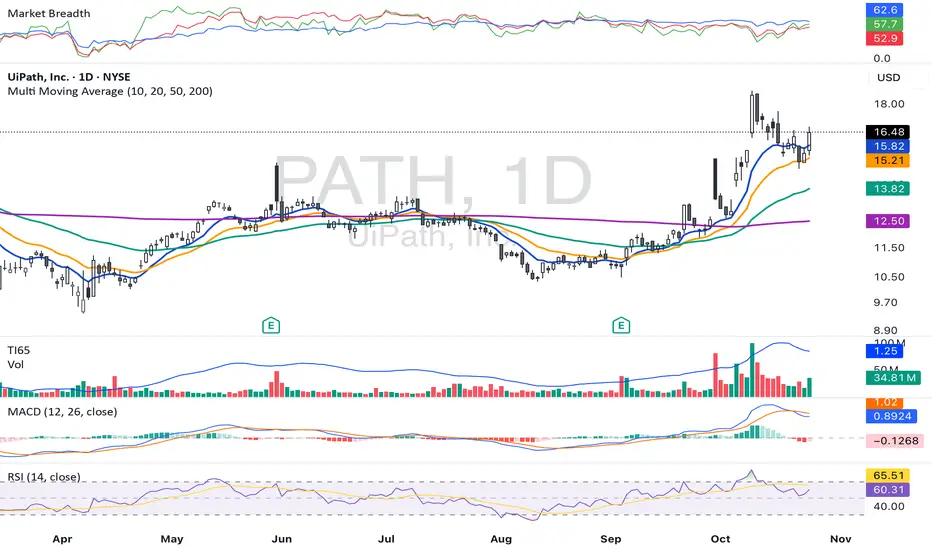
TI65**TI65 (Trend Intensity 65)** is a technical indicator designed to measure the strength and momentum of a trend over two distinct periods. It compares a short-term 7-period simple moving average (SMA) with a long-term 65-period SMA, producing a ratio that helps traders identify shifts in market momentum and trend direction.
- When the **TI65 value is greater than 1**, it indicates that the short-term moving average is above the long-term average, suggesting increasing momentum and a potentially bullish trend.
- When the **TI65 value drops below 1**, it signals weakening short-term momentum relative to the longer-term trend, often interpreted as a bearish or consolidating phase.
This indicator can be applied to both price and volume data, making it useful for identifying periods of strong volume surges or price movements. By observing changes in the TI65 ratio, traders can pinpoint low-risk entry points for trend-following strategies and quickly recognize periods of market transition.
TI65 is commonly used by momentum and breakout traders for screening strong candidates and confirming the sustainability of ongoing trends. It is simple, effective, and easily implemented via custom scripts on popular platforms like TradingView.
Volume TI65**TI65 (Trend Intensity 65)** is a technical indicator designed to measure the strength and momentum of a trend over two distinct periods. It compares a short-term 7-period simple moving average (SMA) with a long-term 65-period SMA, producing a ratio that helps traders identify shifts in market momentum and trend direction.
- When the **TI65 value is greater than 1**, it indicates that the short-term moving average is above the long-term average, suggesting increasing momentum and a potentially bullish trend.
- When the **TI65 value drops below 1**, it signals weakening short-term momentum relative to the longer-term trend, often interpreted as a bearish or consolidating phase.
This indicator can be applied to both price and volume data, making it useful for identifying periods of strong volume surges or price movements. By observing changes in the TI65 ratio, traders can pinpoint low-risk entry points for trend-following strategies and quickly recognize periods of market transition.
TI65 is commonly used by momentum and breakout traders for screening strong candidates and confirming the sustainability of ongoing trends. It is simple, effective, and easily implemented via custom scripts on popular platforms like TradingView.

Bollinger Band Width Oscillator %🧠 Bollinger Band Width Oscillator %
The Bollinger Band Width Oscillator % is a volatility-focused tool that measures the relative width of Bollinger Bands and transforms it into an oscillator format. It helps traders visualize volatility expansions and contractions directly in an indicator pane — a powerful way to anticipate breakout or consolidation phases.
🔍 How It Works
Band Width %: Calculates the percentage distance between the upper and lower Bollinger Bands relative to the basis (SMA).
Smoothed Output: The raw bandwidth is smoothed using a moving average for cleaner, more stable signals.
Dynamic Volatility Zones: The script automatically computes average, high, and low volatility thresholds — each dynamically adapting to market conditions.
User-Adjustable Multipliers: Control how sensitive your high/low zones are with the High Zone Multiplier and Low Zone Multiplier inputs.
⚙️ Key Features
📊 Oscillator Format – Easy-to-read visualization of volatility compression and expansion.
🔥 High/Low Volatility Detection – Automatic labeling and color-coded alerts for shifts in volatility.
🧩 Dynamic Thresholds – Zones adjust automatically with market activity for adaptive sensitivity.
🧠 Hysteresis Logic – Prevents rapid signal flipping, improving clarity and reliability.
🎨 Custom Visuals – Adjustable smoothing and background highlights for quick interpretation.
📈 Trading Applications
Identify Breakouts: Rising bandwidth often precedes price breakouts.
Spot Consolidations: Low bandwidth indicates tightening volatility and potential range trades.
Volatility Regime Analysis: Understand market rhythm and adapt strategies accordingly.
⚡ Inputs
Parameter Description
Band Length Period for Bollinger Band calculation
Band Multiplier Standard deviation multiplier for the bands
Source Price source (default: close)
Smoothing Period for smoothing the oscillator line
High Zone Multiplier Adjusts the high-volatility threshold
Low Zone Multiplier Adjusts the low-volatility threshold
Highlight Volatility Zones Optional background color overlay
🧊 Usage Tip
Combine this indicator with momentum tools or price action analysis to confirm trade setups. Watch for transitions from low to high volatility zones — these often signal the beginning of major market moves.

Trading Toolkit - Comprehensive AnalysisTrading Toolkit – Comprehensive Analysis
A unified trading analysis toolkit with four sections:
📊 Company Info
Fundamentals, market cap, sector, and earnings countdown.
📅 Performance
Date‑range analysis with key metrics.
🎯 Market Sentiment
CNN‑style Fear & Greed Index (7 components) + 150‑SMA positioning.
🛡️ Risk Levels
ATR/MAD‑based stop‑loss and take‑profit calculations.
Key Features
CNN‑style Fear & Greed approximation using:
Momentum: S&P 500 vs 125‑DMA
Price Strength: NYSE 52‑week highs vs lows
Market Breadth: McClellan Volume Summation (Up/Down volume)
Put/Call Ratio: 5‑day average (inverted)
Volatility: VIX vs 50‑DMA (inverted)
Safe‑Haven Demand: 20‑day SPY–IEF return spread
Junk‑Bond Demand: HY vs IG credit spread (inverted)
Normalization: z‑score → percentile (0–100) with ±3 clipping.
CNN‑aligned thresholds:
Extreme Fear: 0–24 | Fear: 25–44 | Neutral: 45–54 | Greed: 55–74 | Extreme Greed: 75+.
Risk tools: ATR & MAD volatility measures with configurable multipliers.
Flexible layout: vertical or side‑by‑side columns.
Data Sources
S&P 500: CBOE:SPX or AMEX:SPY
NYSE: INDEX:HIGN, INDEX:LOWN, USI:UVOL, USI:DVOL
Options: USI:PCC (Total PCR), fallback INDEX:CPCS (Equity PCR)
Volatility: CBOE:VIX
Treasuries: NASDAQ:IEF
Credit Spreads: FRED:BAMLH0A0HYM2, FRED:BAMLC0A0CM
Risk Management
ATR risk bands: 🟢 ≤3%, 🟡 3–6%, ⚪ 6–10%, 🟠 10–15%, 🔴 >15%
MAD‑based stop‑loss and take‑profit calculations.
Author: Daniel Dahan
(AI Generated, Merged & enhanced version with CNN‑style Fear & Greed)


VWAP Balance HeatmapVWAP Balance Heatmap visually highlights where price stands relative to the dynamic equilibrium of bullish and bearish VWAP averages. The indicator builds two running VWAP arrays — one for bullish candles, one for bearish — then plots their averages and the midpoint between them. It fills the space between price and this midpoint, coloring it green when price is above balance and red when below. The result is a smooth heatmap that reveals whether the market is trading in premium or discount zones, helping you see shifts in momentum and balance without clutter or lag.

Adaptive Volatility Bands | AlphaNattAdaptive Volatility Bands (AVB) | AlphaNatt
Professional-grade dynamic bands that adapt to market volatility and trend strength, featuring smooth gradient visualization for enhanced chart clarity.
🎯 CORE CONCEPT
AVB creates self-adjusting bands around a customizable basis line, expanding during trending markets and contracting during consolidation. The gradient fill provides instant visual feedback on price position within the volatility envelope.
✨ KEY FEATURES
5 Basis Types: Choose between SMA, EMA, ALMA, KAMA, or VWMA for the centerline calculation
Adaptive Band Width: Bands automatically widen in strong trends and tighten in ranging markets
Smooth Gradient Fills: 10-layer gradient on each side for professional depth visualization
Multiple Volatility Metrics: ATR, Standard Deviation, or Range-based calculations
Squeeze Detection: Identifies Bollinger/Keltner squeeze conditions for breakout anticipation
Dynamic Color States: Cyan (#00F1FF) for bullish, Magenta (#FF019A) for bearish conditions
📊 HOW IT WORKS
The basis line is calculated using your selected moving average type
Volatility is measured using ATR, StDev, or Range
Trend strength is quantified via linear regression
Band width adapts based on normalized trend strength (when enabled)
Gradient layers create smooth visual transitions from bands to basis
Color state changes based on price position and basis direction
🔧 PARAMETER GROUPS
Basis Configuration:
Basis Type: Moving average calculation method
Basis Length (20): Period for centerline calculation
ALMA Settings: Offset (0.85) and Sigma (6) for ALMA basis
Volatility Settings:
Volatility Method: ATR, Standard Deviation, or Range
Volatility Length (14): Lookback for volatility calculation
Band Multiplier (2.0): Distance of bands from basis
Adaptive Settings:
Enable Adaptive (true): Toggle dynamic band adjustment
Adaptation Period (50): Trend strength measurement window
Squeeze Detection:
BB/KC Parameters: Settings for squeeze identification
Expansion Threshold: Multiplier for expansion signals
📈 TRADING SIGNALS
Long Conditions:
Price crosses above basis
Basis line is rising
Band color shifts to cyan
Short Conditions:
Price crosses below basis
Basis line is falling
Band color shifts to magenta
💡 USAGE STRATEGIES
Trend Following: Trade with the basis direction when bands are expanding
Mean Reversion: Fade moves to outer bands during squeeze conditions
Breakout Trading: Enter on expansion signals after squeeze periods
Support/Resistance: Use bands as dynamic S/R levels
Position Sizing: Wider bands suggest higher volatility - adjust size accordingly
🎨 VISUAL ELEMENTS
Gradient Fills: 10 opacity layers creating smooth band transitions
Dynamic Colors: State-dependent coloring for instant trend recognition
Basis Line: Bold centerline changes color with trend state
Band Lines: Outer boundaries with matching state colors
⚡ BEST PRACTICES
The AVB indicator works optimally on liquid instruments with consistent volume. The adaptive feature performs best in trending markets but can generate false signals during choppy conditions. Consider using alongside momentum indicators for confirmation. The gradient visualization helps identify price position within the volatility envelope at a glance.
🔔 ALERTS INCLUDED
Long/Short Signals
Squeeze Conditions
Expansion Breakouts
Band Touch Events
Version 6 | Pine Script™ | © AlphaNatt

DTR & ATR with live zonesThis indicator is designed to help traders gauge the day's volatility in real-time. It compares the current Daily True Range (DTR)—the distance between the session's high and low—to the historical Average True Range (ATR).
The main purpose is to project potential price levels where the market might reach based on its average volatility. These levels (100% ATR, 150%, 200%, etc.) can be used as price targets. For instance, if you're in a long trade, you might consider taking partial or full profits as the price approaches these upper ATR extension levels. The indicator is highly customisable, allowing you to control the appearance of the ATR lines, zones, and labels to fit your charting preferences.
Core Concepts: ATR and DTR
To use this indicator effectively, it's important to understand its two main components:
Average True Range (ATR): This is a classic technical analysis indicator that measures market volatility. It calculates the average range of price movement over a specific period (e.g., 14 days). A higher ATR means the price is, on average, moving more, while a low ATR indicates less volatility. This script uses a higher timeframe ATR (e.g., Daily) to establish a stable volatility baseline for the current trading day.
Daily True Range (DTR): This is simply the difference between the current trading session's highest high and lowest low (session high - session low). It tells you how much the price has actually moved so far today.
The indicator's logic revolves around comparing the live, unfolding DTR to the historical, baseline ATR. An on-screen table conveniently shows this comparison as a percentage, to show how volatile the day has been.
How It Works: The Dynamic & Locked Mechanism
The most clever part of this indicator is how it draws the ATR levels. It operates in two distinct phases during the trading session:
Phase 1: Dynamic Expansion (Before DTR meets ATR)
At the start of the session, the DTR is small. The indicator calculates the remaining range needed to "complete" the 100% ATR level (difference = avg_atr - dtr). It then adds this remaining amount to the session high and subtracts it from the session low. This creates a "floating" 100% ATR range that expands dynamically as the session high or low is extended.
Phase 2: The Lock-in (After DTR meets or exceeds ATR)
Once the day's range (DTR) becomes equal to or greater than the avg_atr, the day has met its "expected" volatility. At this point, the levels lock in place. The indicator intelligently determines the anchor point for the locked range.
Once this primary 100% ATR range is established (either dynamically or locked), the script projects the other levels (150%, 200%, 250%, and 300%) by adding or subtracting multiples of the avg_atr from this base.
How to Use It for Trading
The primary use of this indicator is to set logical, volatility-based price targets.
Setting Profit Targets: If you enter a long position, the upper ATR levels (100%, 150%, 200%) serve as excellent areas to consider taking profits. A move to the 200% or 250% level often signifies an overextended or "exhaustion" move, making it a high-probability exit zone. For short positions, the lower ATR levels serve the same purpose.
Assessing Intraday Momentum: The on-screen table tells you how much of the expected daily range has been used. If it's early in the session and the DTR is only at 30% of the ATR, you can anticipate more significant price movement is likely to come. Conversely, if the DTR is already at 150% of ATR, the bulk of the day's move may already be complete.
Mean Reversion Signals: If the price pushes to an extreme level (e.g., 250% ATR) and shows signs of stalling (e.g., bearish divergence on an oscillator), it could signal a potential reversal or pullback, offering an opportunity for a counter-trend trade.
Key Settings
ATR Length & Smoothing Type: These settings control how the baseline ATR is calculated. The default 14 period and RMA smoothing are standard, but you can adjust them to your preference.
Session Settings: This is crucial. You must set the Market Session and Time Zone to match the primary trading hours of the asset you are analysing (e.g., "0930-1600" for the NYSE session).
Show Lines / Show Labels / Show Zones: The script gives you full control over the visual display. You can toggle each ATR level's lines, labels, and background zones individually to avoid a cluttered chart and focus only on the levels that matter to your strategy.

Renko BandsThis is renko without the candles, just the endpoint plotted as a line with bands around it that represent the brick size. The idea came from thinking about what renko actually gives you once you strip away the visual brick format. At its core, renko is a filtered price series that only updates when price moves a fixed amount, which means it's inherently a trend-following mechanism with built-in noise reduction. By plotting just the renko price level and surrounding it with bands at the brick threshold distances, you get something that works like regular volatility bands while still behaving as a trend indicator.
The center line is the current renko price, which trails actual price based on whichever brick sizing method you've selected. When price moves enough to complete a brick in the renko calculation, the center line jumps to the new brick level. The bands sit at plus and minus one brick size from that center line, showing you exactly how far price needs to move before the next brick would form. This makes the bands function as dynamic breakout levels. When price touches or crosses a band, you know a new renko brick is forming and the trend calculation is updating.
What makes this cool is the dual-purpose nature. You can use it like traditional volatility bands where the outer edges represent boundaries of normal price movement, and breaks beyond those boundaries signal potential trend continuation or exhaustion. But because the underlying calculation is renko rather than standard deviation or ATR around a moving average, the bands also give you direct insight into trend state. When the center line is rising consistently and price stays near the upper band, you're in a clean uptrend. When it's falling and price hugs the lower band, downtrend. When the center line is flat and price is bouncing between both bands, you're ranging.
The three brick sizing methods work the same way as standard renko implementations. Traditional sizing uses a fixed price range, so your bands are always the same absolute distance from the center line. ATR-based sizing calculates brick range from historical volatility, which makes the bands expand and contract based on the ATR measurement you chose at startup. Percentage-based sizing scales the brick size with price level, so the bands naturally widen as price increases and narrow as it decreases. This automatic scaling is particularly useful for instruments that move proportionally rather than in fixed increments.
The visual simplicity compared to full renko bricks makes this more practical for overlay use on your main chart. Instead of trying to read brick patterns in a separate pane or cluttering your price chart with boxes and lines, you get a single smoothed line with two bands that convey the same information about trend state and momentum. The center line shows you the filtered trend direction, the bands show you the threshold levels, and the relationship between price and the bands tells you whether the current move has legs or is stalling out.
From a trend-following perspective, the renko line naturally stays flat during consolidation and only moves when directional momentum is strong enough to complete bricks. This built-in filter removes a lot of the whipsaw that affects moving averages during choppy periods. Traditional moving averages continue updating with every bar regardless of whether meaningful directional movement is happening, which leads to false signals when price is just oscillating. The renko line only responds to sustained moves that meet the brick size threshold, so it tends to stay quiet when price is going nowhere and only signals when something is actually happening.
The bands also serve as natural stop-loss or profit-target references since they represent the distance price needs to move before the trend calculation changes. If you're long and the renko line is rising, you might place stops below the lower band on the theory that if price falls far enough to reverse the renko trend, your thesis is probably invalidated. Conversely, the upper band can mark levels where you'd expect the current brick to complete and potentially see some consolidation or pullback before the next brick forms.
What this really highlights is that renko's value isn't just in the brick visualization, it's in the underlying filtering mechanism. By extracting that mechanism and presenting it in a more traditional band format, you get access to renko's trend-following properties without needing to commit to the brick chart aesthetic or deal with the complications of overlaying brick drawings on a time-based chart. It's renko after all, so you get the trend filtering and directional clarity that makes renko useful, but packaged in a way that integrates more naturally with standard technical analysis workflows.

Multi-Moving Average (4x)Configurable moving average indicator where user can select up to 4 MA and configure SMA or EMA , color and width.

Nadaraya-Watson Envelope [Dynamic Adaptive Working]LuxAlgo'a kernel channel-based, modified for dynamic stochastic bandwidth adaptation.
Nadaraya-Watson Envelope , "NWE Adaptive (Working)"
