HM2 - Murrey Math Levels# Murrey Math Indicator - Comprehensive Description
## **What is Murrey Math?**
Murrey Math is a trading system developed by T.H. Murrey that divides price action into 8 equal segments (octaves) based on Gann and geometry principles. It automatically identifies key support and resistance levels where price is likely to react, making it a powerful tool for determining entry/exit points and price targets.
## **How It Works**
The indicator:
1. **Analyzes price history** over a lookback period (default 64-200 bars)
2. **Finds the highest high and lowest low** in that period
3. **Calculates a "fractal"** - a geometric scaling factor based on price magnitude
4. **Creates 8 equal divisions** between key levels, plus 4 overshoot levels (total 13 levels)
5. **Labels each level** from -2/8 to +2/8 with their trading significance
## **The 13 Murrey Math Levels**
### **Core Levels (0/8 to 8/8):**
- ** - Ultimate Support** (Blue)
- Extreme oversold condition
- Strong buying opportunity
- Price rarely breaks below this
- ** - Weak, Stall & Reverse** (Orange)
- Weak support level
- Price often stalls and reverses here
- ** - Pivot/Reverse Level** (Red)
- Major support that can become resistance
- Important reversal zone
- ** - Bottom of Trading Range - BUY Zone** (Green)
- Bottom boundary of normal trading
- **Premium BUY zone** - 40% of trading happens between 3/8 and 5/8
- ** - Major Support/Resistance** (Blue)
- **THE MOST IMPORTANT LEVEL**
- The midpoint - best entry/exit level
- Strong pivot point that price respects
- ** - Top of Trading Range - SELL Zone** (Green)
- Top boundary of normal trading
- **Premium SELL zone**
- ** - Pivot/Reverse Level** (Red)
- Major resistance that can become support
- Important reversal zone
- ** - Weak, Stall & Reverse** (Orange)
- Weak resistance level
- Price often stalls and reverses here
- ** - Ultimate Resistance** (Blue)
- Extreme overbought condition
- Strong selling opportunity
- Price rarely breaks above this
### **Overshoot Levels:**
- ** & ** (Gray) - Extreme downside overshoot zones
- ** & ** (Gray) - Extreme upside overshoot zones
- These indicate extreme moves beyond normal trading ranges
## **Trading Zones (from your diagram)**
1. **Consolidation Trading Area** (0/8 to 3/8)
- Price is in a bearish zone
- Look for BUY opportunities near support levels
2. **Normal Trading Area** (3/8 to 5/8)
- **40% of trading occurs here**
- Price oscillates between these boundaries
- Range-bound trading strategies work best
3. **Premium Trading Area** (5/8 to 8/8)
- Price is in a bullish zone
- Look for SELL opportunities near resistance levels
## **Trading Strategies**
### **Buy Signals:**
- Price bounces off 0/8 (ultimate support)
- Price pulls back to 3/8 in an uptrend
- Price breaks above 4/8 after consolidation
### **Sell Signals:**
- Price rejects at 8/8 (ultimate resistance)
- Price rallies to 5/8 in a downtrend
- Price breaks below 4/8 after consolidation
### **Range Trading:**
- Buy near 3/8, sell near 5/8 when price is ranging
- Use 4/8 as the pivot to determine trend direction
## **Key Advantages**
✅ **Objective levels** - No subjective placement
✅ **Self-adjusting** - Automatically recalculates based on recent price action
✅ **Clear trading zones** - Easy to identify support/resistance
✅ **Works on all timeframes** - From 1-minute to monthly charts
✅ **Combines with other indicators** - Works well with RSI, MACD, etc.
## **Important Notes**
- The indicator is **dynamic** - levels update as new highs/lows form
- **4/8 is the most critical level** - price above = bullish, below = bearish
- When price reaches overshoot levels (±1/8, ±2/8), expect strong reversals
- Works best in trending markets; can give false signals in choppy conditions
This geometric approach to support/resistance has been used by traders for decades and remains popular due to its objective, mathematical nature!
Bandes et canaux

Mitigation Blocks — Lite (ICT) + Arrows + Stats📌 Mitigation Blocks — Lite (ICT-Based) + Arrows
This indicator detects mitigation blocks based on price structure shifts, inspired by ICT (Inner Circle Trader) concepts. It works by identifying strong impulses and highlighting the last opposite candle, forming a mitigation block zone for potential reversal or continuation trades.
🔍 Features:
✅ Automatic detection of bullish and bearish mitigation blocks
🟩 Box visualization with border color change on mitigation (first touch)
📉 ATR-based impulse filtering
📌 Entry arrows on first mitigation (touch)
📊 Autoscale anchors for better chart readability
📈 Real-time HUD info panel
📉 Backtest-friendly design (stable, deterministic logic)
🛠️ How it works:
Detects swing highs/lows using pivot points.
Confirms impulse candles breaking recent structure.
Locates the last opposite candle as the mitigation block.
Displays a block box until price revisits the zone.
On the first touch (mitigation), the block is marked and arrows are drawn.
💡 Ideal Use Case:
Apply this on higher timeframes (e.g., 4H) to identify potential limit order zones.
Use the blocks as entry zones and combine with confluence: FVGs, imbalance, S&D, or liquidity levels.
🧠 Extra Tip:
You can extend this script to include:
Win-rate tracking
Auto TP/SL levels based on ATR
Confluence detection (e.g., FVG, order blocks)

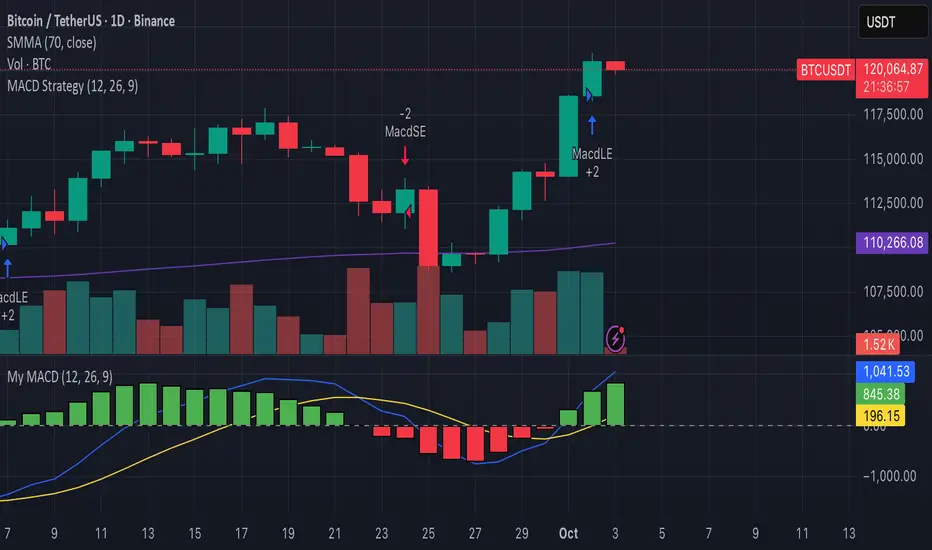
JNGO - Moving Average Convergence DivergenceMACD Script Im testing out among friends for Moving Average Convergence Divergence

DTM 444 BANDS 🚀DTM 444 BANDS 🚀:
The DTM 444 BANDS 🚀 is a powerful, multi-purpose trading indicator combining Supertrend, Dynamic Band Levels, Breakout Signals, and Volume Confirmation to help traders identify high-probability trade setups across different timeframes.
🔧 Key Features
✅ Multi-Timeframe Support
Analyze price action across any timeframe using the Timeframe input.
All band calculations (High, Low, Midline, and Supertrend) are pulled from a higher timeframe for clearer context.
✅ Dynamic Bands Based on Supertrend
High Band: Rolling highest of Supertrend over hiLen period.
Low Band: Rolling lowest of Supertrend over loLen period.
Midline: Midpoint of the above.
Acts like dynamic support/resistance, ideal for trend-following and breakout strategies.
✅ Dual Signal System
Breakout Signals (Buy and Sell): Triggered when price breaks the bands with volume confirmation.
Supertrend Crossover Signals (Buy1 and Sell1): Classic momentum entries with a confirmation twist.
Exit Signals: Optional take-profit/neutral indicators when price reverses.
✅ Volume Confirmation Filter (Optional)
Only triggers signals if the volume exceeds its 20-period SMA.
Helps filter out false breakouts and weak trends in low-liquidity periods.
✅ Visual Enhancements
Color-coded candles based on band positioning (e.g., red = weak, green = strong, etc.)
On-chart labels for each signal for quick reference.
Real-time Signal Dashboard using Pine Script tables showing:
Current signal
Volume filter status
Live volume vs volume SMA
🧪 Practical Use Cases
Trend Traders: Use the Supertrend cross and band breakouts to ride trends early.
Breakout Traders: Catch high-probability moves outside established ranges.
Swing Traders: Time entries and exits using color-coded bars and exit labels.
Volume-Sensitive Traders: Focus on trades with strong volume backing.
📊 Backtest Snapshot
Based on the example chart for Reliance Industries (RELIANCE.NS) on the weekly timeframe:
Several profitable buy and breakout signals during uptrends.
Timely exits and breakdown alerts before reversals.
Volume filter keeps trades clean and avoids noise.
⚙️ Customizable Parameters
High Length and Low Length (default: 19)
Supertrend Multiplier and ATR Length
Volume Filter: Toggle ON/OFF
Volume SMA Length: Default 20
Custom Timeframe: Choose any higher timeframe for multi-timeframe analysis
📢 Alerts Ready
Fully integrated with TradingView alerts:
Breakout & Breakdown
Supertrend crossovers
All alerts respect the volume filter setting
🏁 Final Thoughts
DTM 444 BANDS 🚀 is a versatile and adaptive trading system that blends trend analysis, volatility bands, and volume validation. Whether you're a trend trader, breakout hunter, or swing trader — this tool gives you a structured edge with clear visual cues and real-time alerts.

Needle XRThe Didi Index with Full Validation is a technical indicator developed for the TradingView platform, based on the concept of the Didi Index, created by Odir Aguiar (Didi). It uses the relationship between three exponential moving averages (EMAs) of different periods to identify trend reversal or continuation points, known as "needle points." To increase signal reliability, the indicator incorporates validations from four widely used technical indicators: MACD, TRIX, DMI/ADX, and Stochastic. Buy and sell signals are displayed only when all validation conditions are met, ensuring greater accuracy.
The indicator is plotted in a separate panel below the price chart, displaying the Didi Index lines (positive and negative), a central reference line, and clear buy (green triangles) and sell (red triangles) signals.

Trendline Breakouts With Targets [ omerprıme ]Indicator Explanation (English)
This indicator is designed to detect trendline breakouts and provide early trading signals when the price breaks key support or resistance levels.
Trendline Detection
The indicator identifies recent swing highs and lows to construct dynamic trendlines.
These trendlines act as support in an uptrend and resistance in a downtrend.
Breakout Confirmation
When the price closes above a resistance trendline, the indicator generates a bullish breakout signal.
When the price closes below a support trendline, it generates a bearish breakout signal.
Filtering False Signals
To reduce false breakouts, additional conditions (such as candle confirmation, volume filters, or price momentum) can be applied.
Only significant and confirmed breakouts are highlighted.
Trading Logic
Buy signals are triggered when the price breaks upward through resistance with confirmation.
Sell signals are triggered when the price breaks downward through support with confirmation.

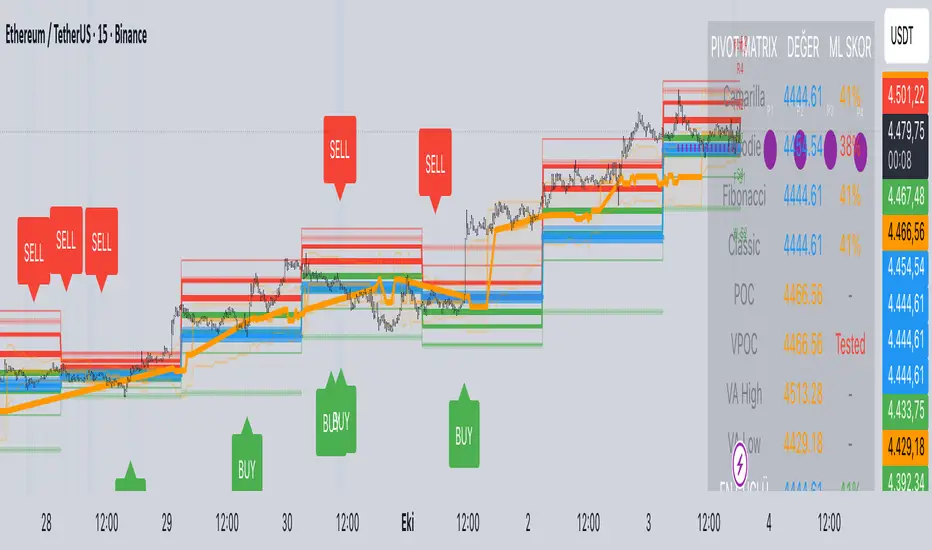
Predictive Pivot Matrix OHLC data, integrates volume profile for POC/Value Area tracking (including virgin POC), applies rule-based "ML" scoring to evaluate pivot strength via factors like proximity, volume, touches, trend, and confluence, monitors adaptive success rates, projects 5-day future pivots using trend/volatility, detects overlapping confluence zones, and generates visuals (lines, labels, table), alerts, and buy/sell signals on key crossings.
RSI: chart overlay
This indicator maps RSI thresholds directly onto price. Since the EMA of price aligns with RSI’s 50-line, it draws a volatility-based band around the EMA to reveal levels such as 70 and 30.
By converting RSI values into visible price bands, the overlay lets you see exactly where price would have to move to hit traditional RSI boundaries. These bands adapt in real time to both price movement and market volatility, keeping the classic RSI logic intact while presenting it in the context of price action. This approach helps traders interpret RSI signals without leaving the main chart window.
The calculation uses the same components as the RSI: alternative derivation script: Wilder’s EMA for smoothing, a volatility-based unit for scaling, and a normalization factor. The result is a dynamic band structure on the chart, representing RSI boundary levels in actual price terms.
Key components and calculation breakdown:
Wilder’s EMA
Used as the anchor point for measuring price position.
myEMA = ta.rma(close, Length)
Volatility Unit
Derived from the EMA of absolute close-to-close price changes.
CC_vol = ta.rma(math.abs(close - close ), Length)
Normalization Factor
Scales the volatility unit to align with the RSI formula’s structure.
normalization_factor = 1 / (Length - 1)
Upper and Lower Boundaries
Defines price bands corresponding to selected RSI threshold values.
up_b = myEMA + ((upper - 50) / 50) * (CC_vol / normalization_factor)
down_b = myEMA - ((50 - lower) / 50) * (CC_vol / normalization_factor)
Inputs
RSI length
Upper boundary – RSI level above 50
Lower boundary – RSI level below 50
ON/OFF toggle for 50-point line (EMA of close prices)
ON/OFF toggle for overbought/oversold coloring (use with line chart)
Interpretation:
Each band on the chart represents a chosen RSI level.
When price touches a band, RSI is at that threshold.
The distance between moving average and bands adjusts automatically with volatility and your selected RSI length.
All calculations remain fully consistent with standard RSI values.
Feedback and code suggestions are welcome, especially regarding implementation efficiency and customization.

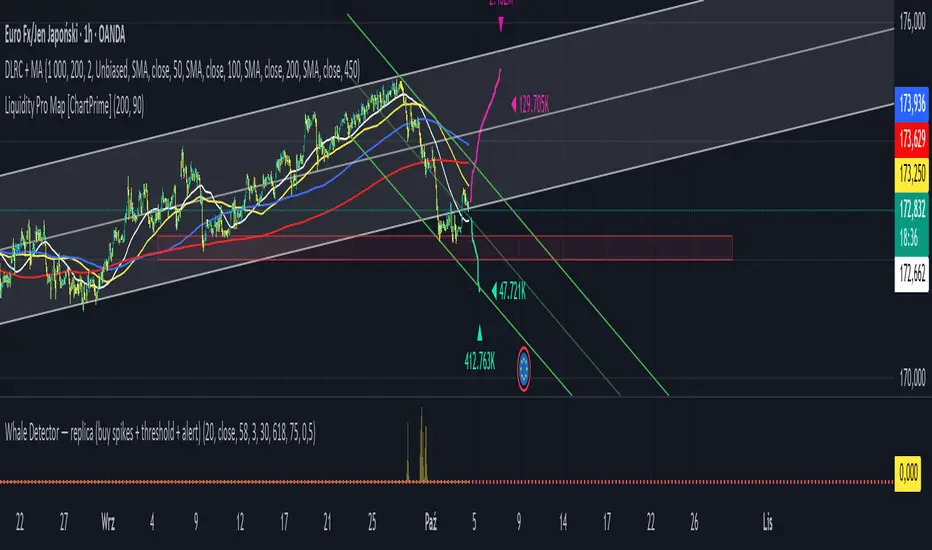
Jarass regression linesDouble Linear Regression Ultimate + MA Ribbon (DLRC + MA)
The DLRC + MA indicator is an advanced technical analysis tool that combines double linear regression channels with a moving average ribbon (MA Ribbon). Designed for traders who want to simultaneously track trend, volatility, and potential support/resistance levels.
Key Features:
1. Double Linear Regression Channels:
• Inner Channel – shorter period, more sensitive to recent price movements.
• Outer Channel – longer period, reflects the long-term trend.
• Both channels display upper and lower boundaries and a midline.
• Optional logarithmic scale for price adjustment.
• Real-time R² values to assess regression accuracy.
2. MA Ribbon:
• Up to 4 different moving averages simultaneously.
• Supports SMA, EMA, SMMA (RMA), WMA, VWMA.
• Each MA can be individually enabled/disabled, with customizable period, source, and color.
• Helps identify trend direction and dynamic support/resistance levels.
3. Visualization:
• Channels are filled with semi-transparent colors for clarity.
• Midline for quick trend direction assessment.
• Label displays R² values of the channels in real time.
4. Suitable For:
• Short-term and long-term traders seeking a combination of linear regression analysis and classic trend-following tools.
• Useful for identifying overbought/oversold zones and potential trend reversal points.
Summary:
DLRC + MA combines statistical precision of linear regression with intuitive trend visualization via a MA ribbon. It provides quick insight into market direction, volatility, and potential turning points, all in one chart overlay.
John Bollinger's Bollinger BandsJapanese below / 日本語説明は下記
This indicator replicates how John Bollinger, the inventor of Bollinger Bands, uses Bollinger Bands, displaying Bollinger Bands, %B and Bandwidth in one indicator with alerts and signals.
Bollinger Bands is created by John Bollinger in 1980s who is an American financial trader and analyst. He introduced %B and Bandwidth 30 years later.
🟦 What's different from other Bollinger Bands indicator?
Unlike the default Bollinger Bands or other custom Bollinger Bands indicators on TradingView, this indicator enables to display three Bollinger Bands tools into a single indicator with signals and alerts capability.
You can plot the classic Bollinger Bands together with either %B or Bandwidth or three tools altogether which requires the specific setting(see below settings).
This makes it easy to quantitatively monitor volatility changes and price position in relation to Bollinger Bands in one place.
🟦 Features:
Plots Bollinger Bands (Upper, Basis, Lower) with fill between bands.
Option to display %B or Bandwidth with Bollinger Bands.
Plots highest and lowest Bandwidth levels over a customizable lookback period.
Adds visual markers when Bandwidth reaches its highest (Bulge) or lowest (Squeeze) value.
Includes ready-to-use alert conditions for Bulge and Squeeze events.
📈Chart
Green triangles and red triangles in the bottom chart mark Bulges and Squeezes respectively.
🟦 Settings:
Length: Number of bars used for Bollinger Band middleline calculation.
Basis MA Type: Choose SMA, EMA, SMMA (RMA), WMA, or VWMA for the midline.
StdDev: Standard deviation multiplier (default = 2.0).
Option: Select "Bandwidth" or "%B" (add the indicator twice if you want to display both).
Period for Squeeze and Bulge: Lookback period for detecting the highest and lowest Bandwidth levels.(default = 125 as specified by John Bollinger )
Style Settings: Colors, line thickness, and transparency can be customized.
📈Chart
The chart below shows an example of three Bollinger Bands tools: Bollinger Band, %B and Bandwidth are in display.
To do this, you need to add this indicator TWICE where you select %B from Option in the first addition of this indicator and Bandwidth from Option in the second addition.
🟦 Usage:
🟠Monitor Volatility:
Watch Bandwidth values to spot volatility contractions (Squeeze) and expansions (Bulge) that often precede strong price moves.
John Bollinger defines Squeeze and Bulge as follows;
Squeeze:
The lowest bandwidth in the past 125 period, where trend is born.
Bulge:
The highest bandwidth in the past 125 period where trend is going to die.
According to John Bollinger, this 125 period can be used in any timeframe.
📈Chart1
Example of Squeeze
You can see uptrends start after squeeze(red triangles)
📈Chart2
Example of Bulge
You can see the trend reversal from downtrend to uptrends at the bulge(green triangles)
📈Chart3
Bulge DOES NOT NECESSARILY mean the beginning of a trend in opposite direction.
For example, you can see a bulge happening in the right side of the chart where green triangles are marked. Nevertheless, uptrend still continues after the bulge.
In this case, the bulge marks the beginning of a consolidation which lead to the continuation of the trend. It means that a phase of the trend highlighted in the light blue box came to an end.
Note: light blue box is not drawn by the indicator.
Like other technical analysis methods or tools, these setups do not guarantee birth of new trends and trend reversals. Traders should be carefully observing these setups along with other factors for making decisions.
🟠Track Price Position:
Use %B to see where price is located in relation to the Bollinger Bands.
If %B is close to 1, the price is near upper band while %B is close to 0, the price is near lower band.
🟠Set Alerts:
Receive alerts when Bandwidth hits highest and lowest values of bandwidth, helping you prepare for potential breakout, ending of trends and trend reversal opportunities.
🟠Combine with Other Tools:
This indicator would work best when combined with price action, trend analysis, or
market environmental analysis.
—————————————————————————————
このインジケーターはボリンジャーバンドの考案者であるジョン・ボリンジャー氏が提唱するボリンジャーバンドの使い方を再現するために、ボリンジャーバンド、%B、バンドウィズ(Bandwidth) の3つを1つのインジケーターで表示可能にしたものです。シグナルやアラートにも対応しています。
ボリンジャーバンドは1980年代にアメリカ人トレーダー兼アナリストのジョン・ボリンジャー氏によって開発されました。彼はその30年後に%Bとバンドウィズを導入しました。
🟦 他のボリンジャーバンドとの違い
TradingView標準のボリンジャーバンドや他のボリンジャーバンドとは異なり、このインジケーターでは3つのボリンジャーバンドツールを1つのインジケーターで表示し、シグナルやアラート機能も利用できるようになっています。
一般的に知られている通常のボリンジャーバンドに加え、%Bやバンドウィズを組み合わせて表示でき、設定次第では3つすべてを同時にモニターすることも可能です。これにより、価格とボリンジャーバンドの位置関係とボラティリティ変化をひと目で、かつ定量的に把握することができます。
🟦 機能:
ボリンジャーバンド(アッパーバンド・基準線・ロワーバンド)を描画し、バンド間を塗りつぶし表示。
オプションで%Bまたはバンドウィズを追加表示可能。
バンドウィズの最高値・最安値を、任意の期間で検出して表示。
バンドウィズが指定期間の最高値(バルジ※)または最安値(スクイーズ)に達した際にシグナルを表示。
※バルジは一般的にボリンジャーバンドで用いられるエクスパンションとほぼ同じ意味ですが、定義が異なります。(下記参照)
バルジおよびスクイーズ発生時のアラート設定が可能。
📈 チャート例
下記チャートの緑の三角と赤の三角は、それぞれバルジとスクイーズを示しています。
🟦 設定:
Length: ボリンジャーバンドの基準線計算に使う期間。
Basis MA Type: SMA, EMA, SMMA (RMA), WMA, VWMAから選択可能。
StdDev: 標準偏差の乗数(デフォルト2.0)。
Option: 「Bandwidth」または「%B」を選択(両方表示するにはこのインジケーターを2回追加)。
Period for Squeeze and Bulge: Bandwidthの最高値・最安値を検出する期間(デフォルトはジョン・ボリンジャー氏が推奨する125)。
Style Settings: 色、線の太さ、透明度などをカスタマイズ可能。
📈 チャート例
下のチャートは「ボリンジャーバンド」「%B」「バンドウィズ」の3つを同時に表示した例です。
この場合、インジケーターを2回追加し、最初に追加した方ではOptionを「%B」に、次に追加した方では「Bandwidth」を選択します。
🟦 使い方:
🟠 ボラティリティを監視する:
バンドウィズの値を見ることで、価格変動の収縮(スクイーズ)や拡大(バルジ)を確認できます。
これらはしばしば強い値動きの前兆となります。
ジョン・ボリンジャー氏はスクイーズとバルジを次のように定義しています:
スクイーズ: 過去125期間の中で最も低いバンドウィズ→ 新しいトレンドが生まれる場所。
バルジ: 過去125期間の中で最も高いバンドウィズ → トレンドが終わりを迎える場所。
この「125期間」はどのタイムフレームでも利用可能とされています。
📈 チャート1
スクイーズの例
赤い三角のスクイーズの後に上昇トレンドが始まっているのが確認できます。
📈 チャート2
バルジの例
緑の三角のバルジの箇所で下降トレンドから上昇トレンドへの反転が見られます。
📈 チャート3
バルジが必ずしも反転を意味しない例
下記のチャート右側の緑の三角で示されたバルジの後も、上昇トレンドが継続しています。
この場合、バルジは反転ではなく「トレンド一時的な調整(レンジ入り)」を示しており、結果的に上昇トレンドが継続しています。
この場合、バルジは水色のボックスで示されたトレンドのフェーズの終わりを示しています。
※水色のボックスはインジケーターが描画したものではありません。
また、他のテクニカル分析と同様に、これらのセットアップは必ず新しいトレンドの発生やトレンド転換を保証するものではありません。トレーダーは他の要素も考慮し、慎重に意思決定する必要があります。
🟠 価格とボリンジャーバンドの位置関係を確認する:
%Bを利用すれば、価格がバンドのどこに位置しているかを簡単に把握できます。
%Bが1に近ければ価格はアッパーバンド付近、0に近ければロワーバンド付近にあります。
🟠 アラートを設定する:
バンドウィズが一定期間の最高値または最安値に到達した際にアラートを設定することで、ブレイクアウトやトレンド終了、反転の可能性に備えることができます。
🟠 他のツールと組み合わせる:
このインジケーターは、プライスアクション、トレンド分析、環境認識などと組み合わせて活用すると最も効果的です。

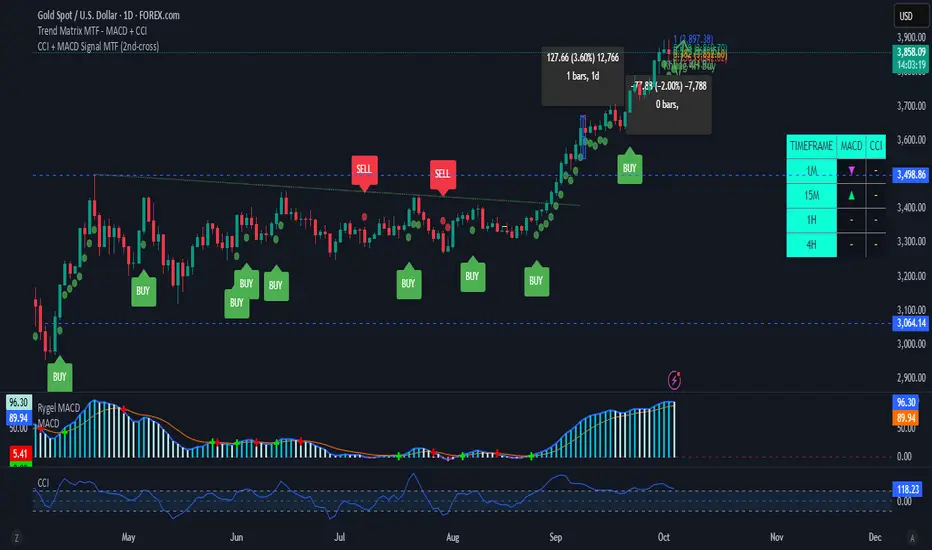
CCI + MACD Signal MTF (2nd-cross)This custom indicator combines the Commodity Channel Index (CCI) and the MACD to generate trading signals.
Basic signals (dots):
A green dot is plotted when CCI is above +100 and MACD is positive.
A red dot is plotted when CCI is below –100 and MACD is negative.
These dots help visualize momentum alignment between the two indicators.
Second-cross signals (text + alert):
The indicator also tracks cycles of the CCI.
When CCI first moves above +100 and later falls back below +100, this is counted as one completed cycle.
The next time CCI crosses back above +100 (the second cross), if MACD is still positive, a “BUY” label is plotted and a buy alert is triggered.
Conversely, when CCI first moves below –100 and later rises back above –100, that is one completed cycle.
The next time CCI crosses back below –100 (the second cross), if MACD is negative, a “SELL” label is plotted and a sell alert is triggered.
Alerts:
Alerts are only fired on the second-cross events (BUY or SELL), making them rarer but potentially more reliable than the basic dot conditions.
Timeframe flexibility:
Both the CCI and the MACD can be calculated on custom timeframes independently of the chart’s timeframe.
Fisher Transform Trend Navigator [QuantAlgo]🟢 Overview
The Fisher Transform Trend Navigator applies a logarithmic transformation to normalize price data into a Gaussian distribution, then combines this with volatility-adaptive thresholds to create a trend detection system. This mathematical approach helps traders identify high-probability trend changes and reversal points while filtering market noise in the ever-changing volatility conditions.
🟢 How It Works
The indicator's foundation begins with price normalization, where recent price action is scaled to a bounded range between -1 and +1:
highestHigh = ta.highest(priceSource, fisherPeriod)
lowestLow = ta.lowest(priceSource, fisherPeriod)
value1 = highestHigh != lowestLow ? 2 * (priceSource - lowestLow) / (highestHigh - lowestLow) - 1 : 0
value1 := math.max(-0.999, math.min(0.999, value1))
This normalized value then passes through the Fisher Transform calculation, which applies a logarithmic function to convert the data into a Gaussian normal distribution that naturally amplifies price extremes and turning points:
fisherTransform = 0.5 * math.log((1 + value1) / (1 - value1))
smoothedFisher = ta.ema(fisherTransform, fisherSmoothing)
The smoothed Fisher signal is then integrated with an exponential moving average to create a hybrid trend line that balances statistical precision with price-following behavior:
baseTrend = ta.ema(close, basePeriod)
fisherAdjustment = smoothedFisher * fisherSensitivity * close
fisherTrend = baseTrend + fisherAdjustment
To filter out false signals and adapt to market conditions, the system calculates dynamic threshold bands using volatility measurements:
dynamicRange = ta.atr(volatilityPeriod)
threshold = dynamicRange * volatilityMultiplier
upperThreshold = fisherTrend + threshold
lowerThreshold = fisherTrend - threshold
When price momentum pushes through these thresholds, the trend line locks onto the new level and maintains direction until the opposite threshold is breached:
if upperThreshold < trendLine
trendLine := upperThreshold
if lowerThreshold > trendLine
trendLine := lowerThreshold
🟢 Signal Interpretation
Bullish Candles (Green): indicate normalized price distribution favoring bulls with sustained buying momentum = Long/Buy opportunities
Bearish Candles (Red): indicate normalized price distribution favoring bears with sustained selling pressure = Short/Sell opportunities
Upper Band Zone: Area above middle level indicating statistically elevated trend strength with potential overbought conditions approaching mean reversion zones
Lower Band Zone: Area below middle level indicating statistically depressed trend strength with potential oversold conditions approaching mean reversion zones
Built-in Alert System: Automated notifications trigger when bullish or bearish states change, allowing you to act on significant developments without constantly monitoring the charts
Candle Coloring: Optional feature applies trend colors to price bars for visual consistency and clarity
Configuration Presets: Three parameter sets available - Default (balanced settings), Scalping (faster response with higher sensitivity), and Swing Trading (slower response with enhanced smoothing)
Color Customization: Four color schemes including Classic, Aqua, Cosmic, and Custom options for personalized chart aesthetics

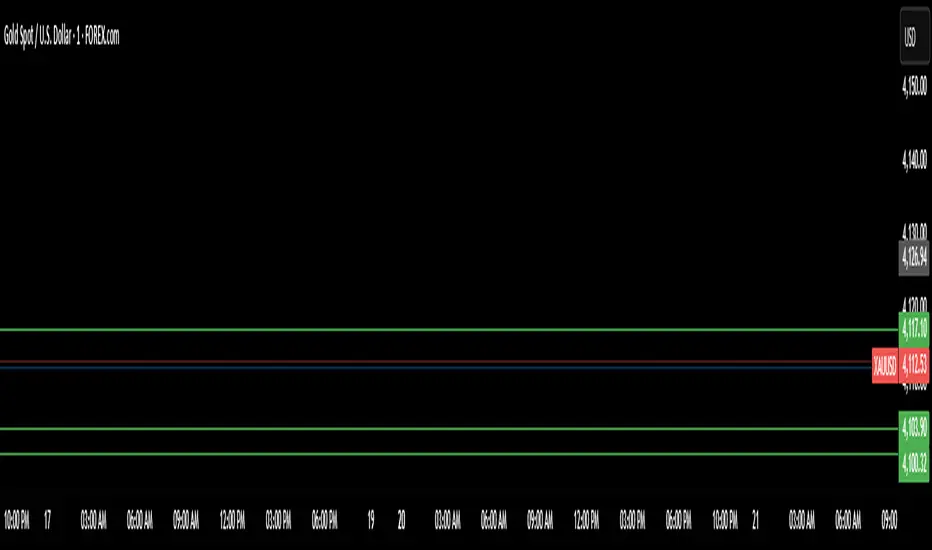
VWAP / ORB / VP & POCThis is an all-in-one technical analysis tool designed to give you a comprehensive view of the market on a single chart. It combines three powerful indicators—VWAP, Opening Range, and Volume Profile—to help you identify key price levels, understand intraday trends, and spot areas of high liquidity.
What It Does
The indicator plots three distinct components on your chart:
Volume-Weighted Average Price (VWAP): A benchmark that shows the average price a security has traded at throughout the day, based on both price and volume. It's often used by institutional traders to gauge whether they are getting a good price. The script also plots standard deviation or percentage-based bands around the VWAP line, which can act as dynamic support and resistance.
Opening Range Breakout (ORB): A tool that highlights the high and low of the initial trading period of a session (e.g., the first 15 minutes). The script draws lines for the opening price, range high, and range low for the rest of the session. It also colors the chart with zones to visually separate price action above, below, and within this critical opening range.
Volume Profile (VP): A powerful study that shows trading activity over a set number of bars at specific price levels. Unlike traditional volume that is plotted over time, this is plotted on the price axis. It helps you instantly see where the most and least trading has occurred, identifying significant levels like the Point of Control (POC)—the single price with the most volume—and the Value Area (VA), where the majority of trading took place.
How to Use It for Trading
The real strength of this indicator comes from finding confluence, where two or more of its components signal the same key level.
Identifying Support & Resistance: The POC, VWAP bands, Opening Range high/low, and session open price are all powerful levels to watch. When price approaches one of these levels, you can anticipate a potential reaction (a bounce or a breakout).
Gauging Intraday Trend: A simple rule of thumb is to consider the intraday trend bullish when the price is trading above the VWAP and bearish when it is trading below the VWAP.
Finding High-Value Zones: The Volume Profile’s Value Area (VA) shows you where the market has accepted a price. Trading within the VA is considered "fair value," while prices outside of it are "unfair." Reversals often happen when the price tries to re-enter the Value Area from the outside.
Settings:
Here’s a breakdown of all the settings you can change to customize the indicator to your liking.
Volume Profile Settings:
Number of Bars: How many of the most recent bars to use for the calculation. A higher number gives a broader profile.
Row Size: The number of price levels (rows) in the profile. Higher numbers give a more detailed, granular view.
Value Area Volume %: The percentage of total volume to include in the Value Area (standard is 70%).
Horizontal Offset: Moves the Volume Profile further to the right to avoid overlapping with recent price action.
Colors & Styles: Customize the colors for the POC line, Value Area, and the up/down volume bars.
VWAP Settings:
Anchor Period: Resets the VWAP calculation at the start of a new Session, Week, Month, Year, etc. You can even anchor it to corporate events like Earnings or Splits.
Source: The price source used in the calculation (default is hlc3, the average of the high, low, and close).
Bands Calculation Mode:
Standard Deviation: The bands are based on statistical volatility.
Percentage: The bands are a fixed percentage away from the VWAP line.
Bands Multiplier: Sets the distance of the bands from the VWAP. You can enable and configure up to three sets of bands.
ORB Settings (Opening Range)
Opening Range Timeframe: The duration of the opening range (e.g., 15 for 15 minutes, 60 for the first hour).
Market Session & Time Zone: Crucial for ensuring the range is calculated at the correct time for the asset you're trading.
Line & Zone Styles: Full customization for the colors, thickness, and style (Solid, Dashed, Dotted) of the High, Low, and Opening Price lines, as well as the background colors for the zones above, below, and within the range.

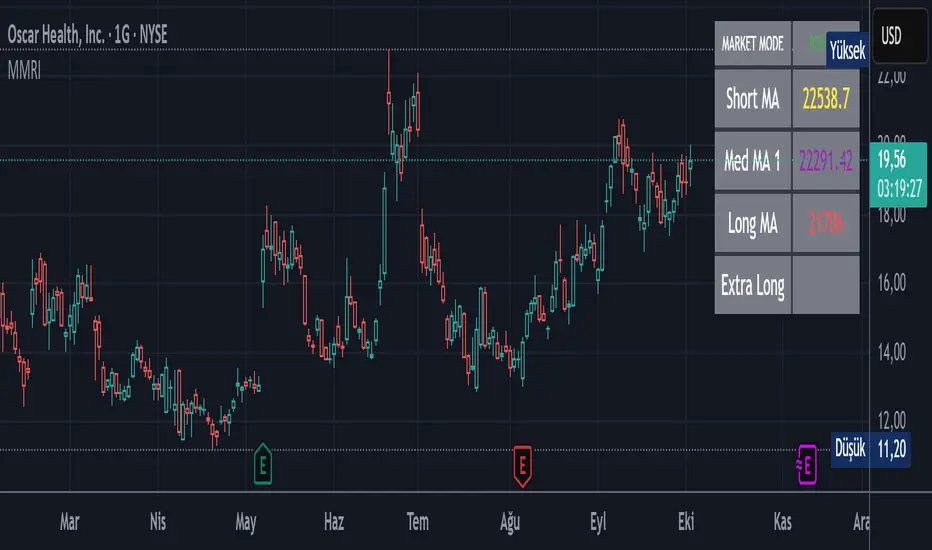
Market Mode Risk IndicatorMarket Mode Risk Indicator v1.1
This custom indicator helps traders gauge market risk sentiment by monitoring Exponential Moving Average (EMA) or Simple Moving Average (SMA) crossovers on key indices like BIST 100 (for Turkish markets), NASDAQ Composite (tech-focused US), or Dow Jones Industrial Average (industrial US). It dynamically categorizes the market into three actionable modes based on the index's position relative to layered MAs, providing a quick visual snapshot without cluttering your chart.
Risk Modes Explained:
RISK OFF (Red): Index closes below the Long MA (default 50 periods) – signals bearish caution; time to tighten stops or reduce exposure.
RISK TEST (Orange): Index above Medium MA1 (21 periods) and Extra Long MA (55 periods), but below Short MA (10 periods) and above Long MA – a transitional "test" phase; watch for confirmation before entering.
RISK ON (Green): Index above all MAs (Short, Medium, Long, Extra Long) – bullish green light; favorable for longs or momentum plays.
How It Works:
The core logic uses boolean checks on the index's close price against user-defined MA lengths. For example:
It pulls live data from your selected index via request.security.
Computes MAs with ternary operators for EMA (ta.ema) or SMA (ta.sma) based on your choice.
Mode detection relies on AND/OR conditions (e.g., aboveShort and aboveMed1 and aboveLong and aboveExtraLong for RISK ON) to filter noise and focus on meaningful shifts.
No lookahead bias – all calculations are historical and real-time compatible. Defaults (10/21/50/55) are inspired by common Fibonacci-inspired periods for balanced sensitivity.
Alerts fire only on mode transitions (e.g., from RISK OFF to ON) to prevent spam, using alertcondition with dynamic messages including price and ticker.
Customization Options:
Index & MA Settings: Switch EMA/SMA; tweak lengths (min 1 period) for your timeframe (e.g., shorter for intraday).
Display: Position the table (top/bottom, left/right); toggle MA values on/off.
Looks: Background/border/text colors, transparency (0-100%) for theme matching.
Built in Pine Script v5 for efficiency – lightweight, no repaints.
Usage Tips:
Add to any stock chart (e.g., GARAN for BIST analysis).
Select your index in settings; refresh chart if switching MA type.
Use on daily/4H timeframes for swing trading; alerts via email/SMS for hands-free monitoring.
Pro Tip: Combine with volume or RSI for confirmation – RISK ON + rising volume = stronger buy signal.
EMA CloudThe EMA Crossover Cloud is a clean and intuitive indicator that combines two Exponential Moving Averages (EMA) into a visual cloud.
Key features:
Cloud visualization: The space between EMA A and EMA B is shaded, making the current trend direction easier to identify.
Crossover signals: A clear LONG signal is plotted when EMA A crosses above EMA B, and a SHORT signal when EMA A crosses below EMA B.
Bar coloring: Candles are automatically colored according to the trend (uptrend, downtrend, or neutral).
Customizable colors: Cloud, signals, and bars can all be customized to match your chart style.
Alerts ready: Built-in alerts for EMA crossovers (LONG/SHORT).
Status label: A compact label shows the current cloud trend state in real time.
This indicator is ideal for traders who prefer simple and reliable crossover signals combined with a clear trend visualization. It works on any timeframe or asset.

8 SMA Bands (Points)The "8 SMA Bands (Points)" indicator creates a set of eight Simple Moving Average (SMA) bands with adjustable offsets, overlaid on a price chart.
Here’s a breakdown:
Purpose: It tracks price trends using multiple SMAs of varying lengths (default 25, 50, 100, 200, 400, 800, 1600 periods) and adds upper and lower bands around each SMA based on point offsets, helping identify potential support, resistance, and trend strength.
Key Components:
SMAs: Eight SMAs are calculated using closing prices with lengths ranging from 25 to 1600 periods. Each SMA is plotted with a distinct color and line thickness (e.g., MA 1 is blue, MA 8 is white with thicker lines).
Bands: For each SMA, upper and lower bands are created by adding or subtracting a point-based offset (suggestions are to use default Murray Math based numbers e.g., 0.305176 for MA 1, 39.062528 for MA 8) multiplied by a global multiplier (default 1.0). These offsets define the band width and are customizable.
Customization: Users can adjust SMA lengths, offset points, colors, and the global multiplier via input settings grouped by each MA.
Visuals: SMAs are plotted as solid lines with increasing thickness for longer periods (e.g., MA 6–8 use thicker lines or circles).
Bands are plotted as semi-transparent lines matching the SMA color, with longer-term bands (MA 6–7) using a different style for emphasis.
Usage: The indicator helps traders visualize trend direction (upward if price is above most SMAs, downward if below) and potential reversal zones where price interacts with band boundaries.
The flattening or crossing of bands can signal momentum shifts. The coming together of multiple envelope tops/bottoms can signal reversal zones of various degrees based on how many envelopes come together. More envelopes converging mean a more significant top or bottom.
This indicator is particularly useful for identifying multi-timeframe trends and volatility zones on assets like Gold Futures, with flexibility to fine-tune based on market conditions.

Trend Candle CounterComplete Tutorial: Trend Candle Counter Pine ScriptTable of Contents
Installation Guide
Understanding the Indicator
How It Works
Customization Options
Trading Strategies
Setting Up Alerts
Troubleshooting
1. Installation Guide {#installation}Step-by-Step Installation:Step 1: Open TradingView
Go to www.tradingview.com
Log in to your account
Step 2: Access Pine Editor
Click on "Pine Editor" tab at the bottom of the chart
Or press Alt + E (Windows) or Option + E (Mac)
Step 3: Create New Indicator
Click "Open" → "New blank indicator"
Delete any default code
Step 4: Paste the Script
Copy the entire Trend Candle Counter script
Paste it into the editor
Step 5: Save and Apply
Click "Save" (or Ctrl + S)
Give it a name: "Trend Candle Counter"
Click "Add to Chart"
✅ Done! The indicator should now appear on your chart.2. Understanding the Indicator {#understanding}What Does It Do?This indicator numbers each candle based on the current trend: {scrollbar-width:none;-ms-overflow-style:none;-webkit-overflow-scrolling:touch;} ::-webkit-scrollbar{display:none}Trend TypeNumberingVisualUptrend+1, +2, +3, +4...🟢 Green labelsDowntrend-1, -2, -3, -4...🔴 Red labelsTrend ChangeResets to ±1Label color switchesVisual Components:
Candle Labels - Numbers above each candle
Trend Line (EMA) - Green (up) / Red (down)
Background Shading - Light green/red tint
Info Table - Top-right corner showing:
Current trend direction
Current candle number
Current price
3. How It Works {#how-it-works}Trend Detection Logic:IF Close > EMA → UPTREND (positive counting)
IF Close < EMA → DOWNTREND (negative counting)
Counting Mechanism:Example Uptrend:Candle 1: Close > EMA → Label: +1
Candle 2: Close > EMA → Label: +2
Candle 3: Close > EMA → Label: +3
Candle 4: Close < EMA → Label: -1 (trend changed!)
Example Downtrend:Candle 1: Close < EMA → Label: -1
Candle 2: Close < EMA → Label: -2
Candle 3: Close < EMA → Label: -3
Candle 4: Close > EMA → Label: +1 (trend changed!)
Key Insight:The higher the absolute number, the longer the trend has been running!4. Customization Options {#customization}Accessing Settings:
Click the gear icon ⚙️ next to the indicator name
Go to "Inputs" tab
Available Parameters: {scrollbar-width:none;-ms-overflow-style:none;-webkit-overflow-scrolling:touch;} ::-webkit-scrollbar{display:none}ParameterDefaultDescriptionRecommendationTrend Detection Length14EMA period for trend5-10: Scalping14-20: Day trading50-200: Swing tradingShow Candle Numbers✅ YesDisplay labelsDisable for cleaner chartLabel SizeSmallSize of numbersTiny: Multi-timeframeLarge: Focus on one chartUptrend ColorGreenPositive number colorCustomize to preferenceDowntrend ColorRedNegative number colorCustomize to preferenceOptimization by Trading Style:For Scalpers (1m - 5m charts):Trend Detection Length: 5-10
Label Size: Tiny
Show Labels: Optional (can be cluttered)
For Day Traders (15m - 1h charts):Trend Detection Length: 14-20
Label Size: Small
Show Labels: Yes
For Swing Traders (4h - Daily charts):Trend Detection Length: 50-100
Label Size: Normal
Show Labels: Yes
5. Trading Strategies {#strategies}Strategy 1: Trend Reversal TradingEntry Signals:
Buy: When counter changes from negative to +1
Sell: When counter changes from positive to -1
Confirmation:
Wait for +2 or -2 to confirm trend strength
Use additional indicators (RSI, MACD) for validation
Example:Candle: -5, -6, -7, -8, +1, +2 ← BUY HERE
Stop Loss: Below the -8 candle low
Target: When counter reaches +8 to +10
Strategy 2: Trend Continuation TradingEntry Signals:
Buy: Enter on pullbacks during uptrend (e.g., at +3, +5, +7)
Sell: Enter on bounces during downtrend (e.g., at -3, -5, -7)
Risk Management:
Avoid entering at high numbers (+15, -15) - trend may be exhausted
Example:Candle: +1, +2, +3 ← Small pullback, BUY
Continue: +4, +5, +6, +7
Exit: When counter resets to -1
Strategy 3: Trend Exhaustion DetectionWarning Signs:
Counter reaches +10 or higher → Uptrend may be overextended
Counter reaches -10 or lower → Downtrend may be overextended
Action:
Tighten stop losses
Take partial profits
Watch for reversal patterns (doji, engulfing)
Strategy 4: Multi-Timeframe AnalysisSetup:
Add indicator to 3 timeframes (e.g., 15m, 1h, 4h)
Look for alignment
Best Trades:15m: +1 (new uptrend)
1h: +5 (established uptrend)
4h: +3 (strong uptrend)
→ HIGH PROBABILITY BUY
6. Setting Up Alerts {#alerts}Built-in Alert Conditions:The script includes 2 automatic alerts:
"Uptrend Started" - Triggers when counter = +1
"Downtrend Started" - Triggers when counter = -1
How to Set Up Alerts:Step 1: Right-click on chart
Select "Add Alert"
Step 2: Configure Alert
Condition: Select "Trend Candle Counter"
Choose: "Uptrend Started" or "Downtrend Started"
Options:
Once per bar close (recommended)
Webhook URL (for automation)
Step 3: Notification Settings
✅ Popup
✅ Send email
✅ Push notification (mobile app)
✅ Play sound
Step 4: Create Alert
Click "Create"
Custom Alert Ideas:Alert for Specific Candle Numbers:
Notify when counter reaches +5 or -5
Notify when counter exceeds +10 or -10 (exhaustion)
7. Troubleshooting {#troubleshooting}Common Issues & Solutions:Issue 1: Labels are too cluttered
Solution:
Disable "Show Candle Numbers" in settings
Use larger timeframe
Reduce label size to "tiny"
Issue 2: Too many false signals
Solution:
Increase "Trend Detection Length" (e.g., 20, 50)
Wait for +2 or -2 confirmation
Combine with other indicators
Issue 3: Trend line doesn't match price action
Solution:
Adjust EMA length to match your trading style
Consider using different trend detection (SMA, HMA)
Issue 4: Indicator not showing on chart
Solution:
Check if it's in a separate pane - move to main chart
Refresh the page
Re-add the indicator
Issue 5: Counter seems delayed
Solution:
This is normal - indicator confirms on candle close
For faster signals, use lower timeframe
Reduce EMA length (but expect more noise)
8. Advanced Tips 💡Combining with Other Indicators:Best Combinations:
RSI + Trend Candle Counter
Buy at +1 when RSI > 50
Sell at -1 when RSI < 50
MACD + Trend Candle Counter
Confirm +1 with MACD bullish crossover
Confirm -1 with MACD bearish crossover
Volume + Trend Candle Counter
Strong trends (+1) should have increasing volume
Low volume at high numbers (+10) = exhaustion
Reading Market Psychology: {scrollbar-width:none;-ms-overflow-style:none;-webkit-overflow-scrolling:touch;} ::-webkit-scrollbar{display:none}Counter ValueMarket Psychology+1 to +3Early adopters entering+4 to +7Momentum building+8 to +12FOMO phase+13+Extreme greed - caution!-1 to -3Early sellers-4 to -7Panic building-8 to -12Capitulation-13+Extreme fear - reversal likely9. Real Trading Example 📊Scenario: BTC/USD 1H ChartTime | Counter | Action
--------|---------|----------------------------------
10:00 | -8 | Downtrend established
11:00 | -9 | Still falling
12:00 | -10 | Exhaustion zone - watch closely
13:00 | +1 | ✅ BUY SIGNAL - Trend reversal!
14:00 | +2 | Confirmation - trend valid
15:00 | +3 | Hold position
16:00 | +4 | Add to position (optional)
17:00 | +5 | Move stop loss to breakeven
...
22:00 | +11 | Take partial profits
23:00 | +12 | Tighten stop loss
00:00 | -1 | ❌ EXIT - Trend reversed

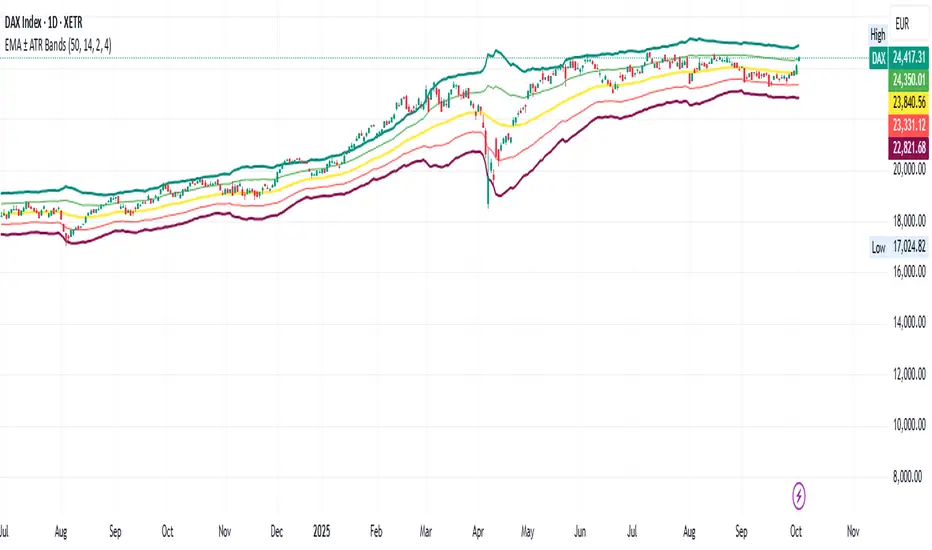
EMA ± ATR BandsPlot the bands from EMA as potential points where may want to enter/exit on principle that price returns to mean over time.
This script was created using Chat GPT.
Atlantean Sideways / Range Regime DetectorPurpose
When using trend based indicators, you can skip the false signals when there is a sideways action, protecting you from the false signals.
Flags likely sideways/range phases using three checks:
Weak trend (ADX from DMI)
Price compression (Bollinger Band Width, normalized)
Low volatility (NATR = ATR/Price%)
Logic
isSideways = (ADX < adxThresh) AND (bbNorm < 0.25) AND (NATR < natrMax)
When true: bars + background turn teal and a provisional Range High/Low (rolling rangeWin) is drawn.
Key Inputs
DMI: diLen(22)
Optimized for 15 mins Bitcoin, could change it to 14 for more general approach
ADX: adxSmooth(14), adxThresh(18)
Volatility: lenATR(14), natrMax(1.8)
Visuals: rangeWin(20), bar/range toggles
Quick Tuning
More signals: raise adxThresh to 20–25, raise natrMax to 2.5–4.0, increase BB cutoff by editing bbNorm < 0.25 --> 0.35–0.50.
Smoother range lines: increase rangeWin to 30–40.
Use Cases
Mean reversion inside teal ranges.
Breakout prep when price closes outside the drawn range after teal ends. Could be used as a signal although not suggested.
Filter trend systems: skip trades when sidewaysCond is true. This is the main purpose, for it to be combined with trend based indicators, like Supertrend.
Alert
“Sideways Detected” triggers when isSideways is true.
Script could be expanded upon your requests.

Open Range Breakout (ORB) with Alerts and LabelsThis is a classic 5min ORB indicator that highlights the orb range for your chosen session. This makes it easy to reference the range later in the trading day. In addition to the original orb signals for both buy and sell you can play off that zone for powerful entries later in the session. The signals give TP1 1:1 TP2 2:1
Options
You can set the name of the session
The color of the range.
The buffer for the SL
How many entries for the orb